Doppler Technology and Technique
TWO-DIMENSIONAL ECHOCARDIOGRAPHY PROVIDES remarkable high-resolution, full motion display of cardiac structures. Yet despite the ability to reveal the most intricate anatomic detail, two-dimensional imaging is unable to visualize blood flow. Blood flow in cardiac chambers and the great vessels is simply presented in black on the two-dimensional display. Since the movement of blood is the raison d’être of the cardiovascular system, this limitation presents a serious challenge to the diagnostic capability of echocardiography. Doppler ultrasonography overcomes this limitation in the assessment of blood flow. Its color flow display affords the echocardiographer dramatic views of blood flow. In addition, spectral Doppler provides the tools to quantify the magnitude and direction of flow. Since Doppler evaluation is quantitative, it provides a means of grading the severity of disease in many cases in which two-dimensional echocardiography merely demonstrates the presence of an abnormality. As such, mastery of Doppler examinations is a critical element in the training of a perioperative echocardiographer.
DOPPLER FREQUENCY SHIFT
Doppler examinations are based on principles fundamentally different from those underlying two-dimensional imaging. As is addressed in the sections that follow, these differences necessitate altered approaches and techniques when Doppler examinations are performed. Many times, the required view and imaging frequencies are contrary to those selected for two-dimensional imaging of the same anatomic region. To obtain an optimal assessment of both the form and function of the desired cardiac structure, it is essential to remain cognizant of the underlying physical principles of the two approaches and how they differ.
The Doppler Effect
As explained in Chapter 1, two-dimensional imaging is based on the intensity and time delay of reflected ultrasound. To determine the velocity of blood flow, Doppler systems examine the change in frequency of the ultrasound reflected from red blood cells. Our ability to use the movement of red blood cells to gauge blood flow velocity dates back to the experiments of the Austrian physicist Christian Doppler. Trumpeters on a high-speed locomotive played a tone at a specific pitch so that the effects of motion on sound frequency could be examined. A second group of musicians stationed on a loading dock played the same tone as the train passed by. As Doppler had predicted, the two tones were audibly different. The change in pitch, known as the Doppler effect, occurs because the motion of an object causes the sound wave to be compressed in the direction of the motion and expanded in the direction opposite to the motion.
Signal Frequency and Blood Flow
Red blood cells reflect ultrasound as they travel through the blood stream. By directing an ultrasound signal at flowing blood and listening for the change in frequency produced by the red cell reflections, Doppler echocardiography can assess the direction and speed of blood flow.
Figure 5.1 illustrates the principle of the Doppler effect for cardiac applications. When ultrasound is transmitted to blood, it is scattered by the multitude of red blood cells, and a small portion of this scattering is reflected back toward the transducer. The strength of the echoes returning to the transducer is related to the number of particles reflecting the ultrasound. If the hematocrit is increased, more interfaces are available for reflection and the ultrasound signal is stronger. However, this effect is self-limited because at a hematocrit exceeding 30%, the reflected signal strength is weakened by destructive interference. Modern echocardiography systems are designed to detect Doppler signals over a wide range of hematocrit values.
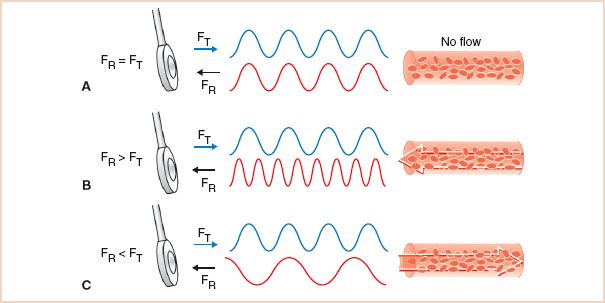
FIGURE 5.1 Detecting blood flow: Effects of red cell motion on ultrasound frequency. The motion of an object alters the frequency of a reflected ultrasound signal. A: The reflected echoes from a stationary target are of the same frequency as the transmitted signal. B: Objects such as red blood cells moving toward the transducer compress the sound signal, and the reflected frequency is increased. C: When red cells travel away from the transducer, the frequency of the reflected echoes is decreased. These modulations in the frequency of the reflected ultrasound are used to detect blood flow. FT, transmitted signal frequency; FR, reflected signal frequency.
If the red cells are stationary, the signal is reflected at the same frequency as the transmitted signal. Since no Doppler frequency shift occurs, the situation is similar to that of two-dimensional echocardiography. When blood flows toward the ultrasound transducer, the reflected signal is compressed by the motion of the red cells, and its frequency is higher than that of the transmitted signal. Conversely, when blood flows away from the ultrasound transducer, the frequency of the reflected signal received by the transducer is lower than that of the transmitted signal. The technical term for the alterations in the frequency of the ultrasound signals caused by the Doppler effect is modulation. Through analysis of the modulated signal, both the direction and speed of the red blood cells can be determined.
DOPPLER ANALYSIS
The Doppler Equation: Linking the Frequency Shift to Velocity
The Doppler equation describes the relationship between the alteration in ultrasound frequency and blood flow velocity (Fig. 5.2):
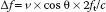
where Δf is the difference between transmitted frequency (ft) and received frequency, v is blood velocity, c is the speed of sound in blood (1,540 m/s), and θ is the angle of incidence between the ultrasound beam and blood flow.
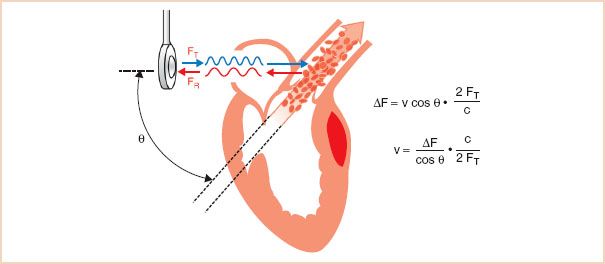
FIGURE 5.2 Calculating blood flow velocity: The Doppler equation. The Doppler equation calculates blood flow velocity based on two variables: The Doppler frequency shift (ΔF) and the cosine of the angle of incidence between the ultrasound beam and the blood flow. The Doppler frequency shift is measured by the echocardiographic system, but cos θ is unknown, and manual entry by the echocardiographer is required for its estimation. v, blood flow velocity; FT, transmitted signal frequency; FR, reflected signal frequency; ΔF, difference between FR and FT; c, speed of sound in tissue; θ, angle of incidence between the orientation of the ultrasound beam and that of the blood flow.
Conceptually, the equation can be simplified based on the observation that the change in ultrasound frequency is directly related to just two variables: Blood velocity and cos θ. The remaining factors in the equation, the speed of sound in blood (c) and the transmitted frequency (ft), are constants. The Doppler signal is shifted only by the component of the blood velocity that is in the direction of the beam path (i.e., v cos θ). For example, when the direction of the ultrasound beam is parallel to the blood flow, the observed Δf fully reflects total blood velocity (cos θ = 1). With nonparallel orientation of the ultrasound beam to blood flow, Δf is reduced by the factor cos θ. As illustrated in Figure 5.3, when the beam angle divergence is small, the effects on Δf are limited. However, with angles greater than 30 degrees, the value of cos θ decreases rapidly. When the direction of the beam is perpendicular to the blood flow (90 degrees, cos 90 = 0), the movement of blood is no longer appreciated by the Doppler system (Δf = 0).
FIGURE 5.3 Cosine relationship. Most devices default to a simplified Doppler equation in which cos θ is ignored, with the assumption that the Doppler beam is nearly parallel to the blood flow so that the cos θ factor is negligible. However, at angles between beam and blood flow greater than 30 degrees, a precipitous drop in the cosine curve results in a substantial underestimation of blood flow velocity. θ, angle of incidence between the orientation of the ultrasound beam and that of the blood flow.
Implications of Beam Orientation
The effect of the beam angle on Doppler measurements has important clinical implications. In clinical practice, the ultrasound system measures the frequency shift to calculate velocity. By rearranging the Doppler equation, the calculated blood velocity is derived as follows:
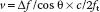
The angle of incidence between the beam and the blood flow is not easily determined. Although a two-dimensional image of the blood vessel allows the echocardiographer to estimate the angle in the x– and y-planes, the orientation in the z-plane remains indeterminate. Assessment of the interrogation angle is further complicated by eccentrically directed blood flow, as in mitral regurgitation. Most Doppler systems default to a value of cos θ of 1, with the assumption that the echocardiographer has directed the ultrasound beam to be nearly parallel with the blood flow of interest. This approach has the advantages of stronger Doppler signals and a lower rate of errors as a consequence of the plateau shape of the cosine curve at angles of low incidence. Therefore, in clinical practice, the transducer should be positioned such that the beam and blood flow are nearly parallel for accurate velocity calculations. Figure 5.3 illustrates the basis for the clinical practice of requiring the beam angle to be within 30 degrees of the direction of blood flow, so that the rate of angle-related errors remains less than 15%. The assumption that the orientation of the ultrasound beam is parallel to the blood flow leads to a common error in Doppler velocity calculations. Because of the shape of the cosine curve, when the incident angle between the beam and the blood flow is greater than 30 degrees, the blood flow is markedly underestimated (Fig. 5.4). However, even the 30-degree standard may not be acceptable in certain conditions. For example, when very high velocities are interrogated, as in aortic stenosis, even a 15% underestimation will correspond to a large difference in velocity and may result in an underestimation of the severity of aortic stenosis.
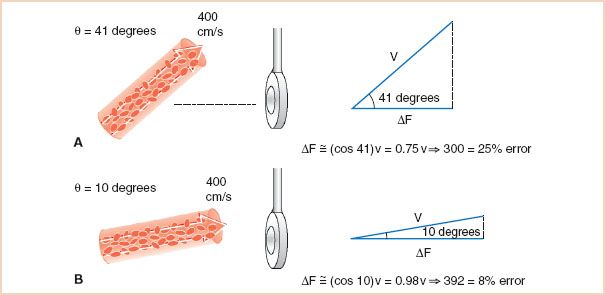
FIGURE 5.4 Underestimation of blood flow velocity with nonparallel beam orientation. A: With an angle of 41 degrees, the vector component of blood flow velocity in the direction of the ultrasound beam is only 75% of the total. Therefore, a velocity estimation based on ΔF alone will lead to a clinically unacceptable underestimation of the true blood flow velocity of 25%. B: With an angle of 10 degrees, the vector component of blood flow velocity in the direction of the ultrasound beam is 92%, and the practice of ignoring the cos θ leads to a clinically acceptable 8% underestimation of velocity. ΔF, difference between FR and FT; v, blood flow velocity; θ, angle of incidence between the orientation of the ultrasound beam and that of the blood flow.
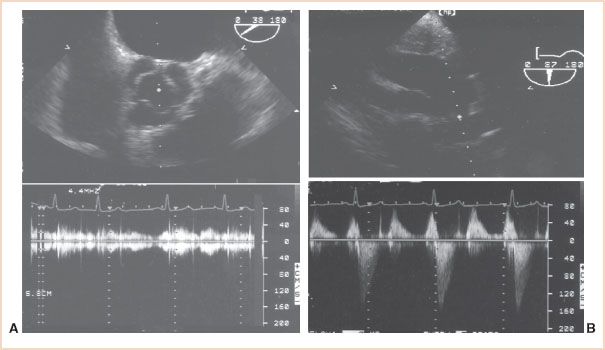
FIGURE 5.5 Comparison of views selected for two-dimensional imaging versus Doppler flow measurement. A: Two-dimensional echocardiography from the midesophageal aortic valve short-axis view (top) provides high-fidelity images of the valve leaflets and their excursion. Since the direction of blood flow is orthogonal to the ultrasound beam in this view, the continuous wave Doppler measurement of blood flow velocity (bottom) will substantially underestimate blood flow velocity. B: After repositioning of the probe to obtain the transgastric long-axis view (top), the direction of the ultrasound beam is parallel to the left ventricular outflow tract and ascending aorta, providing excellent continuous wave measurements of blood flow velocity (bottom).
Clinical Caveats in Transesophageal Echocardiographic Doppler Examinations
1. Positioning the transesophageal echocardiography (TEE) probe so that the orientation of the Doppler beam is parallel to the blood flow is often a significant challenge. Unlike the position of a transthoracic probe, which can be moved freely about the chest wall to achieve proper orientation, the position of the TEE probe is limited to the confines of the esophagus and stomach.
2. The standard views used for two-dimensional imaging are often inadequate for Doppler assessments. Optimal two-dimensional images are obtained by directing the beam perpendicular to the structure of interest to obtain strong, mirror-like reflections. Paradoxically, Doppler measurements are best obtained when the beam is parallel to the blood flow to avoid underestimates of blood flow velocity. The view that provides the best two-dimensional image of a structure typically provides only limited flow information and can result in a failure to detect abnormal flow. Figure 5.5 illustrates the application of this principle in examining the aortic valve.
Isolating the Doppler Frequency Shift
For the Doppler system to determine the frequency shift caused by red blood cells, it must first distinguish red cell–modulated echoes from all the other nonfrequency-shifted echoes created by reflections from tissue (Fig. 5.6). This demodulation process is often accomplished by comparing the returning echoes with internal reference signals that are in phase and 90 degrees out of phase with the transmitted signal, a process known as quadrature demodulation. Once the Doppler signal has been isolated, its frequency content can then be determined by means of the fast Fourier transform technique. This approach transforms the demodulated Doppler signal into its individual frequency components. The process is analogous to identifying the individual harmonics that comprise a musical chord. At each time point, the analysis provides the range of frequencies (i.e., velocities) detected and their magnitude (i.e., the number of red cells moving at this speed).
FIGURE 5.6 Looking for a needle in a haystack. Extracting the low-frequency, low-amplitude Doppler signal for the received composite signal is a technical challenge requiring several procedures, including demodulation and fast Fourier transform. Once isolated, the Doppler frequencies can be analyzed and displayed.
Related posts:
Stay updated, free articles. Join our Telegram channel

Full access? Get Clinical Tree


