Artery
Depth (mm)
Window
Flow direction
Transducer orientation
MFV (cm/s)
Ophthalmic artery
40–50
Orbital
Toward
Slightly medial
16–26
Middle cerebral artery (MCA)
35–60
Temporal
Toward
En face
46–86
Anterior cerebral artery (ACA)
60–75
Temporal
Away
Anterior
41–76
Posterior cerebral artery (PCA)
60–75
Temporal
Toward
Posterior
33–64
Vertebral artery
45–75
Transforaminal
Away
Superior and oblique
27–55
Basilar artery
70–120
Transforaminal
Away
Superior
30–57
With advances in ultrasound equipment and the utilization of gray-scale, color Doppler flow, and spectral Doppler imaging, direct visualization of the vessel and more accurate flow velocity measurements are now possible. Imaging of the circle of Willis is performed via a transtemporal approach utilizing a 5–1 MHz sector-array transducer with most of the imaging being performed at the lower frequencies (1–2 MHz) to allow penetration of the temporal bone. The transducer is placed on the temporal bone either above the zygomatic arch and anterior to the external auditory canal or slightly more cephalad and posterior over the earlobe. Imaging is performed from the left and right temporal bones with color Doppler flow imaging utilized to visualize the vessels. Flow velocity measurements (both MFV and peak systolic velocity) are obtained. With the transtemporal approach, visualization of the MCA, ACA, PCA, and terminal ICA is possible. At our institution, spectral Doppler waveforms and flow velocities are obtained from the proximal, mid, and distal MCA and single measurements are obtained in the visualized portion of the ACA, PCA, and terminal ICA.
The basilar and distal vertebral arteries can be visualized via a transforaminal approach. The vertebral arteries enter the skull base through the foramen magnum and then join to form the basilar artery at the base of the medulla oblongata. The basilar artery courses cephalad, anterior to the medulla and pons, in the prepontine cistern. To visualize these vessels utilizing the transforaminal window, the transducer is placed in the midline below the occiput and angled cephalad (Fig. 1).
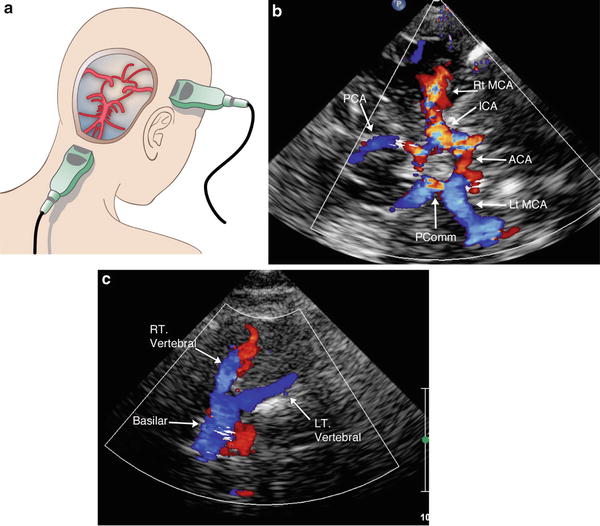

Fig. 1
Transtemporal and transforaminal acoustic windows (a). The transducer is placed superior to the zygomatic arch and anterior to the external auditory canal or more cephalad above the earlobe for the transtemporal approach. For the transforaminal approach, the transducer is placed in the midline below the occiput and angled cephalad. Utilizing the transtemporal approach and color Doppler flow imaging, the circle of Willis can be visualized (b). The transforaminal approach allows visualization of the basilar and vertebral arteries (c). ACA anterior cerebral artery, ICA terminal internal carotid artery, MCA middle cerebral artery, PCA posterior cerebral artery, PComm posterior communicating artery
The ophthalmic artery and carotid siphon of the ICA can be visualized via the transorbital window. The probe is lightly placed on the closed eyelid with a small amount of gel applied to the closed eyelid to aid in acoustic transmission (Fig. 2).
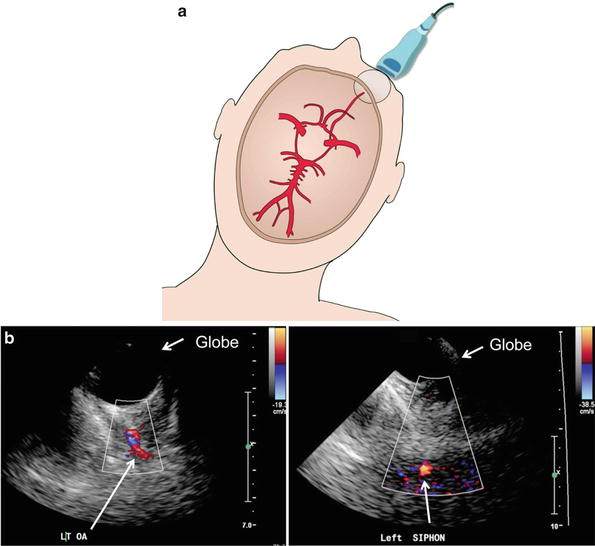

Fig. 2
Transorbital acoustic window: The transducer is placed lightly on the closed eyelid (a) and utilizing the globe as an acoustic window, the ophthalmic artery and carotid siphon can be visualized by color Doppler flow imaging (b). OA ophthalmic artery (Image used with permission from Kirsch et al. [1])
The open fontanelles in infants provide an excellent acoustic window for visualizing the intracerebral vessels. High-frequency (5–10 MHz) linear, curved, or sector transducers can be used depending on the size of the child. Utilizing the anterior fontanelle, the ICA, MCA, ACA, and anterior communicating artery (AComm) can be visualized in the coronal plane (Fig. 3). Midline sagittal imaging allows visualization and flow velocity measurements from the ACA, pericallosal, callosomarginal, and frontopolar arteries in addition to the vein of Galen (Fig. 4). Patency of the superior sagittal sinus can be demonstrated through the anterior fontanelle or an open sagittal suture in the coronal or sagittal planes (Fig. 5). The posterior circulation can be imaged through a transforaminal approach, as in the adult, or through an open posterolateral fontanelle just posterior to the mastoid process.
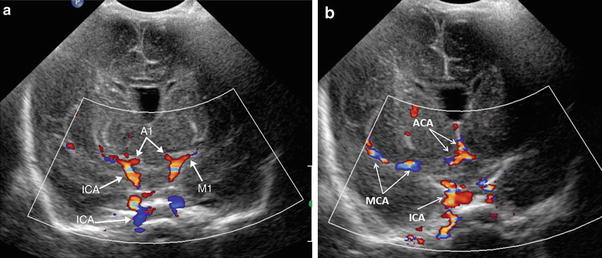
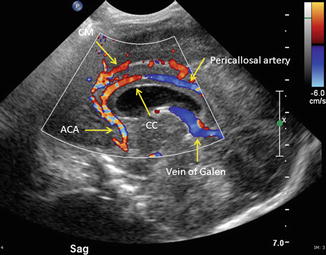
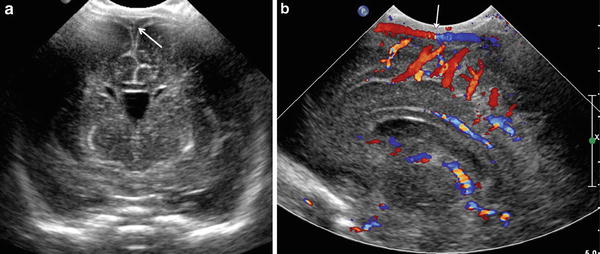

Fig. 3
Coronal color Doppler flow imaging through the circle of Willis (a, b), utilizing the anterior fontanelle as an acoustic window, demonstrates the A1 segments of the anterior cerebral artery (ACA), M1 segments of the middle cerebral arteries (MCA), and the intracranial internal carotid artery (ICA)

Fig. 4
Sagittal midline color Doppler flow imaging through the anterior fontanelle demonstrates the pericallosal artery, the callosomarginal artery (CM), the anterior cerebral artery (ACA), the vein of Galen, and the corpus callosum (CC)

Fig. 5
Coronal gray-scale (a) and sagittal color Doppler flow imaging (b) through the anterior fontanelle demonstrate the superior sagittal sinus (arrows)
Physics of Doppler Ultrasound
An understanding of the basic underlying physical principles related to spectral Doppler ultrasound is essential for the interpretation of transcranial Doppler measurements and results. All vascular studies utilizing spectral Doppler make use of two well-known physical principles when measuring flow velocities and evaluating for stenosis and/or vasospasm: the Doppler effect and Bernoulli’s principle.
The Doppler effect, first described in 1842 by the physicist Christian Doppler, relates the change in frequency of a sound wave observed (or other periodic event) if the source of the wave is moving relative to the observer. This effect is commonly seen in everyday life when an automobile with a siren passes by. The sound waves increase in frequency as the car approaches the observer and decreases in frequency as the car passes by resulting in a frequency shift in the sound of the siren heard by the observer. For flowing blood, a similar shift in frequency is noted when interrogated by the sound beam from an ultrasound transducer. The sound wave is emitted from the transducer at a certain frequency, f o , and is then reflected back to the transducer from the moving red blood cells at a different frequency, f r . This frequency shift (f d = f r − f o ) and its relation to velocity can be expressed by the following equation:
 where v is the velocity of the flowing blood, c is the speed of the sound wave, and θ is the angle between the incident beam of the sound wave arising from the transducer and the direction of blood flow within the vessel (Fig. 6). From the equation, it becomes apparent that the most accurate flow velocities would be obtained with the transducer parallel to the direction of blood flow as θ = 0 and cos θ = 1. The greatest error in measurement and loss of signal would occur as the angle approached 90° and cos θ approaches zero. It is recommended that velocity measurements be obtained with θ < 60° to obtain the most accurate measurements.
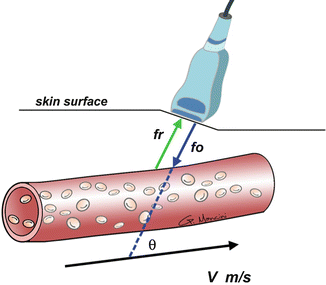


Fig. 6
Doppler effect. The velocity of blood flow can be calculated utilizing the Doppler effect. The ultrasound transducer emits a sound wave pulse at a certain frequency, f o , which is reflected off the moving red blood cells back to the transducer at a different frequency, f r . This resulting frequency shift (f d = f r − f o ) can be used in the Doppler equation to calculate the velocity of the flowing blood. The angle, θ, is the angle between the incident sound wave beam and the direction of the flowing blood. The most accurate flow velocity measurements are obtained with θ < 60° (Image used with permission from Kirsch et al. [1])
The Doppler equation allows one to not only calculate the velocity of the flowing blood but also its direction. A shift to a higher frequency is a positive Doppler shift and indicates flow toward the transducer. A shift to a lower frequency is a negative Doppler shift and indicates flow away from the transducer. This frequency shift and directionality can be color-coded to indicate flow direction. Conventionally with color Doppler flow imaging, red is used to indicate flow toward the transducer and blue for away; however, this color designation is arbitrary and can be switched so attention must be paid to the color bar on the image. The color on the top of the bar is toward the transducer and the color below is away (Fig. 7).
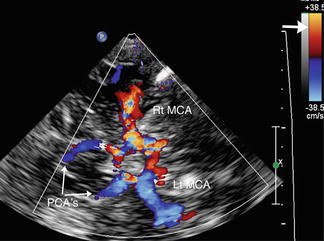

Fig. 7
Color Doppler flow imaging allows one to visualize vessels more easily and also encode flow direction by the color map. The color bar in the upper right-hand corner (thick arrow) denotes flow direction. Although the color designation is arbitrary and can be reversed, the colors on the top half of the bar codes are for flow toward the transducer (red) and the colors on the bottom, away (blue). In this example, the right MCA is flowing toward the transducer and the left MCA and PCAs are flowing away
Bernoulli’s principle, as applied to flowing liquids, can be utilized for the diagnosis of areas of stenosis and vasospasm. According to the principle, as fluid flows through conduits of differing diameters, the velocity and pressure associated with the fluid will change. As fluid flows from a conduit (or blood vessel) of greater diameter to one of smaller diameter, the flow velocity must increase to allow the same volume of blood to flow through the narrower area (this is analogous to one putting one’s thumb over the opening of a garden hose as water is flowing out resulting in a high-velocity jet of water being formed). Bernoulli’s principle and the law of conservation of energy also state that the pressure in the region of increased velocity will decrease (Fig. 8). The increase in velocity noted in areas of narrowing is a mainstay for diagnosing stenosis or vasospasm in blood vessels. As described above, these flow velocities can be easily calculated by the Doppler equation. As elucidated by Spencer and Reid [4], there is a fairly linear relationship between flow velocity and the degree of stenosis (up to a critical stenosis at which point flow velocities decline due to extreme narrowing of the vessel). In general, the higher the velocity of the blood flow, the greater the degree of stenosis or vasospasm.


Fig. 8
Bernoulli’s principle. As fluid (blood) flows through conduits of differing diameters, the velocity and pressure of the fluid will change. As blood flows from a vessel of greater to narrowed diameter (either due to vasospasm or stenosis), the velocity of the blood will increase in the area of narrowing and its pressure will decrease. This principle, along with the Doppler effect, allows for ultrasonographic detection of areas of vasospasm or stenosis (Image used with permission from Kirsch et al. [1])
Spectral Doppler allows measurements of flow velocity in a specified area of a vessel (the sample volume) over time and displays these flow velocities as a time/velocity curve throughout the cardiac cycle. From this waveform, peak systolic velocity (PSV), the velocity of the flowing blood at the peak of systole on the curve, and end-diastolic velocity (EDV), the velocity just before the next systolic upstroke, can be measured. The spectral waveform also indicates directionality of flow. Conventionally, a waveform above the baseline (positive) indicates flow toward the transducer and a waveform below the baseline (negative) indicates flow away. Again, close attention should be paid to the scale as this can be inverted on the screen. The spectral line and the area underneath it (the spectral envelope) can indicate the type of flow present. A narrow spectral line with a clear envelope beneath it indicates fairly uniform (laminar) flow with a narrow range of velocities. Filling in of the spectral window indicates a broader range of flow velocities within the sample volume consistent with turbulent flow seen with stenosis or narrowing (Fig. 9). The amount of flow during the different portions of the cardiac cycle provides information as to whether the vessel is feeding a high-resistance system such as a muscle bed or extremity or a low-resistance system such as an end organ. High-resistance waveforms will have little to no flow during diastole, whereas low-resistance waveforms will have more abundant forward flow during diastole.
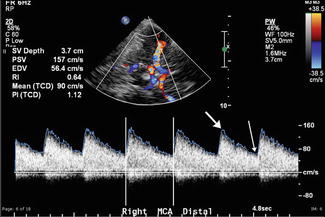

Fig. 9
Spectral Doppler waveform. The spectral Doppler waveform is a time/velocity curve that demonstrates the blood flow velocities over time within a defined sample window in the vessel being evaluated. The area below the curve or spectral line is called the spectral envelope or window. With turbulent blood flow, this window will “fill in” representing the myriad flow velocities associated with turbulent flow (as seen in this example). The spectral Doppler also can be used to measure peak systolic velocity (thick arrow) and end-diastolic velocity (thin arrow) from which the mean flow velocity and the resistive index can be calculated (table to left of CDF image). A waveform above the baseline (positive) indicates flow toward the transducer and a waveform below indicates flow away from the transducer
The resistive index (RI) is a measure of the resistance to the flow of blood into an organ and is calculated utilizing the following formula:
 In low-resistance waveforms, EDV will be fairly high as there is forward flow of blood into the organ during diastole and the ratio will, therefore, be lower. In organs or systems that have a high resistance to blood flow, EDV will fall toward zero and the ratio will approach 1.

Mean flow velocity (MFV) can be calculated from the spectral Doppler waveform and is essentially the average flow velocity over the time/velocity waveform. Thresholds for PSV and MFV have been determined that correlate with varying degrees of vasospasm (see section “Vasospasm”).
Applications of Transcranial Doppler Ultrasound
Vasospasm
Transcranial Doppler ultrasound has found its greatest application in the neurosurgical intensive care unit screening patients for vasospasm secondary to subarachnoid hemorrhage (SAH) from aneurysmal rupture. Vasospasm is used to describe both the clinical picture of delayed-onset neurological deficits following SAH and the imaging findings of vessel narrowing. Vasospasm from SAH has been associated with a 15–20 % risk of stroke or death [5]. About half of those affected will demonstrate clinical signs and symptoms. It has been reported that vasospasm doubles the risk for mortality in SAH [6–9].
Vasospasm following SAH is generally absent in the first 72 h post bleed. Vasospasm generally occurs by day 3, peaking between days 6 and 12, and then resolving 15–20 days after the bleed [10]. The clinical findings associated with vasospasm usually manifest themselves 4–5 days post hemorrhage. Insidious onset of confusion and decreasing levels of consciousness are the initial presenting signs which may progress to focal neurologic defects, infarction, coma, and death. The severity and extent of vessel narrowing has been seen to correlate with the clinical findings.
The pathogenesis of cerebral vasospasm is poorly understood but results primarily from prolonged smooth muscle contraction. Data suggests that calcium-dependent and calcium-independent vasoconstriction is taking place. Breakdown products from the blood in the subarachnoid space may also be playing a direct or indirect role. Other factors such as an imbalance between vasoconstrictors and vasodilators including nitric oxide, prostaglandins, prostacyclin, free radicals, and endothelin may also be involved in the pathogenesis of vasospasm following SAH [11].
Screening of patients at risk for vasospasm is essential as patients cannot be placed prophylactically on treatment for potential vasospasm. Medical treatment for vasospasm consists of “triple-H therapy”: induced hypertension, hemodilution, and hypervolemia which are all aimed at improving cerebral perfusion. Calcium channel blockers, such as nimodipine, have also been recommended but should be used cautiously to avoid the deleterious effects of hypotension [7]. Unfortunately, these treatments carry their own inherent risks and potential complications including renewed bleeding from the aneurysm site or into areas of infarction, increased cerebral edema, myocardial infarction, and congestive heart failure. If medical therapy is ineffective, catheterization of the cerebral vessels can be performed with a vasodilating agent injected. TCDI allows for quick and noninvasive screening and monitoring of the patients in the ICU setting for vasospasm to determine if medical or interventional treatment is necessary.
Vasospasm results in a narrowing of the vessel lumen, and as noted above, the velocity of the blood flow within a vessel is inversely proportional to its diameter until a critical narrowing (usually greater than 95 %) is reached at which point blood flow through the extremely narrowed vessel actually decreases. In general, the higher the velocity, the greater is the degree of vasospasm.
For intracranial vessels, cutoff values for PSV and MFV have been established that correlate with various degrees of vasospasm in the MCA and for the presence of vasospasm in the ACA or PCA (Tables 2 and 3). For the MCA, MFV in the 120–150 cm/s range correlates with mild vasospasm, whereas MFV in the 150–200 cm/s and 200–250 cm/s ranges correlate with moderate and severe vasospasm, respectively [2, 4, 12].
Table 2


MCA evaluation for vasospasm: Mean flow velocity, peak systolic velocity, and Lindegaard ratio cutoffs used at our institution for evaluation of varying degrees of vasospasm in the middle cerebral arteries
Stay updated, free articles. Join our Telegram channel

Full access? Get Clinical Tree


