Mean sac diameter (mm)
Predicted age range (weeks) = 95 % CI
2
5.0 (4.5–5.5)
3
5.1 (4.6–5.6)
4
5.2 (4.8–5.7)
5
5.4 (4.9–5.8)
6
5.5 (5.0–6.0)
7
5.6 (5.1–6.1)
9
5.9 (5.4–6.3)
10
6.0 (5.5–6.5)
11
6.1 (5.6–6.6)
12
6.2 (5.8–6.7)
13
6.4 (5.9–6.8)
14
6.5 (6.0–7.0)
15
6.6 (6.2–7.1)
16
6.7 (6.3–7.2)
17
6.9 (6.4–7.3)
18
7.0 (6.5–7.5)
19
7.1 (6.6–7.6)
20
7.3 (6.8–7.7)
21
7.4 (6.9–7.8)
22
7.5 (7.0–8.0)
23
7.6 (7.2–8.1)
24
7.8 (7.3–8.3)
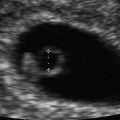
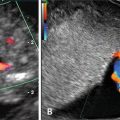
One measurement that has been used with high accuracy is the mean sac diameter (MSD). This measurement is obtained by taking the average of the measurements of the GS in three planes: coronal, sagittal, and transverse [1]. The MSD is useful early in the first trimester, but loses accuracy when it becomes greater than 14 mm, at which time the fetal pole should become visible. When measuring the dimensions of the GS, calipers should be placed on its borders and care should be taken to avoid including the surrounding decidual tissue [4] (Fig. 9.1).


Fig. 9.1
The fetal pole and yolk sac can be seen within this gestational sac. Caliper measurements of the gestational sac are taken in the coronal and transverse planes. A third measurement will be taken in the sagittal plane to complete the three required measurements. The fetal crown-rump length will be used for the most accurate dating
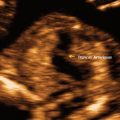
Caution must be exercised in differentiating a true gestational sac from a pseudosac or a small intrauterine fluid or blood collection, both of which can be associated with ectopic or failed pregnancies [1] (Fig. 9.2). A true GS should typically be located eccentrically within the endometrial cavity due to it being embedded within the decidual layer [1]. There should also be evidence of the “double ring” sign, which refers to two echogenic rings surrounding the gestational sac. These rings represent the chorionic cavity with its associated villi and the surrounding developing decidua [5] (Fig. 9.3). If eccentric location of the GS with a double ring sign are not seen in a woman with a positive pregnancy test, a viable intrauterine pregnancy cannot be excluded, but these findings should raise suspicion for abnormal or extrauterine pregnancy, and close clinical follow-up is indicated [6].


Fig. 9.2
This fluid collection within the uterus is a “pseudo sac” in the setting of an abdominal pregnancy. Note the central location and absence of two echogenic rings. These characteristics help to distinguish this from a true gestational sac associated with viable intrauterine pregnancy

Fig. 9.3
“Double ring sign.” The gestational sac can be seen with the eccentrically located fetal pole measured within. The two echogenic rings surrounding the gestational sac are clear in this image
Yolk Sac
The yolk sac (YS) first appears within the GS at 5 weeks of gestation, and is frequently the first identifiable structure within the GS [1, 7, 8]. Functioning as the first nutritional and metabolic support for the developing embryo prior to establishment of the placenta, it also offers ultrasonographic confirmation of intrauterine pregnancy [9] (Fig. 9.4).


Fig. 9.4
Normal yolk sac. The yolk sac (above) can be seen in close proximity to the fetal pole (below). The hypoechoic developing rhombencephalon can be seen at the right end of the fetal pole
While usually apparent by week 5 of gestation, the YS may not be visible until later, when the MSD is closer to 8 mm [7]. It is connected to the embryo by the vitelline duct. When the amnion forms around the fetus, the YS is then seen as an extra-amniotic structure. The YS progresses in size to a usual maximum of 6 mm around 10 weeks, and then regresses until it is absorbed between the amnion and chorion by the completion of week 12–13 [10]. Measurement of the YS should be performed by placing the calipers on the innermost border of the echogenic rim [11].
Nomograms relating YS size with gestational age have been developed [12], but due to marked variation in normal pregnancies, YS diameter should not be used a primary means of pregnancy dating [10].
As mentioned previously, the YS offers confirmation of intrauterine pregnancy, and can even help to indicate amnionicity in multiple gestations, as the number of YSs should correlate with the number of amniotic sacs if the embryos are viable [8]. This can be particularly important in higher order multiple gestations.
Marked variation in the size and shape of the YS can be noted. These variations may be of significance. A small or large YS (<3 mm prior to 6–10 weeks and >7 mm prior to 9 weeks) may be suspicious for an abnormally developing pregnancy. These cases should be followed up with repeat ultrasound evaluation to confirm progression of the pregnancy [1]. Absence of the YS or embryo in the presence of a MSD of ≥25 mm is diagnostic of a failed pregnancy with specificity and positive predictive value approaching 100 % [12]. Echogenic, irregularly shaped, or persistent YS, particularly after 12 weeks gestation, are of uncertain significance [13].
Crown-Rump Length
The fetal pole is first visible by transvaginal ultrasound at 5 weeks gestation with cardiac activity notable by 6–6.5 weeks gestation [1]. It is important to note that fetal heart rates can be slower than anticipated in these very early pregnancies, but should be within the normal range by 8 weeks gestation.
The first true fetal biometric measurement possible is the crown-rump length (CRL). By definition, the CRL is not actually measured from the fetal crown to its rump, but instead the longest linear dimension from the cephalic to the caudal end of the embryo with the fetus in neutral position (Fig. 9.5). In early gestation, between 6 and 9 weeks, fetal posture makes little difference in the CRL measurement, but beyond this point, flexion or extension can cause significant discrepancy.


Fig. 9.5
Crown-rump length. Here the calipers are placed at the cephalic and caudal ends of the fetus. This fetus appears to be slightly flexed at the time of measurement
Obtaining the CRL should be done in a standardized fashion to increase the accuracy of the measurement. A midsagittal section of the embryo should be captured and the image maximized to fill the majority of the screen. Care should be taken to attempt capturing this image with the embryo in neutral position, avoiding hyperflexion or extension. The two ends of the embryo should be well defined, and the caliper function on the ultrasound machine used to capture the measurement. In extremely early gestations, the cephalic and caudal ends of the fetus may not be distinguishable. In this scenario, the greatest longitudinal measurement should be obtained [14] (Fig. 9.6).


Fig. 9.6
Crown-rump length. This early crown-rump length measurement demonstrates the difficulty in identifying cephalic and caudal ends of the embryo at this early gestational age. Here, the greatest longitudinal measurement is obtained. The yolk sac can be seen in close proximity to the fetal pole
The primary importance of the CRL measurement is in pregnancy dating. One of the first to pursue the biometric measurement of the fetal pole was Dr. Hugh Robinson, who worked with Professor Ian Donald at The Queen Mother’s Hospital in Glasgow, Scotland. In early 1970s, he published works that gave validity to the use of ultrasound in the measurement of the early fetal pole. In one study, he evaluated women between 6 and 14 weeks gestation with regular cycles and known last menstrual periods by B-mode transabdominal ultrasound techniques [15]. He plotted his measurements against menstrual age, and in those with missed abortion, against the physical measurement of the conceptus after delivery. He noted a high degree of correlation between ultrasound measurements and menstrual age. Despite the most rudimentary of ultrasound equipment, his meticulous measurements have stood the test of time and are still used over 40 years later. Hence, first-trimester ultrasound with measurement of CRL is now considered the most reliable method of pregnancy dating with known and unknown last menstrual period. More recently, the accuracy of transvaginal ultrasound as a means for pregnancy dating was confirmed in a study by Pexters et al. showing that in 54 patients, CRL and MSD measurements showed high interobserver and intraobserver correlation, and were highly reproducible [16].
Many studies have been completed in different populations to assess the ability to generalize these initial nomograms. One such study was performed by Papageorghiou et al. in eight geographically different countries. Data from 4265 women were included to determine an equation that would be generalizable to multiple populations [17]. Many nomograms for CRL have been developed over the years. Based on the population, prediction equations can differ significantly. For example, the CRL curves developed by Robinson and Pexsters differ at very early gestations, but are very similar after about 8 weeks. Most published CRL curves differ very little from the measurement published by Dr. Robinson in 1973 (Tables 9.2 and 9.3).
Table 9.2
Gestational age estimation by crown-rump length (CRL): Robinsona
Fetal CRL (mm) | Gestational age (weeks + days) |
|---|---|
5 | 6 + 0 |
10 | 7 + 1 |
15 | 7 + 6 |
20 | 8 + 4 |
25 | 9 + 2 |
30 | 9 + 6 |
35 | 10 + 2 |
40 | 10 + 6 |
45 | 11 + 2 |
50 | 11 + 5 |
55 | 12 + 1 |
60 | 12 + 3 |
65 | 12 + 6 |
70 | 13 + 1 |
75 | 13 + 4 |
80 | 13 + 6 |
85 | 14 + 1 |
Formula | GA (days) = 8.052 × (CRL × 1.037)1/2 + 23.73 |
Table 9.3
Gestational age estimation by crown-rump length (CRL): Pexstersa
Mean CRL (mm) | Gestational age (weeks + days) |
|---|---|
0.4 | 5 + 5 |
1.1 | 5 + 6 |
1.9 | 6 + 0 |
2.7 | 6 + 1 |
3.5 | 6 + 2 |
4.3 | 6 + 3 |
5.2 | 6 + 4 |
6.1 | 6 + 5 |
7.0 | 6 + 6 |
8.0 | 7 + 0 |
8.9 | 7 + 1 |
9.9 | 7 + 2 |
10.9 | 7 + 3 |
12.0 | 7 + 4 |
13.1 | 7 + 5 |
14.2 | 7 + 6 |
15.3 | 8 + 0 |
16.4 | 8 + 1 |
17.6 | 8 + 2 |
18.8 | 8 + 3 |
20.0 | 8 + 4 |
21.2 | 8 + 5 |
22.5 | 8 + 6 |
23.8 | 9 + 0 |
25.1 | 9 + 1 |
26.4 | 9 + 2 |
27.8 | 9 + 3 |
29.2 | 9 + 4 |
30.6 | 9 + 5 |
32.0 | 9 + 6 |
33.5 | 10 + 0 |
35.0 | 10 + 1 |
36.5 | 10 + 2 |
38.1 | 10 + 3 |
39.6 | 10 + 4 |
41.2 | 10 + 5 |
42.8 | 10 + 6 |
44.5 | 11 + 0 |
46.1 | 11 + 1 |
47.8 | 11 + 2 |
49.5 | 11 + 3 |
51.3 | 11 + 4 |
53.0 | 11 + 5 |
54.8 | 11 + 6 |
56.6 | 12 + 0 |
58.5 | 12 + 1 |
60.3 | 12 + 2 |
62.2 | 12 + 3 |
64.1 | 12 + 4 |
66.1 | 12 + 5 |
68.0 | 12 + 6 |
70.0 | 13 + 0 |
72.0 | 13 + 1 |
74.0 | 13 + 2 |
76.1 | 13 + 3 |
78.2 | 13 + 4 |
80.3 | 13 + 5 |
82.4 | 13 + 6
Stay updated, free articles. Join our Telegram channel
Full access? Get Clinical Tree
 Get Clinical Tree app for offline access

|
