Fig. 1
Hounsfield densities. Cerebrospinal fluid has an HU of 0 (white arrow). White matter has an HU of 25–34 (open white arrow). Gray matter has an HU of 30–40 (white arrowhead). Acute blood has an HU of 60–80 (black arrowhead). Bone has an HU near 1000 (open black arrow)
At the midpoint of the first week after the hemorrhagic event, the blood collection will begin to decrease in attenuation converging from the periphery centrally. The density is estimated to decrease by approximately 1–2 HU per day [10]. This decrease in density is attributable to the breakdown of red blood cells and subsequent removal of the components of the hematoma, most importantly hemoglobin, by phagocytic macrophages [10]. This process leads to an inhomogeneous appearance which is mildly hyperdense to isodense to brain parenchyma (HU approximately 30–50) in the subacute period (up to about 30 days) [11, 12]. After 30 days, the collection is expected to be hypodense to brain parenchyma (<30 HU) [10, 11].
In addition to the initial identification of intracranial hemorrhage, NCCT helps triage the care of the patient presenting with intracranial hemorrhage. Identification of the location of the hematoma, when taken together with the clinical picture, aids in narrowing the differential diagnosis and deciding on additional imaging [13]. Evaluating the extent of the hematoma and the associated mass effect influences immediate treatment planning, and the volume of the hematoma has been identified as an important predictor of a 30-day patient outcome [14].
NCCT Technical Considerations and Pitfalls
A simplified description of technical imaging considerations is included to highlight solutions for some common pitfalls that can be encountered. Axial images using 5 mm reconstructions are generally used in NCCT of intracranial hemorrhage, as this thickness has an adequate signal-to-noise ratio to allow for evaluation of the brain parenchyma, identification of intracranial hemorrhage, and assessment of intracranial mass effect. Unfortunately, in some cases intracranial hematoma can be obscured by nearby skeletal structures or be mistaken for dural prominence or calcifications [15]. Reviewing a wider “blood” window can improve the detection of intracranial hemorrhage which layers along the skull (Fig. 2a, b). Review of coronal and sagittal reformatted images is also paramount in all cases but particularly when findings of hemorrhage are equivocal. Reformatted images allow for visualization parallel and/or perpendicular to the long axis of the hematoma allowing for improved diagnostic accuracy [16] (Fig. 3a, b). Similarly, thin-cut images may help resolve any questionable areas (Fig. 2c). In the interest of time, thin section cuts should only be created and reviewed when there is a specific area of concern. Review of bone algorithm reconstructions is also suggested (particularly in cases of trauma) for identification of skull fractures which will heighten the readers’ suspicion of underlying intracranial hemorrhage and help to exclude mimickers of hemorrhage like small calcifications (Fig. 3c).
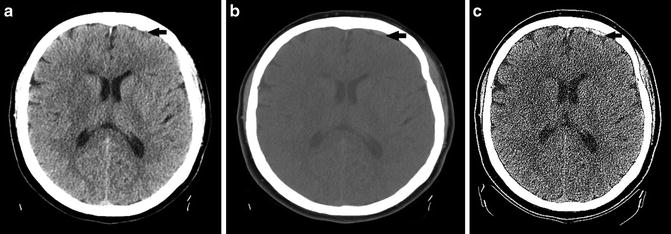
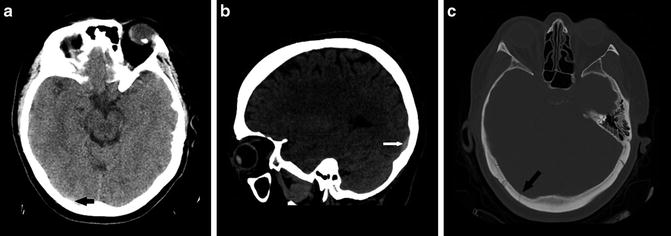
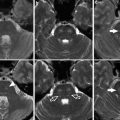
Fig. 2
(a) Focus of extra-axial hemorrhage layering along the left frontal region is poorly seen with standard windowing secondary to adjacent skull (black arrow). (b) Focus of hemorrhage is more conspicuous with wider “blood” window (black arrow). (c) Focus of hemorrhage is made even more conspicuous using thin-cut slices (black arrow). Note the increased noise associated with the thinner cut
Fig. 3
(a) Subtle focus of hemorrhage along the posterior skull is very difficult to identify (black arrow). (b) Sagittal image in wider blood window allows visualization parallel to the long axis of the hemorrhage increasing conspicuity (white arrow). (c) Bone algorithm window shows a skull fracture, heightening the reader’s attention for subtle hemorrhage (black arrow)
It is important to note that in the first minutes after hemorrhage, there is a partial overlap between the HU of blood products and that of brain parenchyma, creating a potential pitfall in diagnosis. Similarly, intracranial hemorrhage can remain occult in patients with low hematocrit because of isodensity to brain parenchyma [17]. In such cases, and in those where there is a high index of suspicion for intracranial hemorrhage without definite CT abnormality, MRI should be recommended for further evaluation.
Magnetic Resonance Imaging in Intracranial Hemorrhage
The evaluation of blood products on magnetic resonance imaging (MRI) is much more involved than on CT. The appearance depends on a myriad of biologic factors which evolve with time and vary based on operator-dependent factors. A basic understanding of magnetic properties as well as the biologic and technical factors which affect the appearance of intracranial blood products aids in overcoming confusion and avoiding potential pitfalls. What follows is a description of the key factors involved and their effects on the appearance on intracranial blood products.
Magnetic Susceptibility
Magnetic susceptibility refers to the measure of substances’ interaction and response to an applied magnetic field [18, 19]. In simplified terms, the magnetic susceptibility of a substance can be attributed to the pairing of its valence electrons [19]. Those substances which have no unpaired valence electrons are termed diamagnetic. Paired electrons in an orbital have opposing spins which cancel each other, resulting in no magnetic dipole when placed in a magnetic field [19]. When a diamagnetic substance is placed in an applied magnetic field, its valence electrons do experience minimal alterations in their orbital motion, however [19]. According to Lenz’s law, this results in a weak induced magnetic field which opposes the applied field [20].
In contrast to diamagnetic substances, paramagnetic substances have unpaired valence electrons. When placed in a magnetic field, the spins of the valence electrons align with the magnetic field creating a magnetic dipole which augments the applied field [19, 20]. In human tissues, the magnetic dipole of paramagnetic substances allows them to undergo proton-electron dipole interactions with local protons (i.e., those in water molecules) [21]. These interactions have a profound effect on the magnetic microenvironments of human tissues, most significantly affecting the longitudinal relaxation of nearby protons, resulting in T1 shortening [20, 22]. For this discussion, it is important to note that the strength of dipole interactions varies inversely with the sixth power of the distance between the dipoles [23]. Also, as magnetic field strength increases, paramagnetic properties become more pronounced because paramagnetic substances augment the applied field more so than diamagnetic substances oppose it [24]. Relevant compounds are classified based on their magnetic susceptibility in Table 1.
Table 1
Purely diamagnetic and paramagnetic substances
Purely diamagnetic | Paramagnetic |
|---|---|
Water | Deoxyhemoglobin |
Oxyhemoglobin | Methemoglobin |
Most soft tissue | Hemosiderin/ferritin |
Bone | Gadolinium |
MRI of Intracranial Hemorrhage: Biologic Factors
Several biologic factors contribute to the characteristic appearance of intracranial blood products on MRI. As time passes, intracranial blood products are exposed to metabolic processes and variations in their local environment which alter their chemical and magnetic properties. What follows is a brief description of these processes and the resultant effects they have on the MRI signal produced.
Hemoglobin Structure, Iron, and Oxygenation
Hemoglobin is a metalloprotein composed of four protein moieties, each of which contains a heme subunit. Each heme subunit is composed of a porphyrin ring with a central iron atom which can reversibly bind oxygen [25] (Fig. 4). In oxyhemoglobin, an iron atom is reversibly bound to oxygen in the ferrous state (+2). Oxyhemoglobin has no unpaired outer electrons and is therefore diamagnetic [26].
Fig. 4
The heme subunit of hemoglobin
In oxygen-poor environments (i.e., the intracranial hematoma), hemoglobin releases its bound oxygen leaving deoxyhemoglobin with four unpaired electrons and the paramagnetic properties that come with them [26]. From the discussion above, this would lead the reader to believe that the presence of deoxyhemoglobin in human tissues would result in dipole interactions with consequential T1 shortening. The magnetic properties of deoxyhemoglobin are more complex, however. For dipole interactions to occur between the valence electrons of iron and the protons of water molecules, they must be able to approach within 3 Å of each other [23]. The loss of oxygen from hemoglobin causes a shift in its three-dimensional configuration, displacing the iron atom of the heme subunit out of the plane of the porphyrin ring [25, 27]. This shift effectively increases the dipolar distance between iron and nearby water proton dipoles, preventing any significant dipolar interactions [21, 27] (Fig. 5). The result is a lack of marked T1 shortening in the presence of deoxyhemoglobin.
Fig. 5
(a) In plane view of the oxyhemoglobin molecule. The oxygen-iron bond is indicated by an arrow. (b) When oxygen is released by hemoglobin, the iron atom shifts out of plane from the heme subunit. This shift prevents water molecules from approaching within 3 Å of the valence electrons of iron, preventing dipolar interactions. This figure was created using graphics reproduced under the GNU Free Documentation License (Citation: http://commons.wikimedia.org/wiki/File:Heme_deoxy_vs_oxygenated.jpg created by user Mrbean427 and http://commons.wikimedia.org/wiki/File:Dipole_H2O.svg user NEUROtiker)
With further exposure to an oxygen-poor environment, deoxyhemoglobin is oxidized into methemoglobin whose iron atom is in the Ferric state (+3) and unable to bind oxygen [25]. The associated conformational change decreases the dipolar distance between the unpaired valence electrons of iron and nearby water protons, allowing for proton-electron dipole interactions [22, 26, 28]. Therefore, when methemoglobin is present, there is a significant T1 shortening in the intracranial hematoma.
As time progresses, methemoglobin is further oxidized, metabolized, and phagocytosed yielding residual iron atoms which are scavenged and stored as hemosiderin and ferritin [29]. The scavenged iron is paramagnetic, but because of the structures of hemosiderin and ferritin, water cannot closely approach it and proton-electron dipolar interactions are not possible [20, 30–32].
Plasma, Red Blood Cell Membranes, and Blood Breakdown Products
Freshly extruded plasma (prior to clot formation) has high water content, admixed serum proteins, and intact red blood cells. The high water content of extruded plasma causes T2 prolongation compared to brain parenchyma [33]. As time progresses, clot begins to form, water is resorbed, and serum proteins are concentrated with subsequent clot retraction. These processes all have minor contributions to T2 shortening of the evolving hematoma [34]. Red blood cell (RBC) membranes remain intact early on after extrusion, sequestering hemoglobin. In the oxygen-poor environment of the hematoma, oxyhemoglobin is converted to deoxyhemoglobin and then later to methemoglobin. In this way, the RBC effectively creates a paramagnetic microenvironment in contrast to the diamagnetic microenvironment external to it. Diffusing water molecules experience the gradient created by this magnetic field inhomogeneity, which dephases their protons and results in T2 shortening [24, 35, 36]. When the RBCs lyse, the deoxy- and methemoglobin are no longer sequestered, and the field inhomogeneity is lost. Finally, after progressive metabolism, paramagnetic iron atoms are taken up and sequestered by hemosiderin and ferritin. This again results in magnetic field inhomogeneity which dephases diffusing water protons with resultant T2 shortening [30]. The effects of biological materials on T1 and T2 in intracranial hemorrhage are listed in Table 2.
Table 2
Biologic factors affecting T1 and T2
Biologic factors | T1 | T2 | Field strength dependent (T2) | How does it work on T1? | How does it work on T2? |
|---|---|---|---|---|---|
Fresh plasma | −/↓ | ↑ | No | High protein content | High water content |
Deoxyhemoglobin | − | ↓ | Yes | N/A | Susceptibility |
Methemoglobin | ↑ | ↓ | Yes | Dipole interactions | Susceptibility |
Hemosiderin/ferritin | − | ↓ | Yes | N/A | Susceptibility |
RBC membrane | − | ↓ | Yes | N/A | Susceptibility |
MRI of Intracranial Hemorrhage: Technical Considerations
The appearance of intracranial blood products can be significantly altered depending on the magnetic field strength and the pulse sequence used. Magnetic field strength imparts its influence by altering susceptibility-induced T2 effects. The inverse of the T2 relaxation rate varies quadratically with the field strength [24, 37, 38]. This relationship is a product of the relatively increased magnetization of paramagnetic compounds in relation to diamagnetic compounds at higher field strengths [24]. This exaggerated difference in magnetization results in greater magnetic field inhomogeneity between paramagnetic and diamagnetic microenvironments causing more pronounced T2 shortening (T2 darkness).
Gradient recall echo (GRE) sequences are highly sensitive to susceptibility effects caused by magnetic field in homogeneities [38–40]. GRE sequences are, in turn, highly sensitive for the detection of intracranial hemorrhage and highly accurate at predicting its extent [38, 41]. This makes GRE particularly valuable in the hyperacute and chronic periods, when blood products might otherwise remain inconspicuous [38, 39]. As a result, GRE sequences have become widely incorporated in standard MRI protocols for the evaluation of intracranial hemorrhage.
Fast spin echo (FSE) sequences have become a mainstay of standard MRI protocols, widely replacing conventional spin echo. By using shorter interecho times and closely spaced pulses, FSE allows for significant reductions in scan times [42, 43]. These shorter echo times have been shown to cause increased T2 prolongation by a variety of mechanisms [42]. An untoward result of this T2 prolongation is a decreased sensitivity to T2 susceptibility effects, although the clinical significance of this has been questioned [43]. Nevertheless, it is recommended that GRE sequences be included in standard MRI protocols to ensure that high sensitivity for small amounts of blood products is maintained despite the usage of FSE.
CT Angiography of Intracranial Hemorrhage
CT angiography (CTA) is a useful adjunct to both NCCT and MRI in the evaluation of patients with acute intracranial hemorrhage. CTA images can be rapidly acquired and reconstructed to allow intricate visualization of the intracranial vessels in multiple planes and projections. It has high sensitivity, specificity, and diagnostic accuracy in identifying vascular causes of intraparenchymal hemorrhage and can be beneficial in evaluating the vascularity of hemorrhagic neoplasms [44–48].
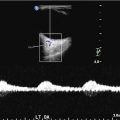
In addition to its role in diagnosis, CTA can provide valuable prognostic information in the patient with intracranial hemorrhage. The CTA “spot sign” is a high-attenuation focus within an intracerebral hematoma which represents a site of extravasation [49] (Fig. 6). In patients with intracerebral hematoma, the “spot sign” has been identified as a predictor of hematoma progression, longer mean hospital stay, in-hospital mortality, and poor overall outcomes in survivors [50–53].
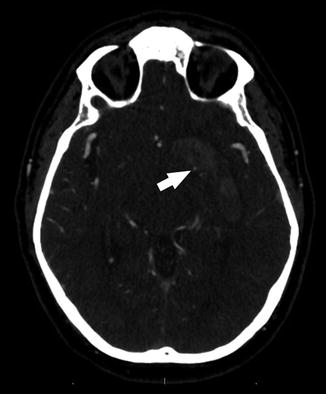
Fig. 6
The CTA “spot sign”: a high-attenuation focus along the medial aspect of an intracranial hematoma (arrow)
CTA: Pitfalls in Evaluating Causes of Intracranial Hemorrhage
Although CTA plays an important role in the evaluation of patients with intracranial hemorrhage, it has several notable limitations. Reconstructed images (i.e., volume-rendered and maximum-intensity-projection images) can enhance artifacts and are susceptible to data loss, potentially confusing the diagnosis of vascular pathology [54]. Pitfalls such as this can be avoided by reviewing the source images in all cases and using multiplanar reformatted images (which contain all source data), rather than relying on reconstructed images [54]. Acute extraluminal blood products can also obscure evaluation of the arteries, although this can be minimized with proper arterial enhancement, as the Hounsfield density of intravenous contrast is significantly higher than that of acute extraluminal blood. Unfortunately, other artifacts are not as easily avoided as these.
Evaluation of patients with previous placement of embolic materials, endovascular coils, and surgical aneurysm clips is often suboptimal secondary to marked streak artifact. Also, CTA is limited in evaluating small arteries as well as arteries near bony structures, secondary to limited spatial resolution, poor contrast between arteries and adjacent bones, and beam-hardening artifact [55, 56]. Because of these limitations, catheter-based digital subtraction angiography (DSA) remains the gold standard in the evaluation of intracranial hemorrhage [48, 57, 58].
Magnetic Resonance Angiography of Intracranial Hemorrhage
Magnetic resonance angiography (MRA) is an extensive topic whose breadth is beyond the scope of this chapter. There are, however, important concepts which will allow for a more thorough understanding of its value and shortcomings in the diagnostic algorithm of intracranial hemorrhage. The three main types of magnetic resonance angiography are time-of-flight MRA (TOFMRA), phase-contrast MRA (PCMRA), and contrast-enhanced MRA (CEMRA). PCMRA allows for evaluation of hemodynamic flow, but its use in the anatomic evaluation of intracranial vasculature is at present dwarfed by TOFMRA. Therefore, this discussion will focus on the important strengths and weaknesses of non-contrast TOFMRA and CEMRA in the evaluation of intracranial hemorrhage.
Time of Flight
TOF imaging, in its simplest form, takes advantage of the flow of blood. In TOF, radiofrequency (RF) pulses are applied at short TRs to a given slice thickness resulting in the saturation of all the magnetic spins within the slice and suppression of their longitudinal magnetization [59]. Spins that are moving perpendicularly into and out of the slice are not saturated, however. In a given length of time, the blood that has been saturated by the RF pulses will move out of the slice and be replaced by “new” unsaturated blood. When exposed to an excitatory pulse, this “new” blood is magnetized and can undergo longitudinal relaxation with resultant bright signal (Fig. 7). The relative signal of the flowing blood will be directly related to the slice thickness and the velocity of the blood within the vessel. Maximal signal is obtained when all saturated blood is replaced with unsaturated blood. This occurs when the velocity of flow is greater than or equal to the slice thickness divided by the repetition time, represented by the equation v ≥ z/TR, where v is the velocity of flow, z is the slice thickness, and TR is the pulse repetition time [60, 61]. Additional factors that affect the signal of flowing blood include the flip angle of the pulse, the T1 of the tissue in the slice, and the orientation of the vessel to the imaging slice [59, 61]. In the case of the intracranial circulation, flow signals are optimized by selecting axial slice acquisition, which is perpendicular to the average overall intracranial arterial flow. Similarly, optimal TR and slice thickness can be selected to ensure that the signal of the static tissue is suppressed and that the signal in the vessels is maximally enhanced.
Fig. 7
New blood flows into the imaging slice displacing saturated blood. When the “new” blood arrives, it can be excited and undergoes longitudinal relaxation with resultant bright signal
TOF imaging identifies any flow within an image slice; therefore, both arterial and venous structures will produce signal. To selectively highlight the vascular structure of interest (artery or vein) and to minimize contamination of the other, saturation bands are employed. These pre-saturation bands are positioned a certain distance from the imaging slice to suppress the undesired flow signal before it arrives within the imaging slice [62] (Fig. 8).
Fig. 8
Blood within a vessel is pre-saturated upstream to the imaging slice. When the blood arrives in the imaging slice (asterisk), it has no signal because of pre-saturation
Time of Flight: Pitfalls in Evaluating Causes of Intracranial Hemorrhage
Because of its dependence on flow and spin saturation, TOF is susceptible to many artifacts. When flow within a vessel is slow or turbulent, or the orientation of flow is parallel (or near parallel) to the imaging slice, the blood spins have a longer “dwell time” within the image slice [63]. Increased “dwell time” exposes the spins to more saturating pulses, leading to suppressed signal in these portions of the vessel, which can mimic vessel narrowing or occlusion [63]. Additional sources of artifact include bright T1 substances, tissue interfaces, pulsation, and foreign bodies. Methemoglobin (T1 bright) presents a particular challenge in TOF because it is often present in hemorrhage and/or vessel thrombus. The T1 signal from methemoglobin can be difficult to suppress, and it recovers its T1 signal rapidly, decreasing the conspicuity of vessels from background tissue and even mimicking flow where there is none [58, 64]. Metallic foreign bodies (surgical clips) and tissue interfaces can dephase spins in nearby vessels causing alteration in their apparent configuration and diameter, although these are a less significant source of artifact [65, 66].
The artifacts associated with TOF can make proper evaluation of aneurysms, arteriovenous malformations (AVM), and dural venous fistulas (DAVF) very challenging. Aneurysms can contain complex flow patterns which vary based on their size and morphology. Turbulent and slow flow within the aneurysm results in loss of signal on TOF, leading to underestimation of the aneurysm volume and neck size [67]. Also, the presence of methemoglobin in thrombosed aneurysms can lead to false-positive results [66]. Similarly, AVMs and DAVFs pose a formidable diagnostic challenge on TOFMRA because of their vessel tortuosity, complex angioarchitecture, and slow-flow draining veins. These properties cause TOFMRA to overestimate the size of small AVMs and underestimate the size of large AVMs [68]. Additionally, TOF is limited in correctly interpreting small feeding arteries and in identifying draining veins of AVMs and DAVFs, which can have significant treatment implications [68, 69]. The use of higher field strength has been shown to improve characterization, but many shortcomings remain [68].
Contrast-Enhanced MRA
CEMRA employs fast spoiled gradient-recalled echo-based sequences (FSPGR) and the paramagnetic properties of gadolinium to intensify the signal within vessels. FSPGR is used to spoil the transverse magnetization of background tissues which accentuates the marked T1 shortening of intravascular gadolinium [70]. FSPGR also employs short RF pulses allowing for fast sequence times [70]. Administration of gadolinium allows for improved signal-to-noise ratio and minimizes flow-related artifacts [70].
Contrast-Enhanced MRA: Pitfalls in Evaluating Causes of Intracranial Hemorrhage
The saturation and spin dephasing effects that occur with TOF are of no consequence in CEMRA. It does, however, have its own limitations. Correct bolus timing is paramount to creating a diagnostic study but unfortunately can be very challenging to obtain [70]. When bolus timing is poor, significant artifact can limit evaluation of vascular pathology [71]. Artifacts including distortion of the size of the vessel, “ringing” within the vessel, and nontarget vessel enhancement can obscure pathology [70, 72]. In addition to bolus timing, the marked T1 shortening of methemoglobin can obscure contrast between vessels and background tissue, as it does in TOF images. Finally, limited spatial resolution in CEMRA makes it insensitive in the evaluation of small aneurysms (<3 mm) and in the evaluation of complex AVMs [73]. Artifacts and limitations of CTA and MRA are summarized in Table 3.
Table 3
MRA and CTA: sources of artifact and limitation in intracranial hemorrhage
Source | CTA | TOFMRA | CEMRA |
|---|---|---|---|
Acute blood products | + | − | − |
Methemoglobin | − | + | + |
Tissue interfaces | − | + | − |
Skeletal structures | + | − | − |
Metal/embolic materials | ++ | + | + |
Tortuous vessels | − | ++ | − |
Turbulent/slow flow | − | ++ | − |
Complex angioarchitecture | − | ++ | + |
Venous enhancement | + | + | + |
Small arteries | + | + | + |
MRA: Aneurysms, AVMs, DAVF, and Neoplasms
Despite the limitations noted above, TOFMRA and CEMRA play a role in the diagnostic work-up of patients with intracranial hemorrhage. MRA has been shown to adequately depict aneurysms greater than 3 mm, which encompasses most clinically significant aneurysms [66, 74, 75]. Additionally, MRA has been shown to be sensitive in the detection of AVMs greater than 3 cm [48]. Furthermore, the addition of contrast allows for improved delineation of aneurysm anatomy and AVM nidus as well as improved assessment of AVM drainage pattern and small arterial feeders [71, 73, 76]. The combination of TOFMRA and CEMRA can reliably diagnose moderate- and high-flow DAVF, and CEMRA has the added ability to identify the presence of cortical venous drainage [69]. MRA plays a limited role in the evaluation of intracranial neoplasms. It can identify encasement and mass effect of large arteries but does not reliably identify small arterial feeders [77].
Imaging Patterns of Intraparenchymal Hemorrhage (ICH)
Hemorrhage Etiology
There are numerous etiologies of ICH including both traumatic and nontraumatic. Among nontraumatic etiologies, about 80–90 % are “primary” ICH which is related to hypertension and/or cerebral amyloid angiopathy and the associated changes of vessel walls which leads to weakening and rupture [78–80]. Less common but still clinically relevant “secondary” causes of ICH include ruptured vascular malformations, hemorrhagic transformation of ischemia, tumor, vasculitis, anticoagulation, and cerebral venous thrombosis. Determining an exact etiology for an ICH can be challenging because multiple dynamic factors may be present in the acute neurologic patient; for instance, ICH can arise from hemorrhagic transformation of infarcted tissue, but a large ICH may also cause mass effect on surrounding tissue that restricts the perfusion gradient of the tissue and leads to surrounding infarction. Familiarity with characteristic imaging factors can improve the interpreter’s ability to troubleshoot in challenging cases.
Hypertensive Hemorrhage
Hypertension induces changes of intracranial arterial vessel walls, weakening them and allowing them to rupture leading to hypertensive ICH. These changes include smooth muscle cell hyperplasia, smooth muscle cell death, collagen replacement of the vascular walls, and arteriolar ectasia [78, 79]. The most classic locations of hypertensive ICH are the basal ganglia, thalami, pons, and cerebellum; the cerebral lobes are somewhat less common (Fig. 9) [80]. A relatively homogeneous single blood collection in these locations, without imaging evidence of an underlying etiology such as an aneurysm, is a classical appearance of these hemorrhages. Patient clinical factors include hypertension as well as other cardiovascular risk factors such as old age, smoking, and excessive alcohol use [79]. Imaging markers of diffuse microvascular disease can suggest long-standing vascular changes which predispose to hypertensive ICH. These include periventricular low attenuation on CT or FLAIR hyperintensity on MRI and numerous foci of susceptibility artifact on T2* MR sequences in characteristic locations which represent evidence of prior clinically silent “microbleeds” [81].
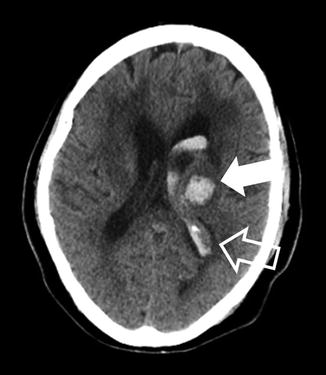
Fig. 9
Hypertensive hemorrhage into the thalamus. A 62-year-old female presenting with altered mental status related to hypertensive ICH. The hematoma is centered in the left thalamus, a classic location for hypertensive ICH (solid arrow). Note that blood has dissected into the lateral ventricle (open arrow). Also, there is a mild edema around the hematoma and lateral ventricle
In the absence of other recognized etiologies, ICH is typically assumed to be related to hypertension. It is possible that some of the ICHs attributed to hypertension are in fact occult presentations of other etiologies. Nevertheless, the pathologic effects of hypertension on other risk factors for ICH (i.e., vascular malformations) cannot be dismissed, and control of blood pressure after an ICH is of critical importance as discussed in the American Stroke Association’s most recent guidelines on intracranial hemorrhage (Class 1, Level A recommendation) [82].
Illicit Drugs
Although far less common than hypertensive ICH, illicit drug-induced ICH is presented here because its imaging findings are similar to hypertensive hemorrhage in terms of bleed location. Commonly implicated drugs include those causing hypertension, vasospasm, or even cerebral vasculitis such as cocaine, amphetamines, and MDMA (“ecstasy”). Differentiation for hypertensive ICH is typically based on clinical factors including a history of illicit drug use, younger age, and absence of classical cardiovascular risk factors. For young adults, drug use may surpass other biologic risk factors in causing ICH, although these patients often have a more favorable clinical course compared to other patients with ICH [83].
Cerebral Amyloid Angiopathy
Amyloid angiopathy is a common etiology of nontraumatic ICH, perhaps second only to hypertension [84]. Amyloid angiopathy is characterized by the deposition of β-amyloid protein into small- and medium-sized cerebral arteries [79]. The vascular insults related to cerebral amyloid angiopathy may play an important role in several dementias, and most patients presenting with ICH related to amyloid are elderly (usually >70 years). The imaging hallmark of cerebral amyloid angiopathy is hemosiderin staining secondary to multiple prior microbleeds, particularly in the cerebral lobes (Fig. 10). This is in contrast to the thalamic and basal ganglia microbleeds seen in hypertensive angiopathy. These microbleeds are most readily detected as scattered areas of susceptibility artifact on T2* images [85, 86]. The characteristic finding of multiple lobar microhemorrhages suggests the diagnosis of cerebral amyloid angiopathy even for patients who have not presented with a major ICH [85, 86].
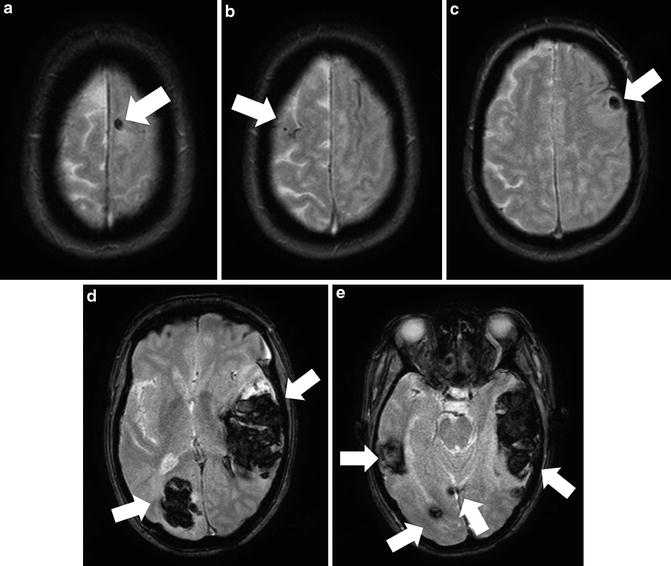
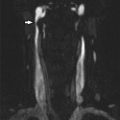
Fig. 10
A 66-year-old female with mental status changes from hemorrhages related to cerebral amyloid angiopathy. T2* GRE images show multifocal hemorrhages based in a subcortical location (solid arrows) and scattered spots of susceptibility artifact from remote microhemorrhage
Vascular Malformations
Vascular malformations are the most common cause of ICH which are secondary to specific anatomic abnormalities and are a leading cause of ICH in young adults. Vascular malformations often include vessel wall components which are not capable of withstanding the high pressure exerted within the vascular malformation, leading to ICH [87]. By far the most clinically relevant vascular malformations are arteriovenous malformations (AVMs), which lead to about 80 % of ICH due to vascular malformations [88]. These are followed in importance by cavernous malformations (CMs) and dural arteriovenous fistulas (DAVFs). Developmental venous anomalies (DVAs) and capillary telangiectasias usually do not lead to ICH unless they occur in association with other vascular anomalies. Identification of the causative vascular malformation is rarely possible using non-contrast examination, and CTA, contrast-enhanced MRI/MRA, and conventional angiography are much more sensitive.
Arteriovenous Malformations (AVMs)
Arteriovenous malformations (AVMs) are developmental lesions in which pial arteries connect directly into pial veins without an intervening capillary bed, allowing for rapid shunting of blood through the malformation and elevating pressures on the venous side. AVMs often have a characteristic “bag of worms” appearance both on imaging and gross examination due to the high flow of blood through the feeding and draining vessels (Fig. 11) [87]. A central nidus at the actual site of connection between the arterial and venous vessels is a characteristic feature although the size can vary from microscopic (nearly impossible to detect on most imaging modalities) to several centimeters in size (potentially detectable on even non-contrast CT).
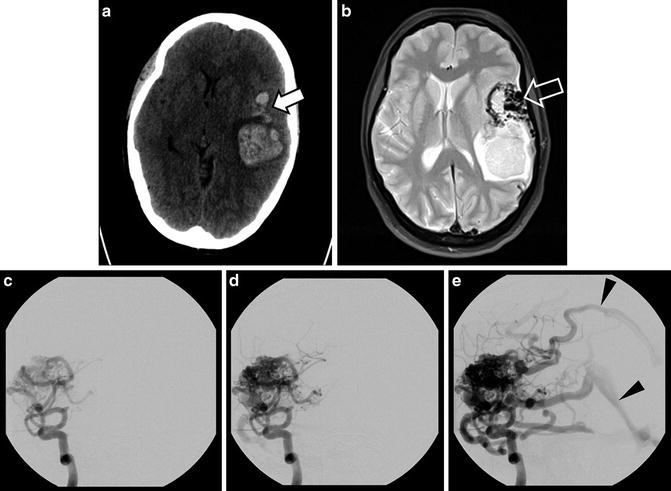
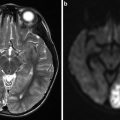
Fig. 11
AVM with hemorrhage. CT of a 43-year-old woman presenting with headache and mental status changes with a large hemorrhage in the left cerebral lobe (a); areas of irregular high attenuation are presented anterior to hematoma (solid arrow). Further evaluation with MRI reveals large flow voids with a “bag of worms” appearance on T2 image (b, open arrow). The arteriovenous malformation which led to the hemorrhage is best shown on DSA injection of the left internal carotid artery (ICA) (c–e) including early filling of draining veins (arrowheads)
The gold standard for the treatment of AVMs remains surgical excision, but therapeutic guidelines endorse a role for endovascular and radiation treatments prior to surgery for some patients. When AVMs are detected incidentally, the care team will usually opt for treatment, as they have a significant risk of future hemorrhage (approximately 2 % per year) [89]. Findings which predict that an AVM will lead to future bleeding include presenting with hemorrhage, deeper location, an associated aneurysm (reflecting multifocal weakening of vessel walls), and drainage exclusively into deep cerebral veins (veins which drain into the vein of Galen and inferior sagittal sinus as opposed to superficial veins) [90, 91].
Related posts:
Stay updated, free articles. Join our Telegram channel

Full access? Get Clinical Tree


