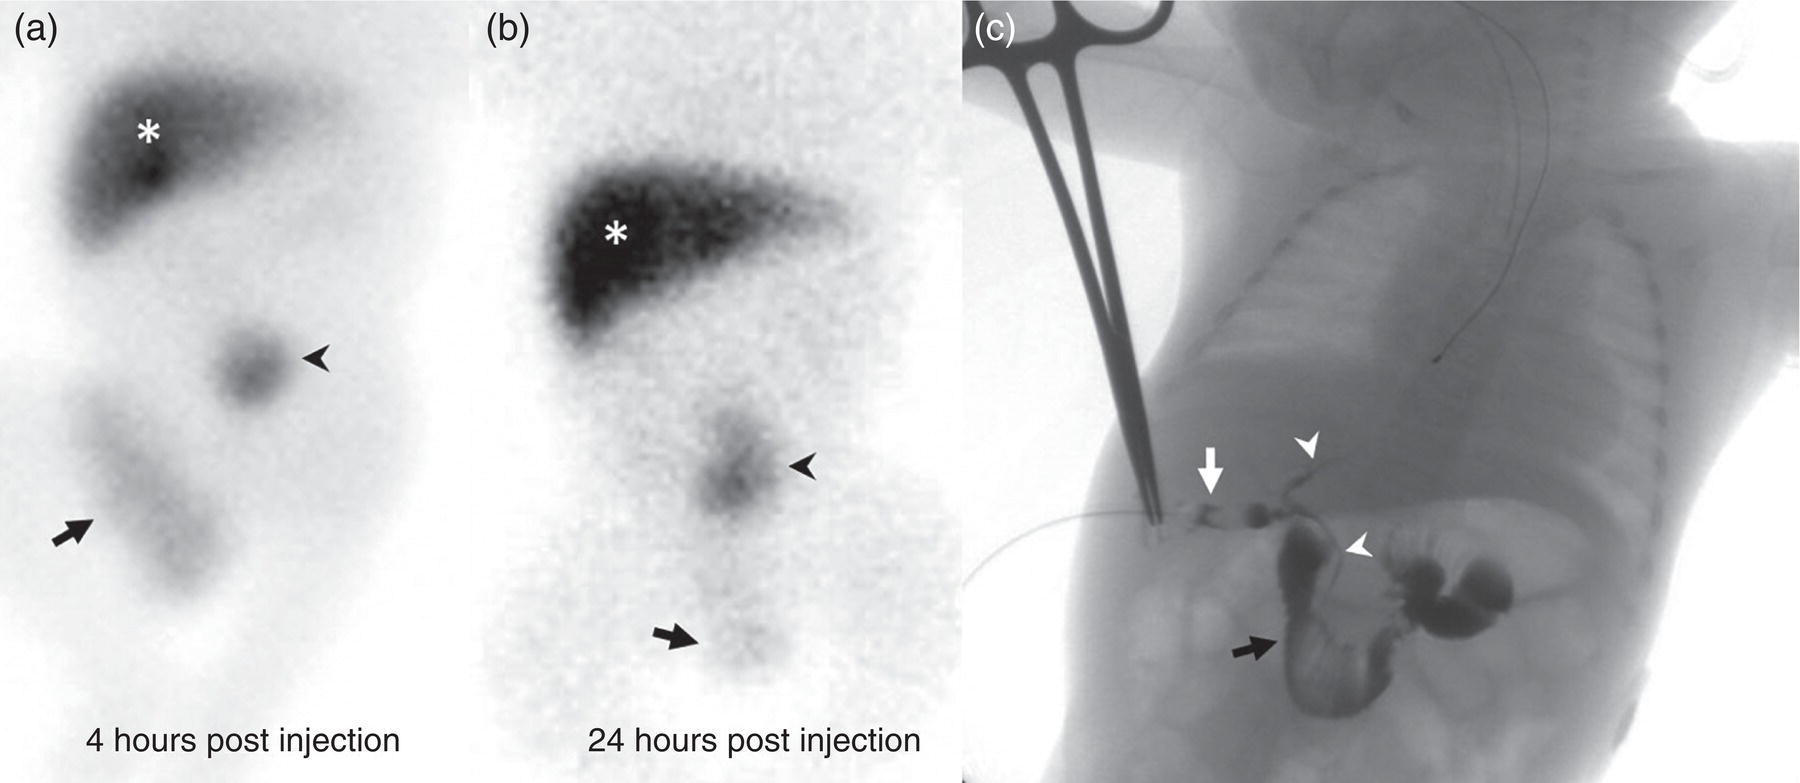
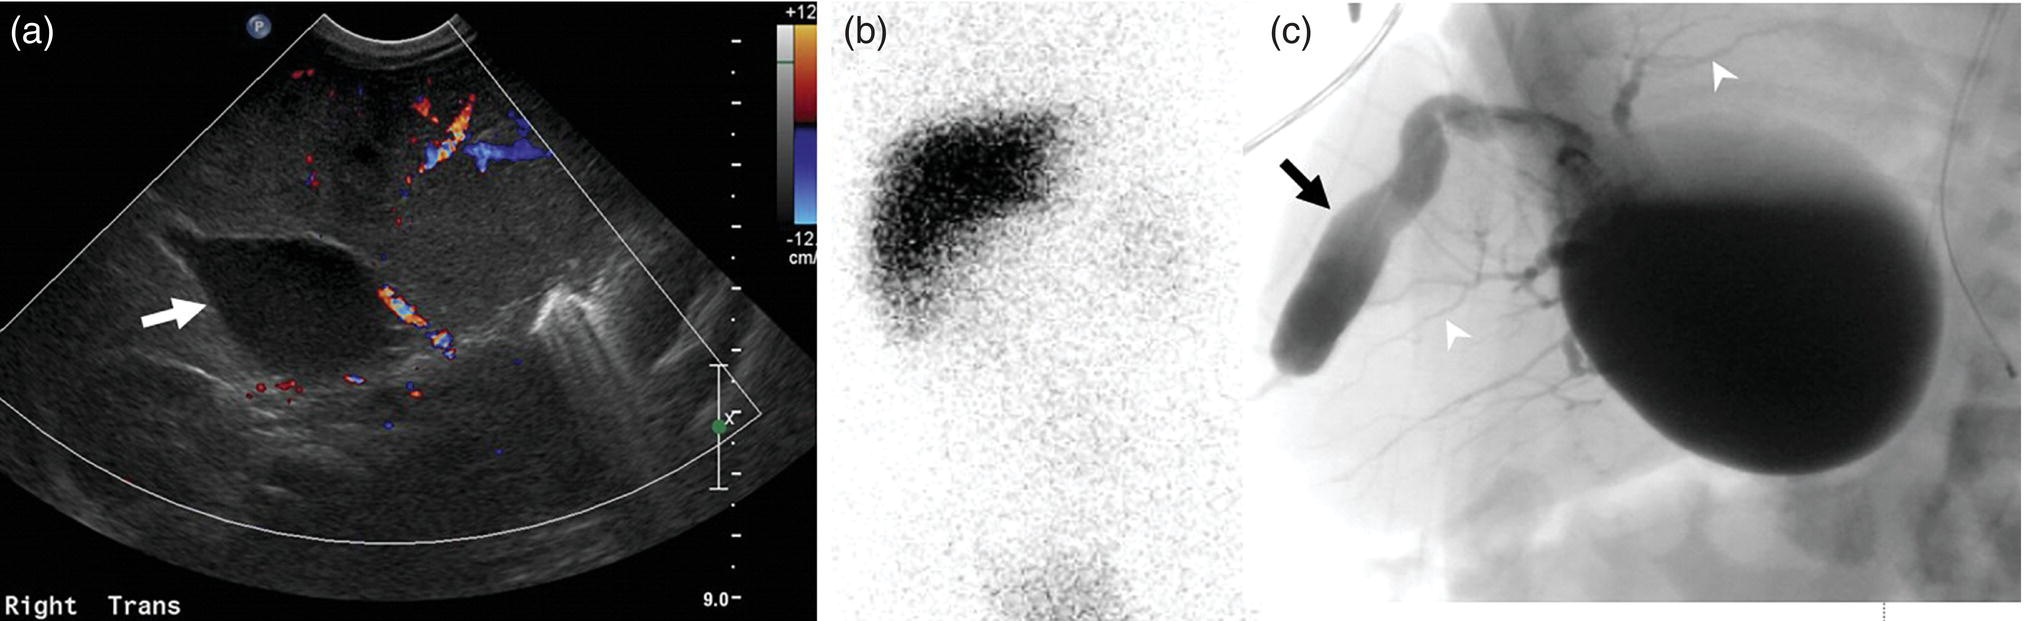
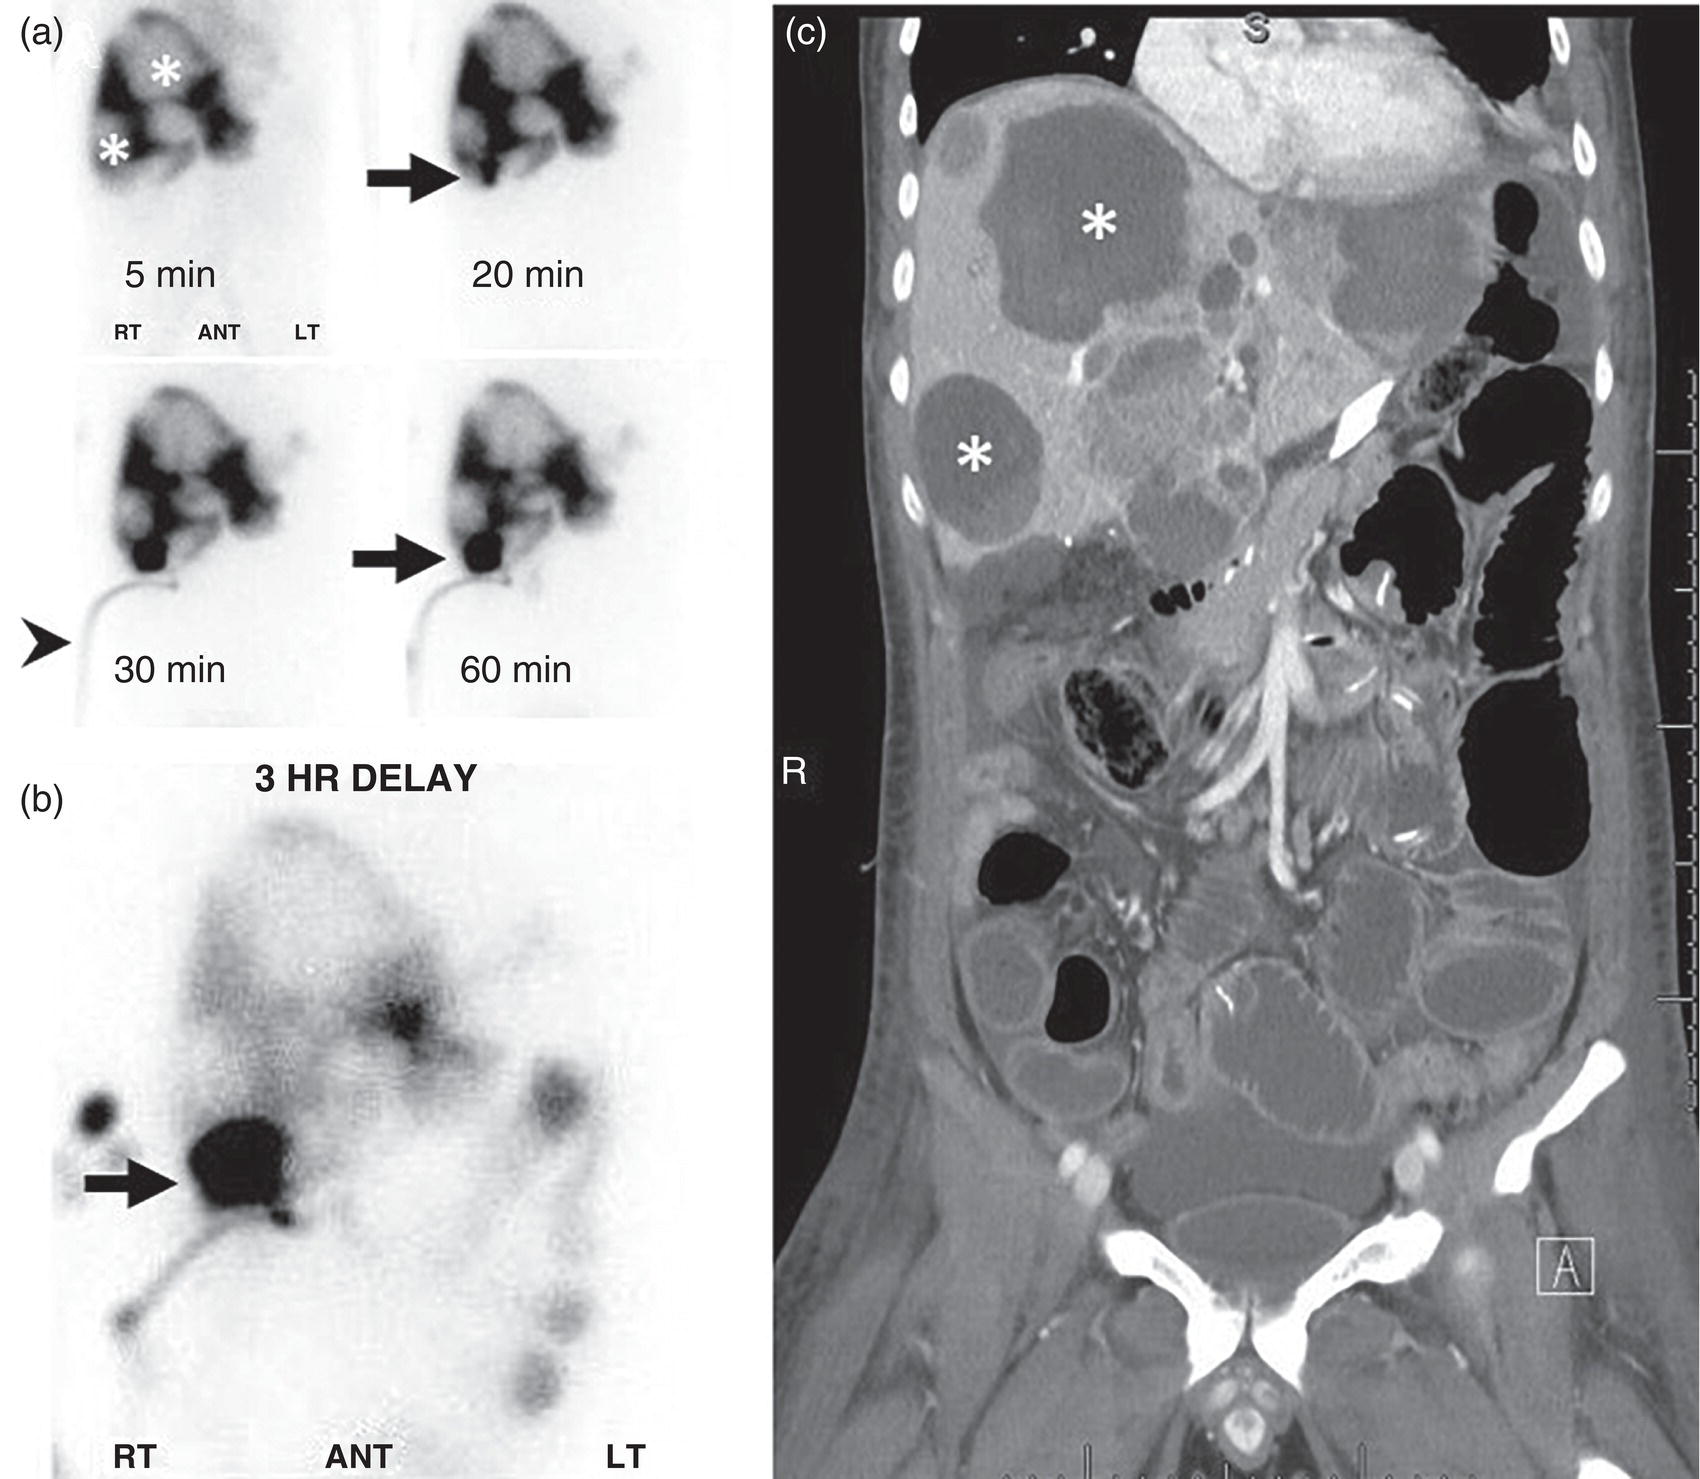
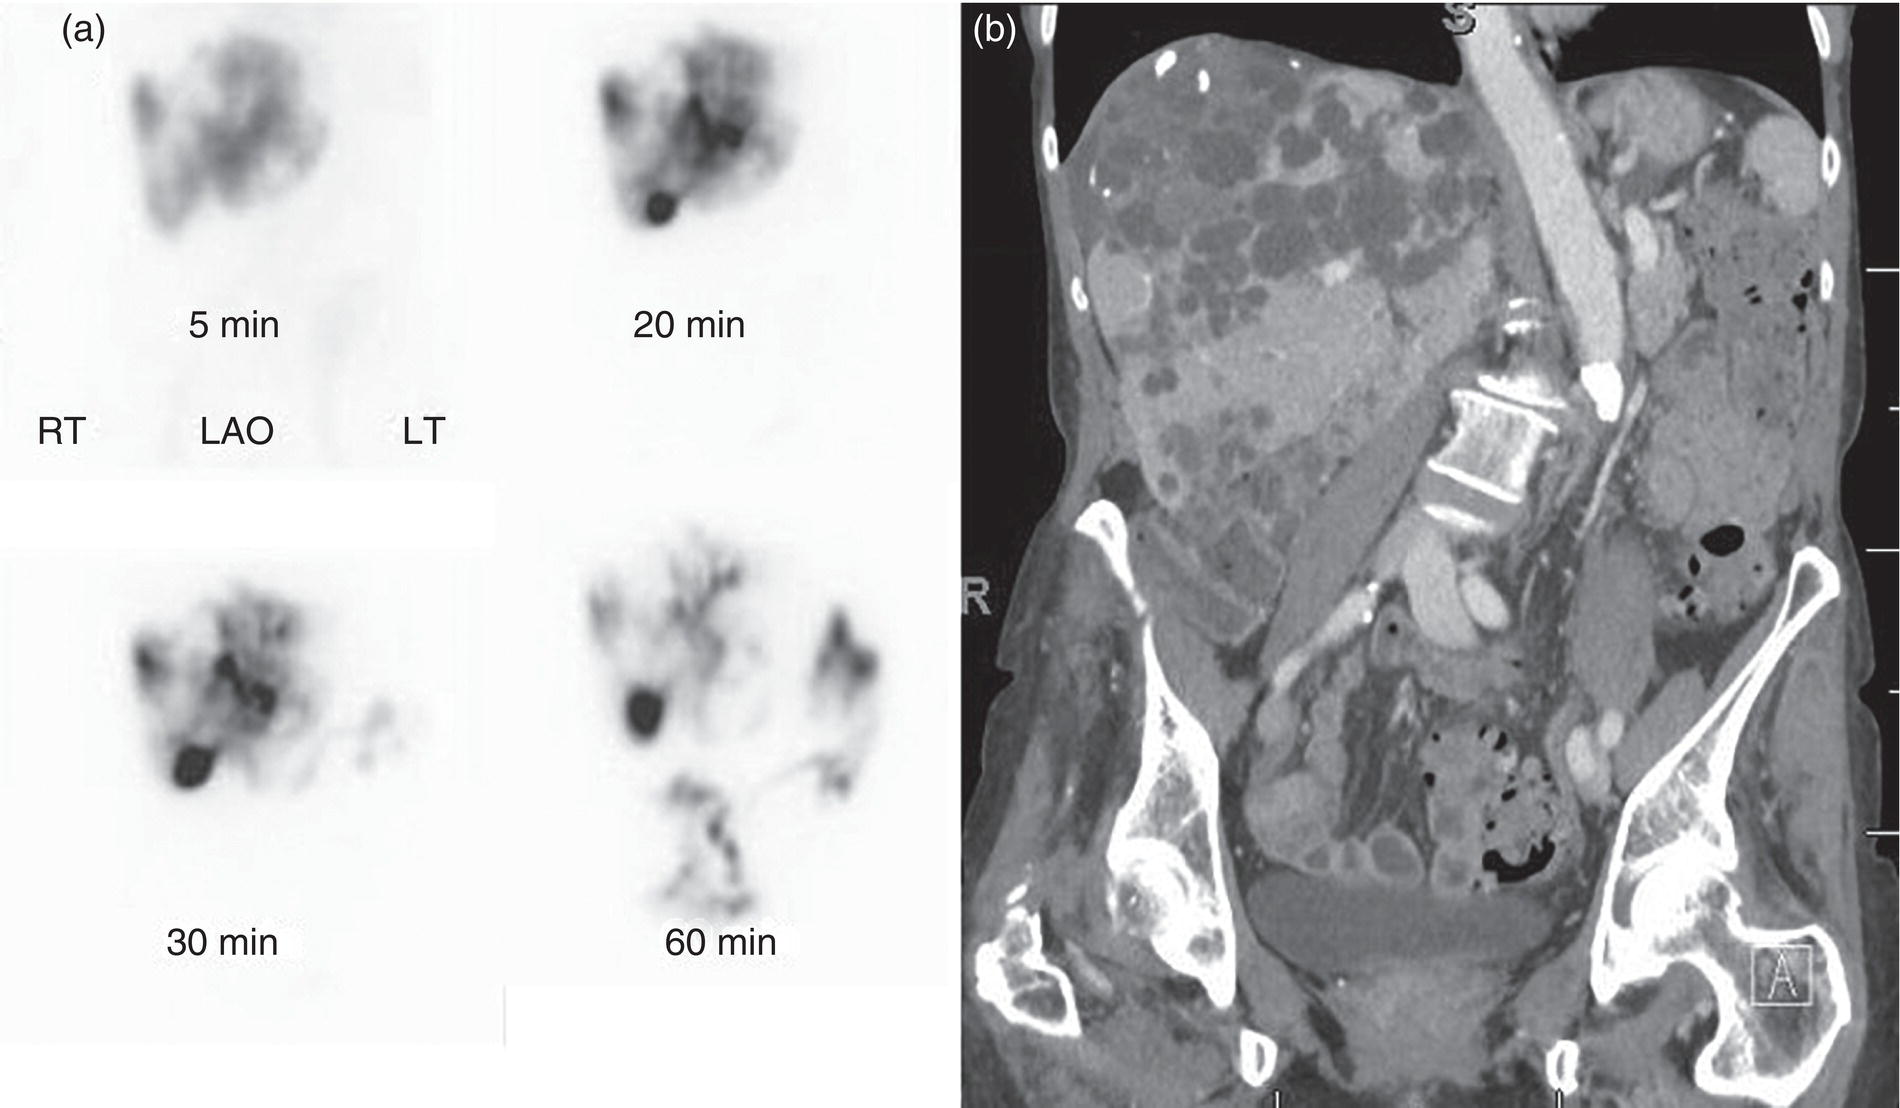
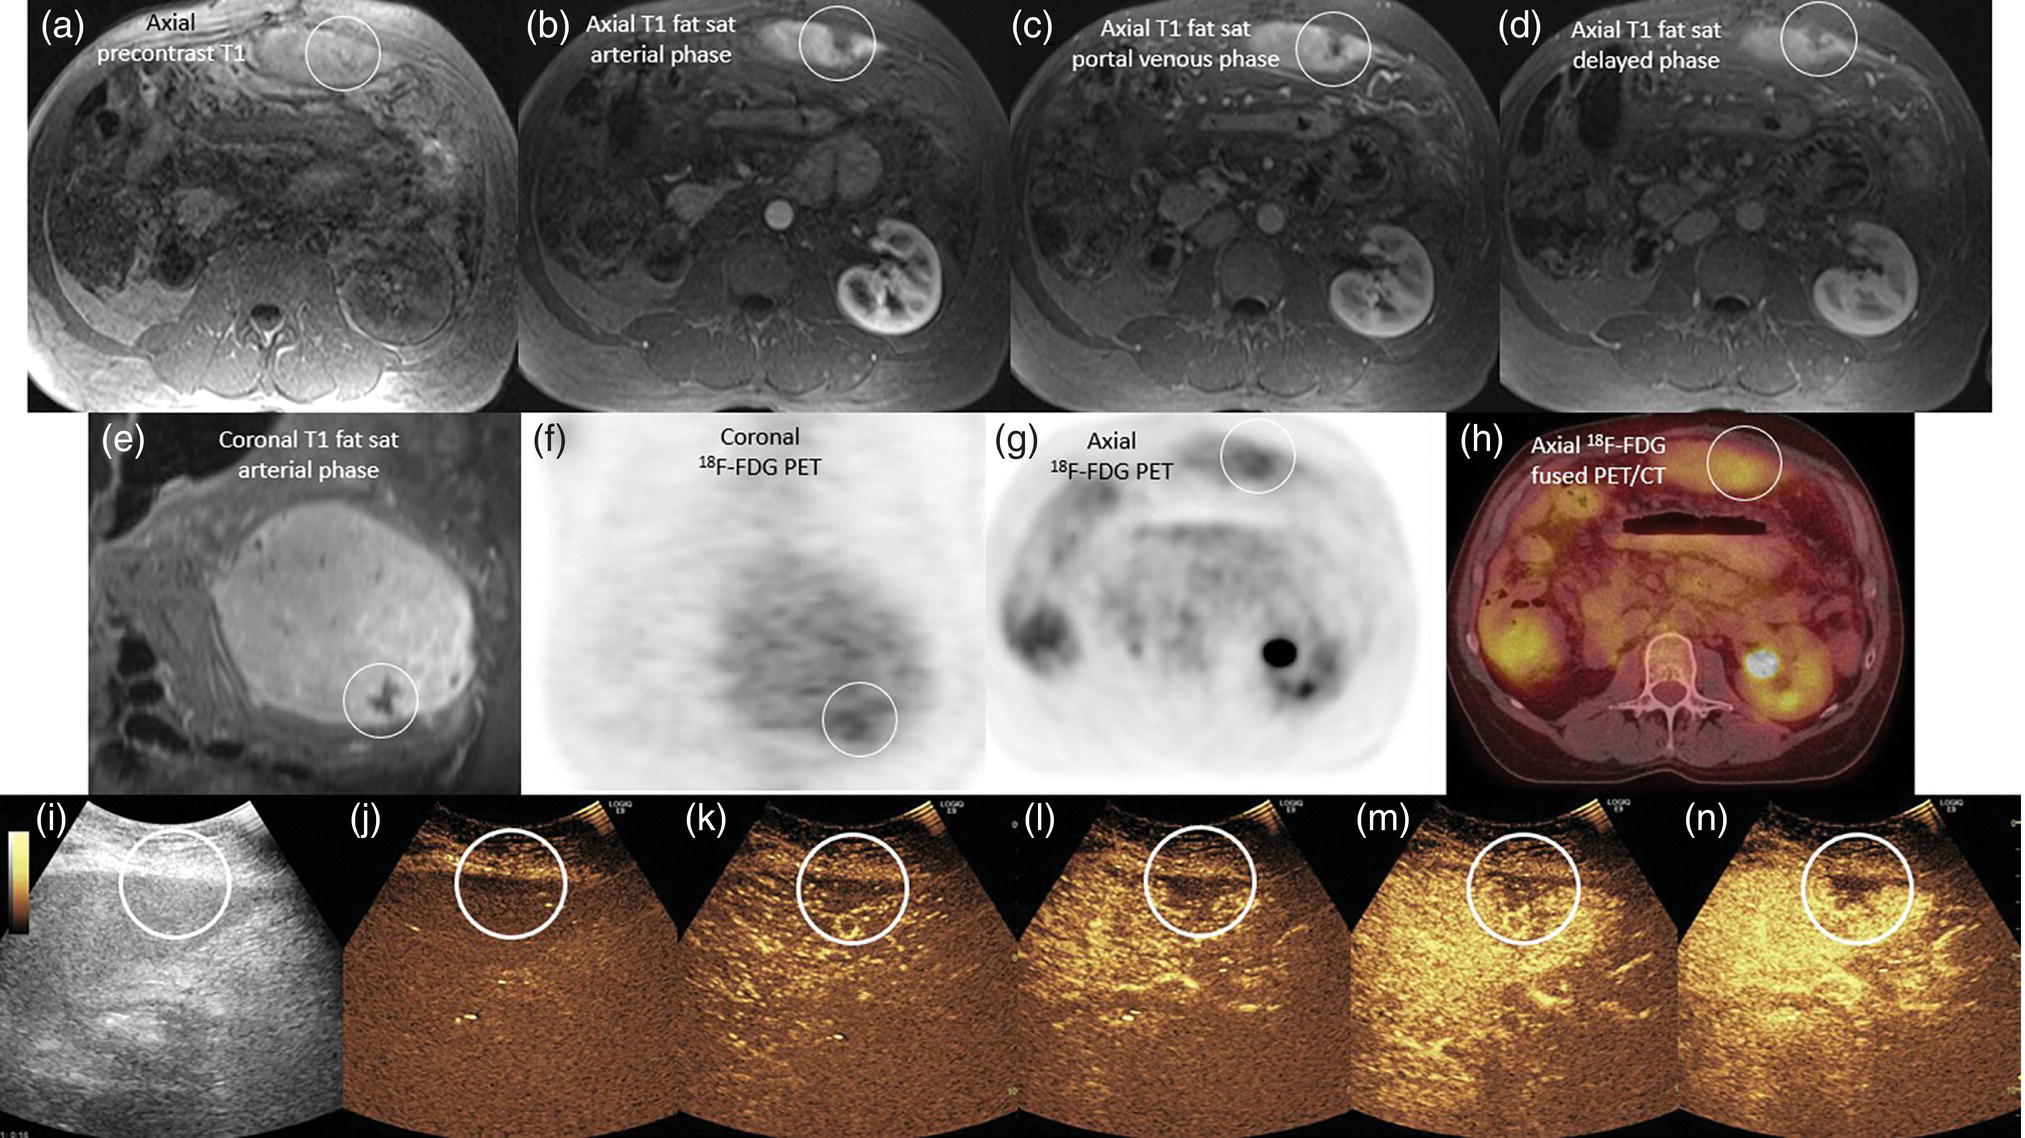
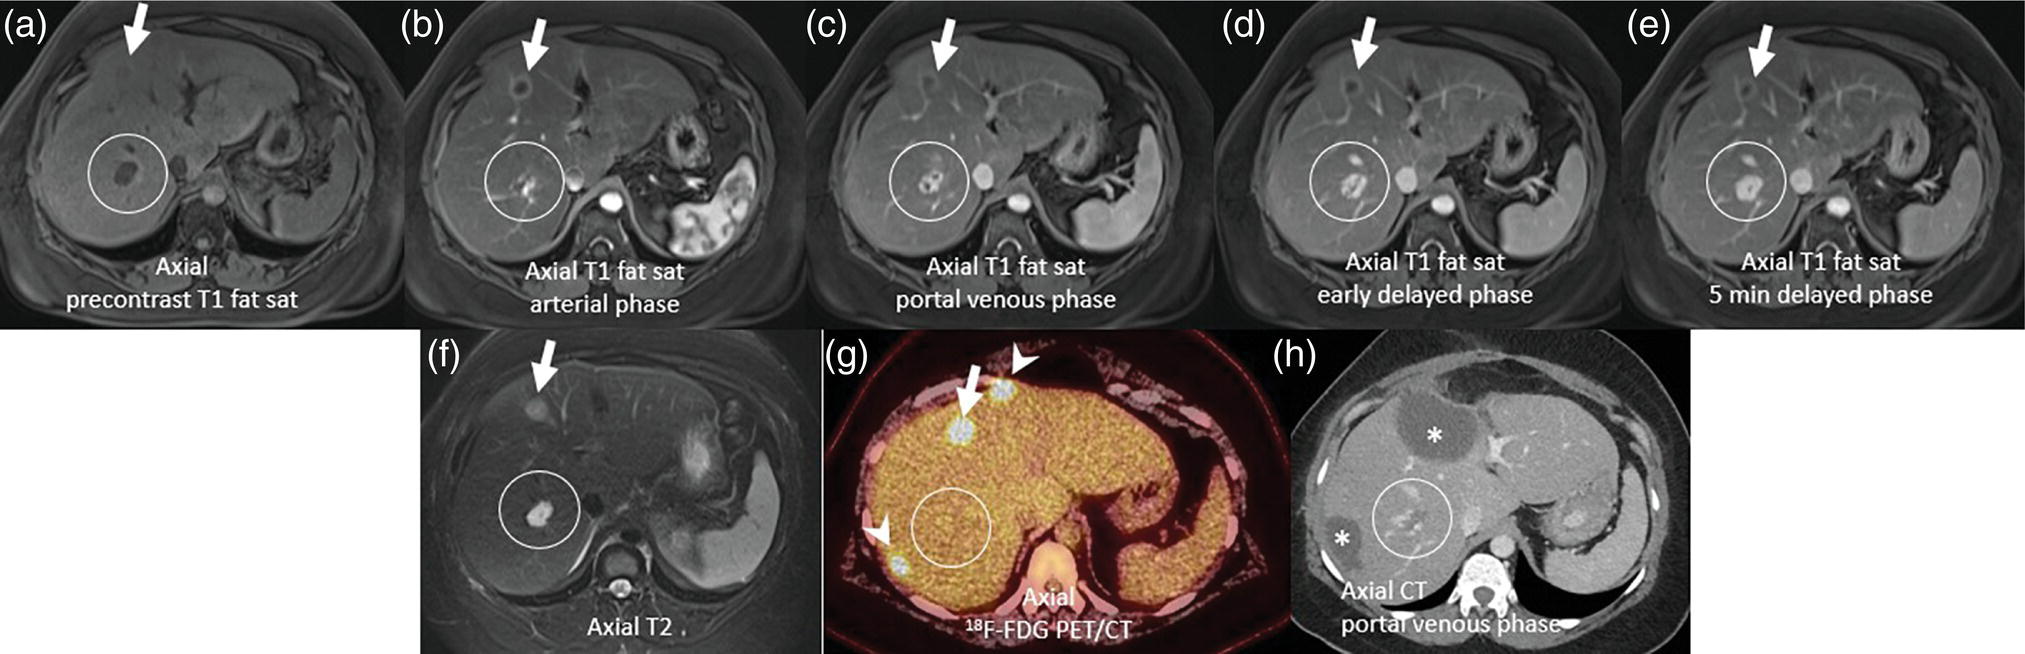
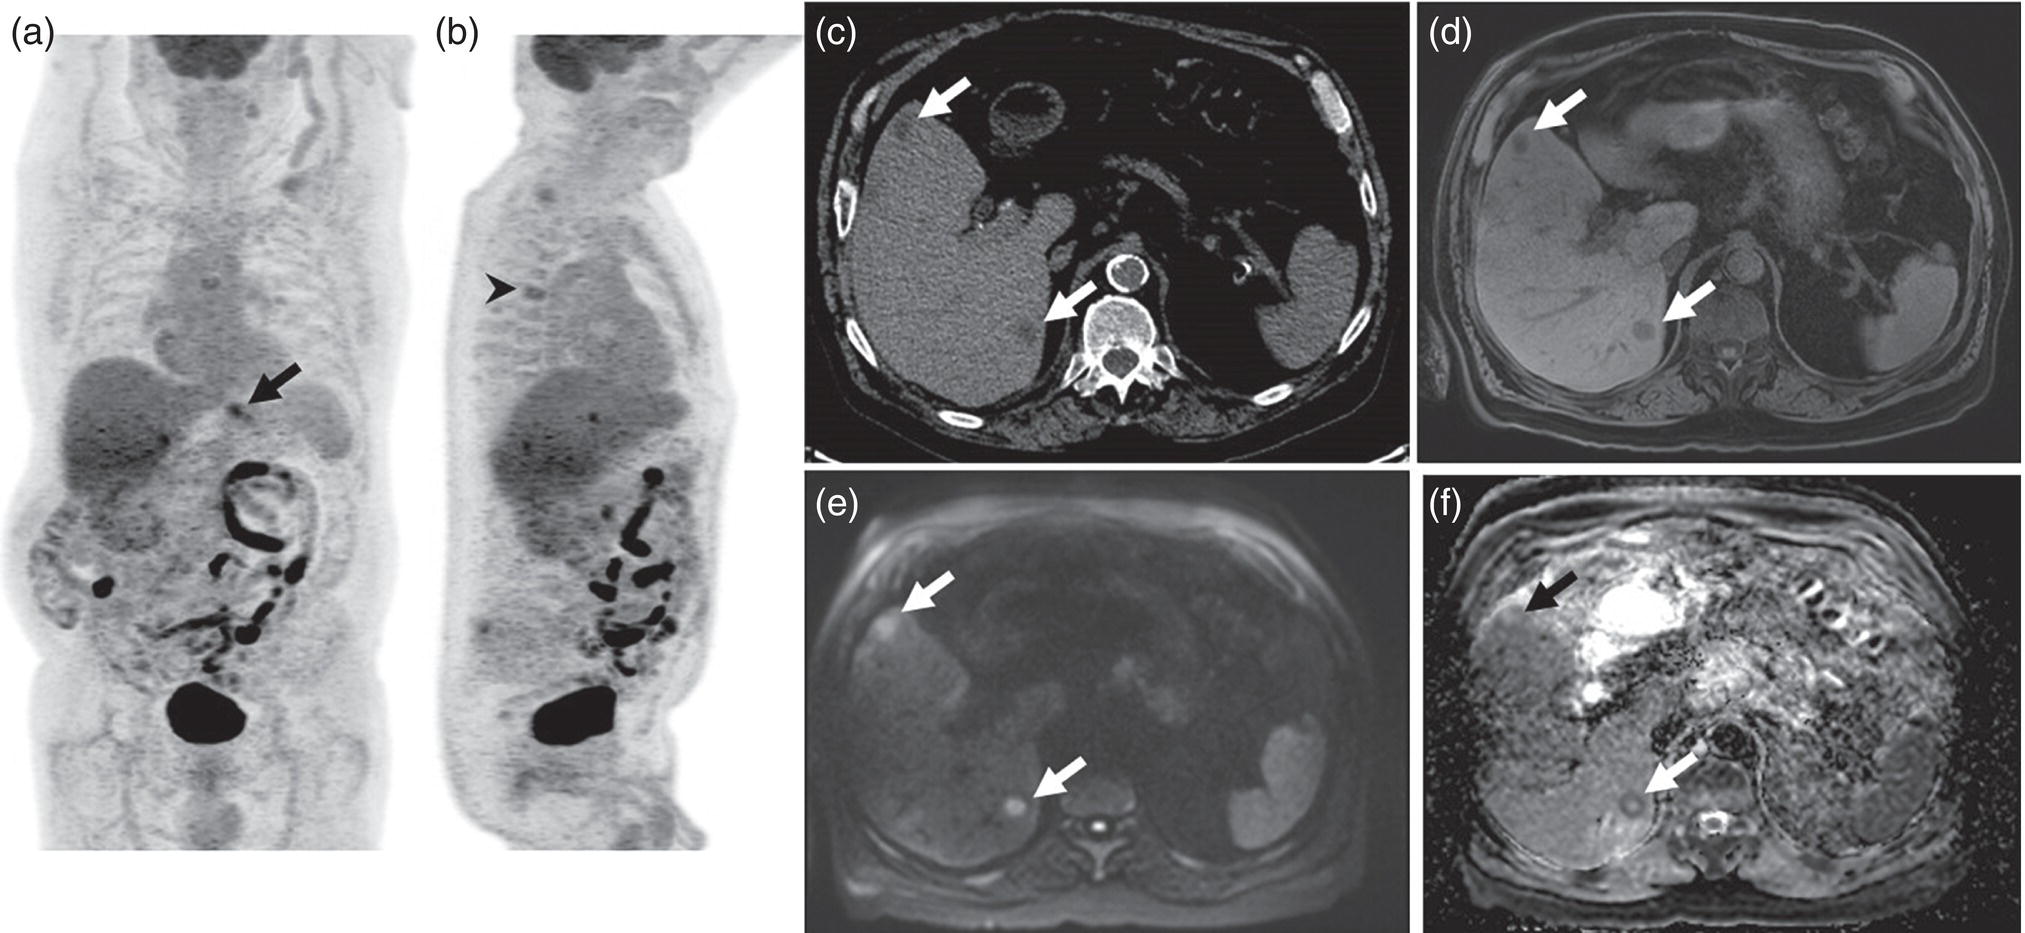
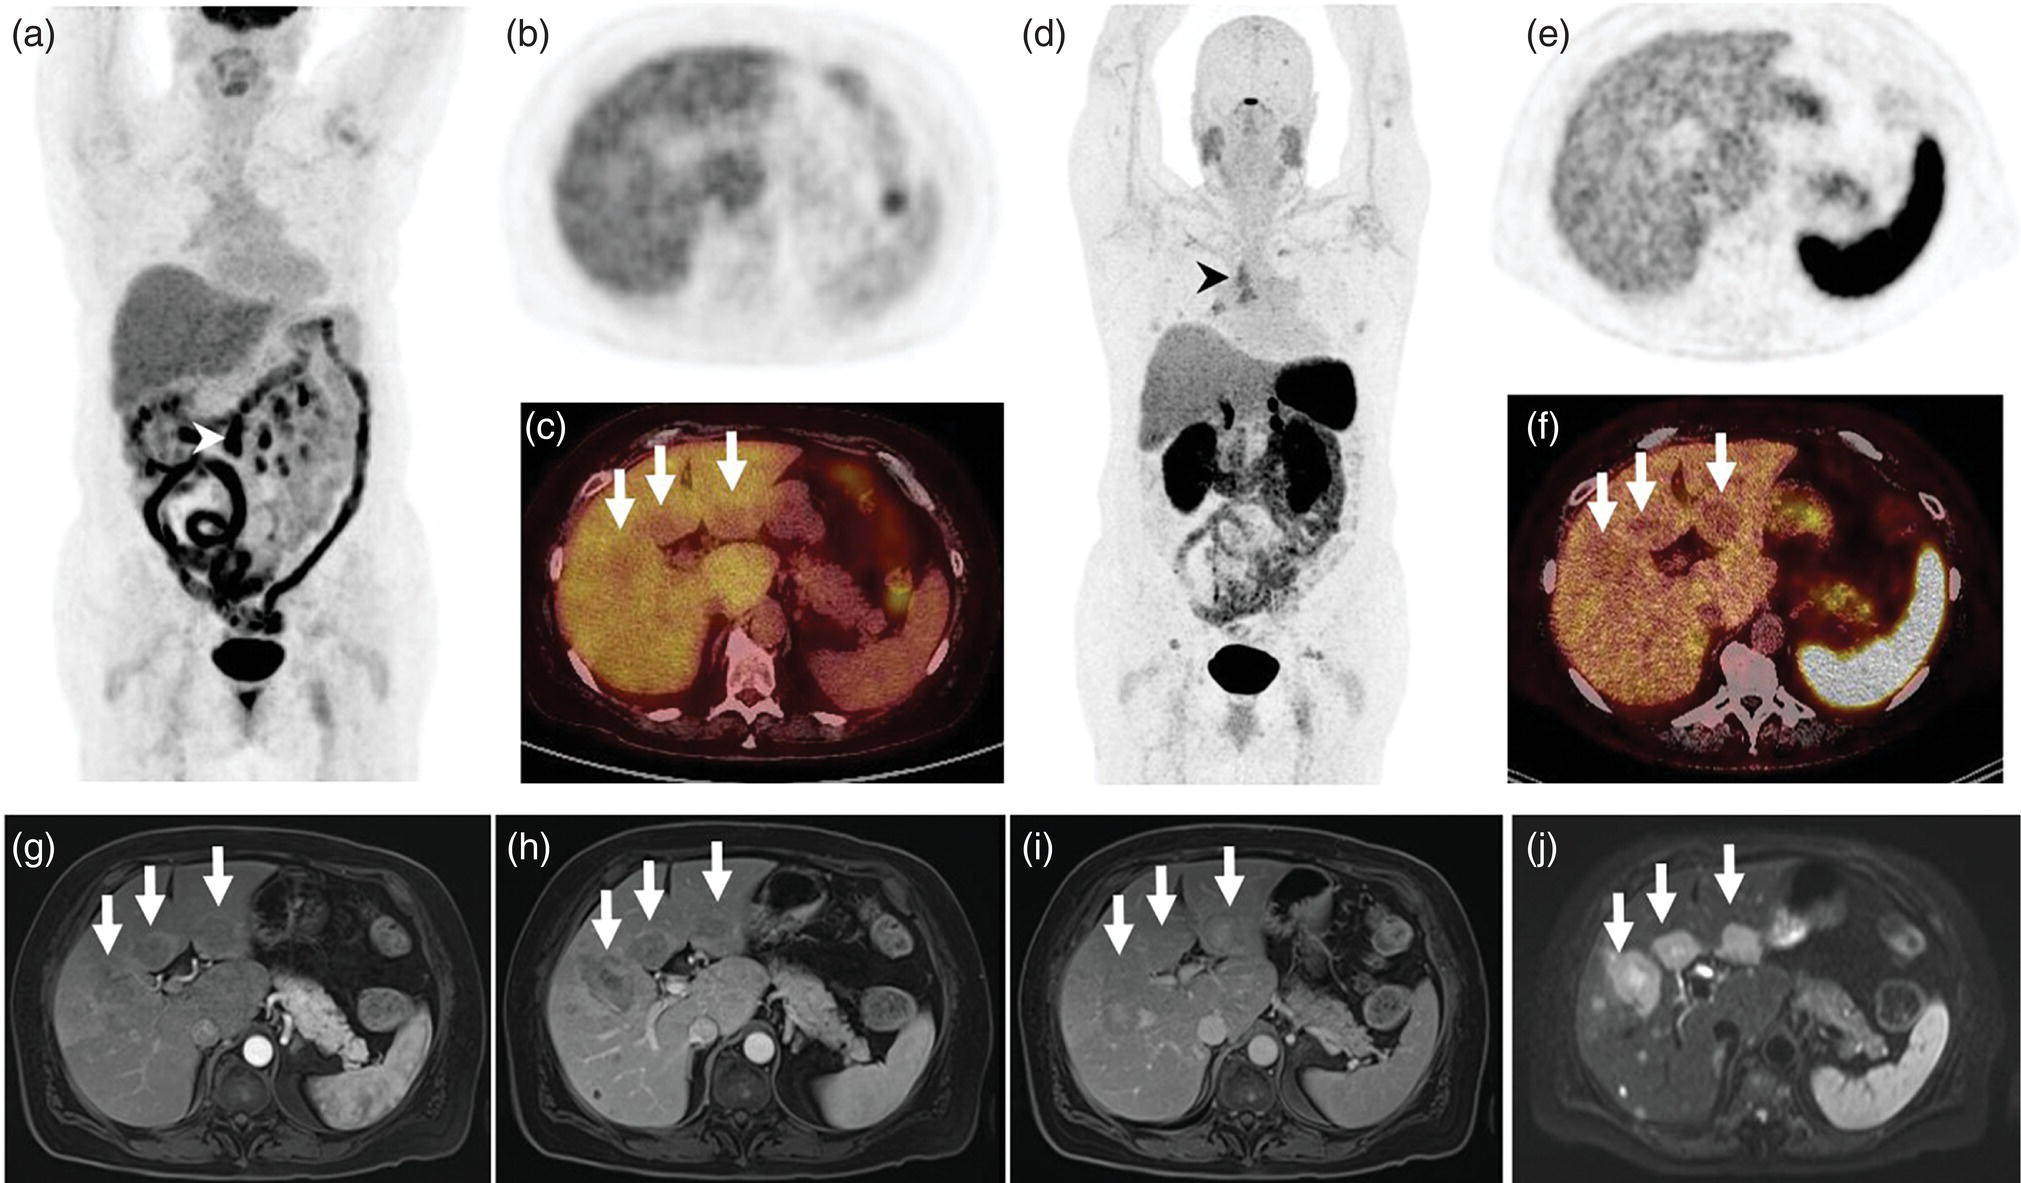
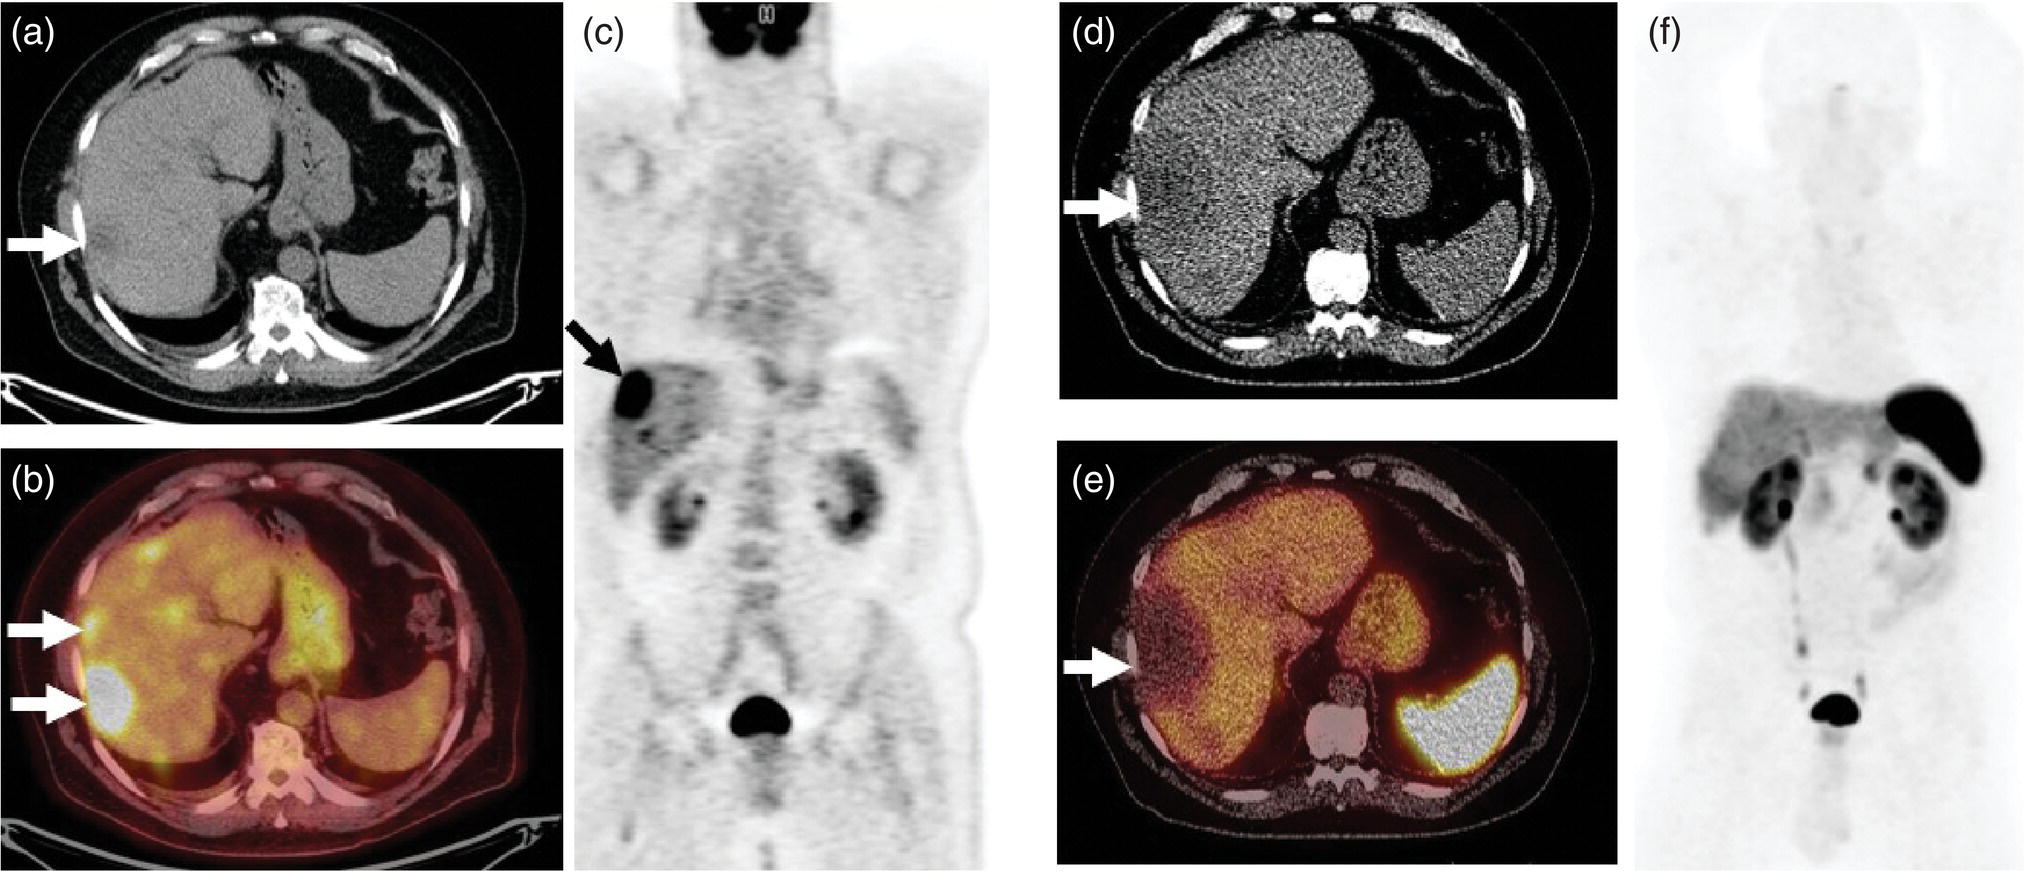
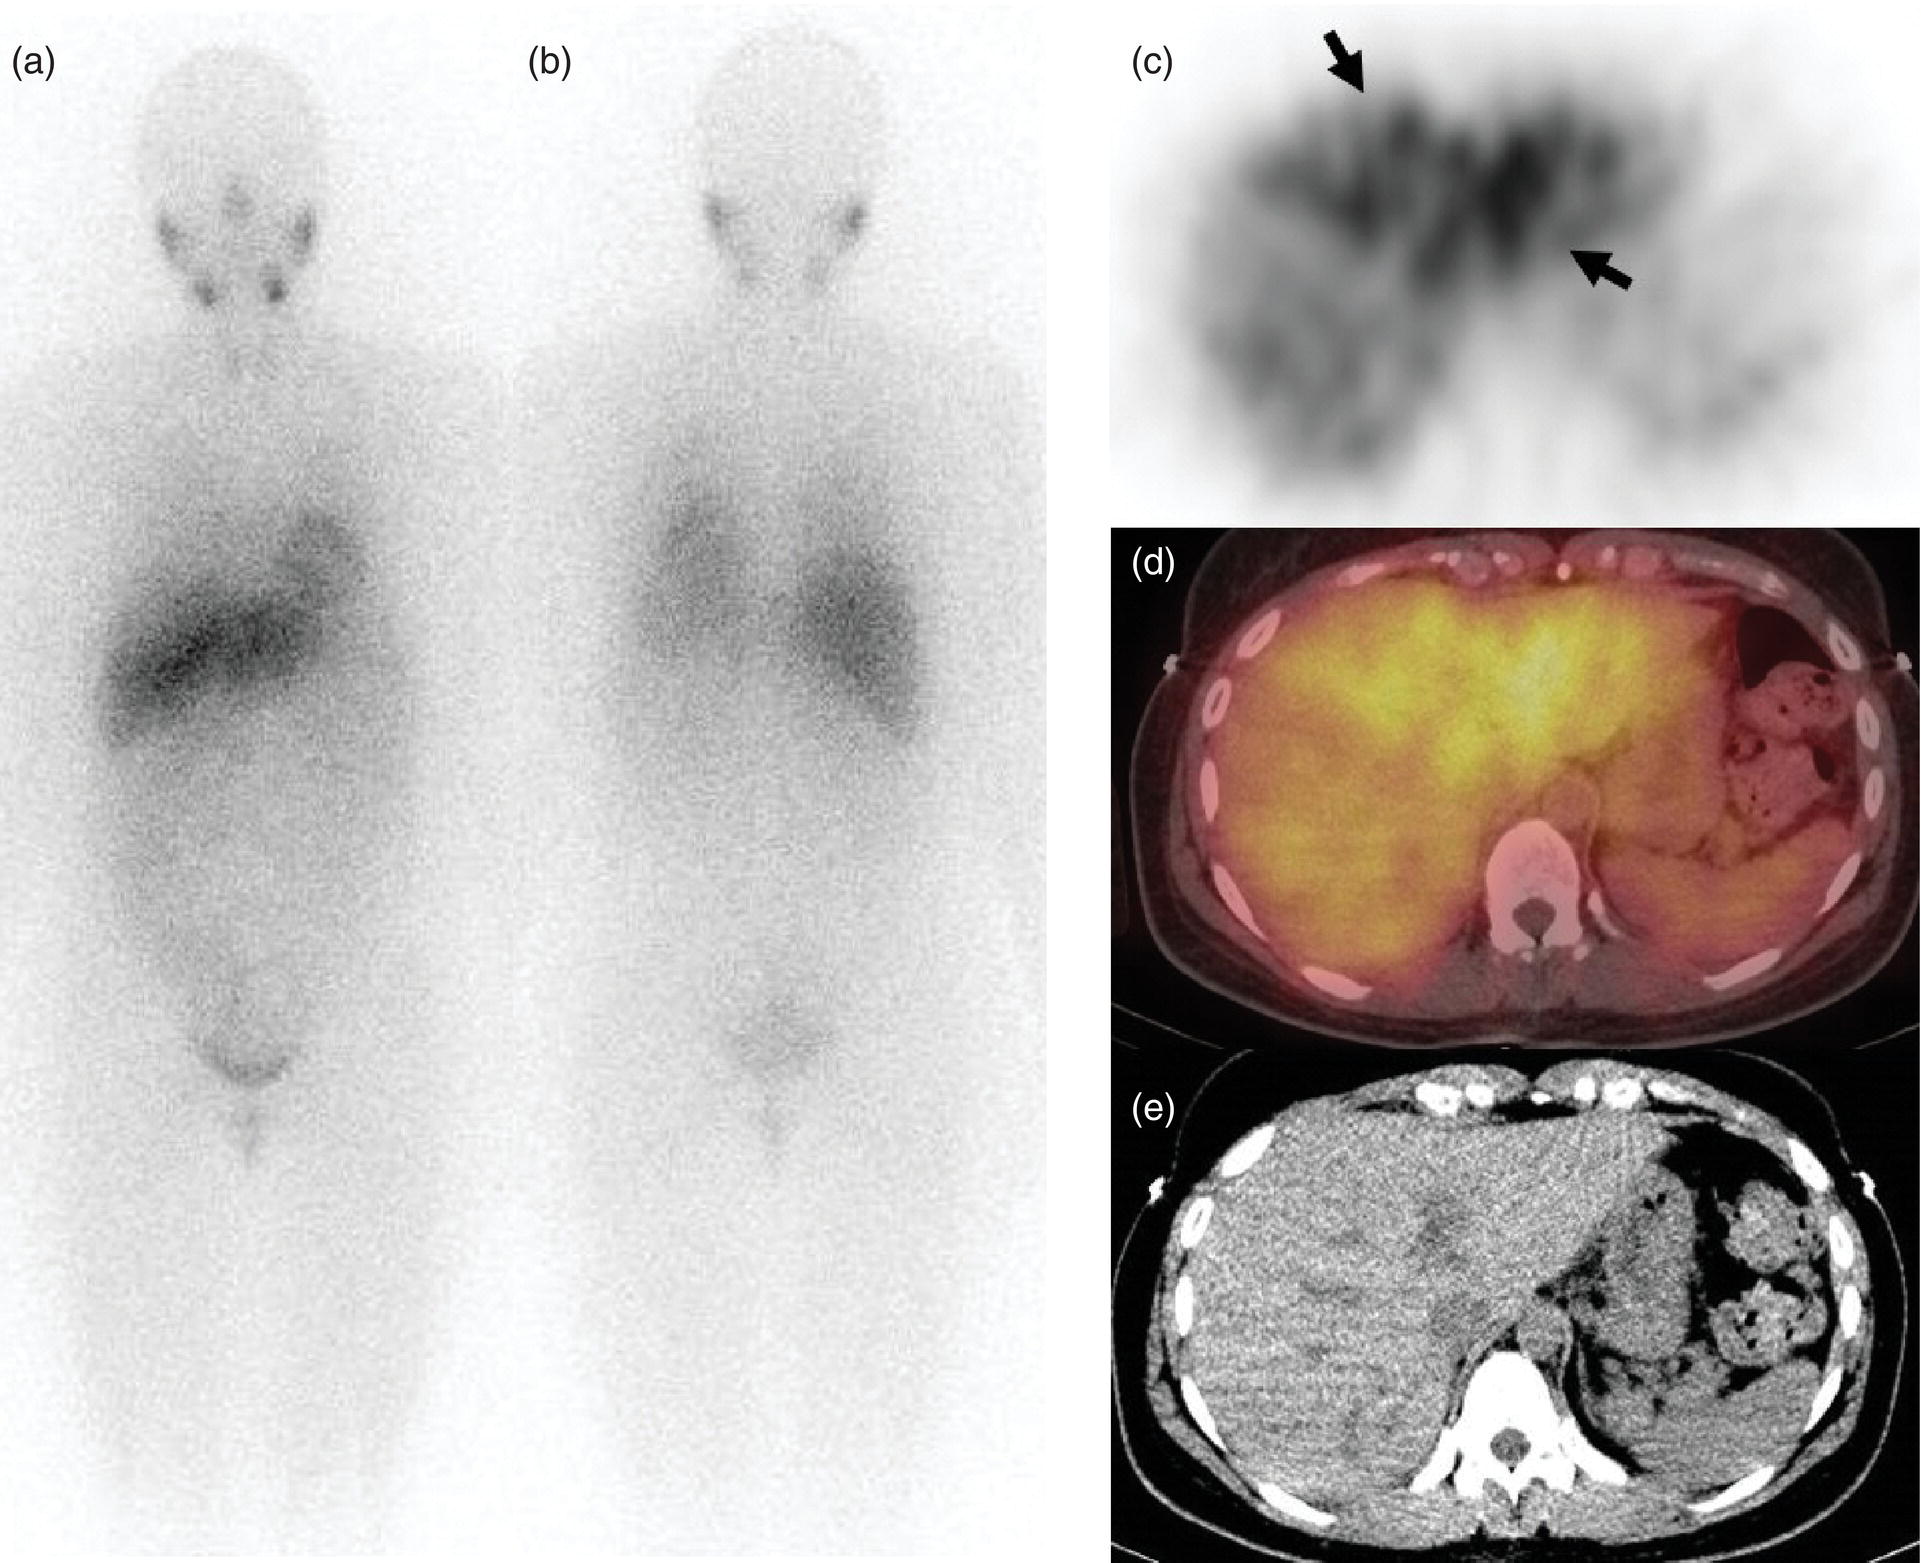
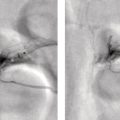
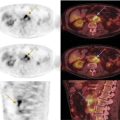
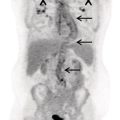
Janet H. Pollard University of Iowa Carver College of Medicine, Iowa City, IA, USA Liver pathologies are diagnosed by clinical, laboratory, and imaging data. First‐line imaging of the liver includes grayscale and Doppler ultrasound (US), contrast‐enhanced computed tomography (CT), contrast‐enhanced magnetic resonance imaging (MRI), and magnetic resonance cholangiopancreatography (MRCP). Nuclear imaging of the liver and biliary system includes a variety of imaging techniques: reticuloendothelial (colloid), hepatobiliary, blood pool, metabolic, and receptor‐based approaches. These studies offer specialized testing in specific clinical situations, and in some cases have higher sensitivity, specificity, and accuracy compared to other modalities. Hepatobiliary scintigraphy assesses liver uptake and biliary drainage through the use of bile‐like radiotracers technetium‐99m (99mTc)‐bromo‐2,4,6‐trimethylacetanilido iminodiacetic acid (99mTc‐mebrofenin) or 99mTc‐2,6‐diisopropylacetanilido iminodiacetic acid (99mTc‐disofenin). The use of iminodiacetic acid (IDA) radiopharmaceuticals has led to hepatic IDA or HIDA as a generic term for these studies. Standard procedure protocols are described in the literature [1]. HIDA scanning has high sensitivity and specificity for acute cholecystitis. Other common indications are evaluation of gallbladder ejection fraction (as an indicator of chronic cholecystitis), bile leak, and biliary atresia [1]. Uptake patterns of incidentally identified focal hepatic lesions encountered on the hepatogram can inform the differential, but other modalities such as US, CT, and MRI are required for further workup. Colloid scintigraphy (liver‐spleen scans) allows visualization of the liver parenchyma through accumulation of colloid‐based radiotracers in reticuloendothelial cells and was widely used in the past to detect focal liver lesions [2]. Focal parenchymal defects are nonspecific, indicating the presence of space‐occupying processes. Today colloid imaging remains useful for confirmation of splenosis and extramedullary hematopoiesis, but has otherwise been superseded by US, CT, and MRI for detection and evaluation of liver lesions. Molecular imaging with whole‐body positron emission tomography (PET)/CT or PET/MRI utilizes metabolic and receptor‐based strategies for tumor detection in staging and restaging various cancers. The liver is a frequently involved organ in metastatic disease. Fluorine‐18 (18F)‐fluorodeoxy glucose (FDG) imaging takes advantage of elevated glucose metabolism in malignancies, a phenomenon known as the Warburg effect. Gallium‐68 (68Ga)‐1,4,7,10‐tetraazacyclo‐dodecane‐1,4,7,10‐tetraacetic acid DOTA‐peptides highlight neuroendocrine tumors (NETs) through binding the somatostatin receptors that are overexpressed on the surfaces of their cells. Single‐photon emission computed tomography (SPECT) imaging with iodine‐123 (123I)‐metaiodobenzylguanidine (MIBG) is another receptor‐based imaging approach targeting norepinephrine transport, useful for imaging of some types of MIBGs. Radiolabeled 99mTc‐red blood cell imaging is used for confirmation of hepatic hemangiomas when US, CT, or MRI are equivocal or there is a contraindication to intravenous contrast. Patients undergoing yttrium‐90 (90Y)‐microspheres therapy for hepatic tumors must first be evaluated with liver imaging using arterially infused 99mTc‐macroaggregated albumin (MAA) as part of the planning process for a safe and effective procedure. In this chapter a variety of hepatobiliary cases of congenital, infective, inflammatory, neoplastic, vascular, and postsurgical abnormalities will be discussed with the goal of demonstrating the utility of combination imaging with both nuclear and non‐nuclear imaging techniques. In the neonate or infant with prolonged cholestatic jaundice, imaging plays an important role in differentiating between obstructive causes such as biliary atresia versus hepatocellular causes. Biliary atresia is a condition in which the intra‐ and extrahepatic biliary ducts fibrose, resulting in liver cirrhosis and death in the first year of life [3, 4]. Early diagnosis of biliary atresia and surgical intervention is imperative for optimal outcome. In assessing for biliary atresia, no single modality is perfectly accurate, so a combination of tests aids in early diagnosis. These modalities include US, HIDA scanning, MRCP, intraoperative cholangiography, and liver biopsy, with the latter two invasive tests considered the gold standard. Less invasive techniques are preferred for initial workup. US is the modality of choice for evaluation of liver and biliary structures. Importantly, a normal US does not rule out biliary atresia. Suggestive findings are a cyst in the porta hepatis without intrahepatic ductal dilation (sensitivity 10–20%, specificity 98–99%), absent gallbladder (sensitivity 20%, specificity 98%), gallbladder abnormalities (sensitivity 79%, specificity 81%), and the triangular cord sign in which there is abnormal thickening of the tissues anterior to the portal vein caused by fibrosis of the common bile duct (sensitivity 68%, specificity 95%) [5, 6]. Visualization of dilated intrahepatic ducts confidently rules out biliary atresia, as ducts should not be visualized in biliary atresia due to obliteration by fibrosis. US can identify alternative diagnoses such as biliary stones or choledochal cysts. Phenobarbital‐enhanced HIDA scanning shows high sensitivity for detecting cholestatic obstruction, including biliary atresia. The phenobarbital pretreatment (5 mg/kg/day by mouth with two divided doses daily for 3–5 days) enhances bilirubin conjugation and improves the hepatic transport system, ensuring the best excretion of hepatobiliary radiopharmaceuticals and the best chance of visualizing the biliary tree [7]. Although highly sensitive, the specificity of this modality is limited, reported between 37% and 97% [1, 7–9]. Other disorders can result in nonvisualization of the biliary tree on the HIDA scan, such as severe nonobstructive or obstructive cholestatic jaundice and mechanical obstruction [8]. Figure 15.1 demonstrates a case of patent biliary system which could not be visualized with a HIDA scan, but was well delineated on intraoperative cholangiogram, ruling out biliary atresia. Choledochal cysts are another congenital biliary disorder consisting of abnormal dilation of the bile duct or ducts. HIDA scanning can demonstrate a connection to the biliary tract when there is accumulation of radiotracer in the cyst, however, biliary excretion may not be visible [10, 11]. Figure 15.2 is an example of type 1 choledochal cyst with nonvisualization of the biliary system due to mechanical obstruction from the large size of the cyst. Full workup for underlying biliary atresia is needed as there is a cystic variant of biliary atresia that can be confused with type 1 choledochal cyst (the most common subtype of choledochal cysts) [10]. Due to the risk for pancreatitis, cholangitis, sepsis, and malignancy, surgical resection and reconstruction with hepaticojejunostomy are required [10]. Figure 15.1 False‐positive HIDA scan: neonatal hepatitis. 2‐month‐old male with history of direct hyperbilirubinemia. Hepatobiliary scan could not exclude biliary atresia, but intraoperative cholangiogram demonstrated a normal biliary tree. Hepatic biopsies revealed neonatal giant cell hepatitis. (a, b) Phenobarbital‐enhanced HIDA scan shows no biliary or bowel activity. Persistent hepatogram (asterisk), bladder activity (arrowhead), and urine activity in the diaper (arrow) at 4 and 20 hours are shown. (c) Intraoperative cholangiogram shows collapsed gallbladder (white arrow) and normal intra‐ and extrahepatic ducts (arrowheads) with drainage to the bowel (black arrow). Figure 15.2 False‐positive HIDA scan: choledochal cyst. 12‐day‐old male infant presented with a large cyst discovered antenatally in the hepatic hilum. Ultrasound suggested type 1 choledochal cyst, but HIDA scan showed no biliary activity, so biliary atresia could not be ruled out. Intraoperative cholangiogram demonstrated patent biliary system and type I choledochal cyst. Choledochal cyst excision and roux‐en‐y hepaticojejunostomy were performed. (a) Ultrasound shows cystic dilation of the common bile duct with tapering at the upper end of the duct (arrow). The cyst could be demonstrated to connect with the cystic duct and gallbladder (not shown). (b) HIDA scan shows no biliary excretion up to 24 hours post injection. (c) Intrahepatic cholangiogram shows cystic enlargement of the common bile duct with communication to a normal gallbladder (arrow) and intrahepatic biliary tree (arrowheads). US, CT, and MRI are currently the primary liver imaging modalities. Molecular imaging provides whole‐body imaging tools for detection, staging, and restaging various malignancies. Historically, liver scintigraphy with 99mTc‐sulfur colloid (the “liver‐spleen” scan) was used to evaluate the liver with a parenchymal defect being nonspecific (with large differential of cyst, abscess, hematoma, adenoma, hemangioma, and primary or secondary malignancy) and focal increased activity representing a smaller differential (focal nodular hyperplasia [FNH], regenerative nodule, Budd‐Chiari syndrome [caudate lobe], and superior vena cava obstruction [“hot” quadrate sign] [2, 12]). Space‐occupying lesions may be noted incidentally on 99mTc‐HIDA scans performed for other reasons. Figures 15.3 and 15.4 show cases in which liver metastases, surgical defects, or cysts cause abnormal distribution of radiotracer on the hepatic phase of the HIDA scan, which can be clarified on other imaging modalities. Uptake indicates the presence of functional hepatocytes, excluding lesions of nonhepatic origin; prolonged retention of radiotracer in the lesion indicates nondevelopment of biliary radicles, suggesting hepatic adenoma or hepatocellular carcinoma (HCC), although FNH has also been reported to have delayed retention [13]. Metastatic tumors are the most common malignancy in the liver, except in the cirrhotic liver, where HCC is more common [14]. After lymphatics, the liver is the most commonly affected organ by metastatic disease among solid tumors [15, 16]. In a case study of over 23 000 patients undergoing liver biopsy for metastasis, the most common histologic origin of liver metastases was carcinoma (92%), followed by melanoma (2%), sarcoma (1%), and undefined histology (4%). Of carcinomas, adenocarcinoma (75%) was the most common, followed by small cell (6%), neuroendocrine (5%), large cell (4%), and squamous cell carcinomas (1%) [17]. Hepatic metastases from adenocarcinoma most often arise in the gastrointestinal tract, frequently from colorectal primary malignancy [17] Colon cancer is the third most common primary malignancy worldwide, with metastatic disease occurring in up to half of patients [18]. After colorectal cancer, gastric, pancreatic, breast, lung, and NETs are the most common to metastasize to the liver. Although less frequent, other tumors that may give rise to liver metastases are periampullary, renal cell, thyroid, sarcoma, and gastrointestinal stromal tumor (GIST). Of special note, choroidal melanoma (also known as ocular or uveal melanoma) produces liver metastases in 95% of patients and often is the first site of metastasis [19, 20]. Figure 15.3 HIDA with space‐occupying lesions: NET and treatment‐related changes with bile leak. 35‐year‐old male with history of metastatic NET (gastrinoma) status post resection and ablation of liver tumors, now with concern for bile leak. (a) Hepatobiliary dynamic scintigraphy shows heterogenous liver parenchyma and progressive radiotracer accumulation in the gallbladder fossa or subhepatic region (arrows) and subsequently a percutaneous drain (arrowhead). Photopenic defects (asterisks) correspond to surgical defects better defined by CT. (b) 3‐hour delay shows further accumulation of radiotracer in the gallbladder fossa (arrow) and percutaneous drain, and some passage of radiotracer to the bowel. Also noted is persistent parenchymal activity suggesting cholestatic retention. (c) Coronal contrast CT of the abdomen and pelvis showing numerous treatment‐related hypodense defects in the liver (asterisks) corresponding to the photopenic areas on the scintigraphy study and a fluid collection (not gallbladder) in the gallbladder fossa (arrow). The imaging appearance of liver metastases depends on the origin and histology of the primary tumor. Contrast enhancement patterns of metastatic lesions are based on lesion vascularity and show similar characterization on US, CT, and MRI. Adenocarcinoma is typically hypovascular, whereas neuroendocrine (NETs), thyroid cancer, renal cell carcinoma, breast carcinoma, sarcoma, and melanoma tend to be hypervascular [20]. All metastases regardless of hypo‐ or hypervascularity are supplied predominantly by arterial rather than portal blood [21]. Hypovascular tumors show central hypovascularity and sometimes a peripheral hypervascular rim, resulting in a lesion that appears dark centrally surrounded by a bright rim on the various contrast‐enhanced imaging modalities [20]. On grayscale noncontrast‐enhanced US there is a wide range of sonographic patterns for liver metastases, including hypo‐, iso‐, and hyperechoic patterns [20]. Presence of a hypoechoic halo surrounding a hyperechoic lesion is highly suggestive of metastasis, although this has also been described in mycotic abscess, lymphomatosis, and HCC [20, 22]. Use of contrast‐enhanced US (CEUS) improves sensitivity and specificity for detection of liver metastases, which is reported on a par with contrast‐enhanced CT in some studies [21, 23]. However, CEUS is limited by the same factors that affect US in general, such as dependence on operator experience and patient characteristics (e.g. abdominal adiposity, high‐lying diaphragm, excessive intestinal gas, and intestinal interposition). Another consideration with CEUS is its small field of view for dynamic contrast imaging in which the early phases of contrast enhancement can only be assessed in one or a few lesions at a time [20]. However, as these contrast agents have an excellent safety profile, short‐interval repeat injections can be performed as needed to achieve adequate evaluations of all regions of the liver [21]. Figure 15.4 HIDA with space‐occupying lesions: polycystic kidney disease. 74‐year‐old female with history of polycystic kidney disease and kidney transplant under evaluation for chronic cholecystitis. (a) Hepatobiliary dynamic scintigraphy shows heterogenous liver parenchyma and normal filling gallbladder. (b) Coronal contrast CT of the abdomen and pelvis showing numerous cysts corresponding to the photopenic areas on the scintigraphy study. The CEUS enhancement patterns for hypo‐ and hypervascular liver metastases are variable but tend to show transient arterial enhancement often with peripheral distribution [21]. Unlike CT and MRI contrast agents, CEUS agents persist in the intravascular space of the normal liver parenchyma rather than passing into the extravascular or interstitial space of liver tissue and tumors. This results in persistent visualization of normal liver parenchyma on late‐phase CEUS with liver parenchyma showing as hyperechoic, whereas all metastatic lesions show as hypoechoic defects (Figure 15.5) [21]. When assessing a liver lesion, CEUS allows continuous visualization of enhancement characteristics over time through the arterial, portal, and late phases of contrast enhancement [21]. CEUS therefore has a longer window of time, 5 minutes typically, in which the liver parenchyma can be surveyed for the presence of lesions [21]. On contrast‐enhanced CT hypovascular lesions tend to appear hypodense relative to background normal liver parenchyma. Sometimes hypovascular lesions have a hypervascular hyperdense rim due to contrast enhancement [20]. Hypervascular tumors tend to appear hyperdense relative to background parenchyma on the arterial phase with washout to iso‐ or hypodensity on portal venous or later phases [20]. In the case of hypervascular metastasis with washout to isodensity relative to liver, the lesions may be missed if only portal‐venous or venous phase imaging is obtained because the lesions may be indistinguishable from normal background liver. Arterial phase imaging is therefore important when assessing for hypervascular metastases [20]. On unenhanced MRI metastases appear hypointense on T1‐weighted imaging, moderately hyperintense on T2‐weighted imaging, and show restricted diffusion on diffusion‐weighted imaging [24]. MRI contrast material is divided into two groups: (i) conventional contrast agents (e.g. gadobutrol, Gd‐BT‐DO3A, or Gadavist™) and (ii) combined or liver‐specific contrast agents (e.g. gadoxetic acid disodium, Gd‐EOB‐DTPA, or Eovist™). The conventional agents distribute between the intravascular and extravascular‐extracellular compartments. The combined or liver‐specific agents distribute between the intravascular, extravascular‐extracellular, intracellular–hepatocyte, and biliary ductal compartments [24]. On contrast‐enhanced MRI with conventional contrast agents, the enhancement pattern in metastatic liver lesions is similar to CT. When a liver‐specific contrast agent is used a delayed “hepatocyte phase” shows liver metastases to have no uptake because they lack hepatocytes [24]. Figure 15.5 Discordant MRI and 18F‐FDG liver lesion localized with contrast US for biopsy. 55‐year‐old male with history of colorectal cancer treated with left hemicolectomy 4 years ago followed by recurrence in the form of a large liver metastasis treated with chemotherapy and extended right hepatectomy. Now 2 years later surveillance imaging with MRI demonstrates a hypo‐enhancing liver lesion without diffusion restriction (not shown) in segment three favored to be postoperative injury or infarct. 18F‐FDG PET/CT shows mild focal uptake at the site suspicious for metastasis. Contrast US localized the lesion for biopsy which revealed metastatic adenocarcinoma. (a–d) Axial and (e) coronal MRI of the liver without and with gadobutrol contrast shows a poorly enhancing subcapsular lesion in the anterior left lobe in segment 3 (circle). (f) Coronal and (g, h) axial 18F‐FDG PET shows mild focal uptake slightly greater than background liver at the site of the lesion (circle). (i) Transverse grayscale US shows poor visibility of the lesion. (j–n) Dynamic contrast US centered on the liver lesion shows subtle rim enhancement (k) with contrast washout (l, m) showing a dark defect next to the brightly enhancing normal liver parenchyma (circle). Accurate staging is essential if liver metastasectomy is considered. This procedure is now well‐established for patients with resectable metastatic colorectal cancer limited to the liver, showing improved 5‐year survival in half of patients [19]. Liver metastasectomy remains controversial in noncolorectal malignancies except for NETs. Determining the resectability of liver metastases requires highly accurate imaging to determine the exact number of metastases, distribution, relation to main biliary and vascular structures, size and volume of metastases, and volume of residual normal liver [21, 25]. Figure 15.6 demonstrates an MRI with conventional contrast material depicting metastatic liver disease and hemangioma prior to metastasectomy. MRI detects more metastatic liver lesions than CT and 18F‐FDG PET/CT, and is an essential step when surgical resection of metastases is considered [18, 23, 26, 27]. The combination of diffusion‐weighted imaging and liver‐specific contrast media has the highest sensitivity, specificity, and accuracy for detecting liver metastases [28]. Preoperative evaluation by liver‐specific contrast MRI allows more accurate detection of liver metastases, better selection of patients for curative treatment, and has been shown to improved 5‐year survival in patients who receive preoperative imaging with this modality [23, 28, 29]. The role of 18F‐FDG PET/CT and other radiotracers in imaging of malignancies depends on the tumor type and indication. For example, 18F‐FDG PET/CT is not indicated for staging and restaging of colorectal cancer and does not supplant CT or MRI for this purpose. For colorectal cancer 18F‐FDG PET/CT is reserved for equivocal cases or when there is contraindication to intravenous contrast or when monitoring response to therapy or assessing for tumor recurrence after image‐guided liver‐directed therapy [26]. In another example 18F‐FDG PET/CT is not useful in the tumor and nodal staging of superficial esophageal carcinoma given the low pretest probability of regional and distant metastatic disease. Endoscopic US with fine‐needle aspiration is more sensitive and accurate than CT or 18F‐FDG PET/CT for locoregional evaluation [30]. 18F‐FDG PET/CT in the setting of superficial esophageal cancer can potentially cause harm due to false‐positive findings resulting in invasive procedures [31]. On the other hand, patients with more advanced esophageal cancer do benefit from 18F‐FDG PET/CT, especially when esophagectomy is considered, as detection of distant metastases prevents futile surgery [30]. Figure 15.6 MRI and 18F‐FDG PET/CT of hepatic metastases and hemangioma prior to metastasectomy. 50‐year‐old female with history of adenocarcinoma of the colon being evaluated for metastasectomy. MRI showed a hemangioma and three resectable hepatic metastases. (a–f) Axial MRI without and with gadobutrol contrast showing a hypovascular metastasis (arrow) with enhancing rim and a hemangioma (circle) with peripheral interrupted nodular enhancement (b) with progressive centripetal fill‐in (c–e) and T2 hyperintensity (f). Three metastases were present, but only one is visible on this slice. (g) Axial 18F‐FDG PET/CT shows intense uptake in the three hepatic metastases (arrow and arrowheads) and uptake similar to background liver uptake in the hemangioma as expected (circle). (h) Postsurgical CT shows the metastasectomy resection cavities (*). Another application of 18F‐FDG PET/CT is evaluation for residual or recurrent disease after local ablative therapy of liver tumors. 18F‐FDG PET/CT has high accuracy in this setting [32]. Patterns of uptake such as focal or multifocal uptake around the margin of the ablated lesions or increasing SUV or inadequate decline in SUV based on the PET Response Criteria in Solid Tumors (PERCIST), indicate residual or recurrent disease [32]. The utility of 18F‐FDG PET/CT and other radiotracers for monitoring response in various tumors and treatment modalities has been studied, but further discussion is beyond the scope of this chapter. It is important to be aware that there are some tumor types in which 18F‐FDG PET has variable or low standardized uptake values (SUVs), resulting in low sensitivity. Awareness of these pitfalls helps avoid interpretive errors (Table 15.1) [33–52]. Figure 15.7 is an example of a patient with metastatic mucinous subtype of esophageal cancer with liver metastases that are not visible on 18F‐FDG PET, but are clearly seen on CT and MRI. NET metastases to the liver commonly arise from gastro‐entero‐pancreatic origin NETs and less commonly from pulmonary NETs. NETs are divided histologically into groups based on differentiation (assessed by morphologic appearance) and grade (assessed by mitotic count and Ki‐67% proliferation index) [53]. Well‐differentiated NETs may be grade 1–3, while poorly differentiated neuroendocrine carcinomas are exclusively grade 3 [53]. NETs are hypervascular tumors, but variations abound, with some patients harboring hypovascular metastases or a combination of both hypervascular and hypovascular metastases [54]. Accurate liver imaging requires multiphase contrast modalities with arterial, venous, and delayed phases (Figure 15.8). During the arterial‐dominant phase hypervascular NET metastases tend to show heterogeneous intense enhancement and ring enhancement. On the portal venous phase perilesional enhancement is often observed [55]. Somatostatin receptor (SSTR)‐based PET imaging plays an important role in NET because of its ability to detect and stage tumors and identify candidates for peptide receptor radiotherapy (PRRT). The SSTR‐based PET agents 68Ga‐DOTA(0)‐Tyr(3)‐Thr(8)‐octreotate (DOTATATE) and 68Ga‐DOTA(0)‐Phe(1)‐Tyr(3) octreotide (DOTATOC) are taken up into NETs in proportion to cellular SSTR expression. SUVs correlate well with in vitro immunohistochemical staining of SSTR and response to PRRT [56, 57]. A qualitative five‐point scale of uptake intensity (Krenning score) is commonly used to determine eligibility for PRRT. The scale compares tumor uptake intensity to normal background liver and spleen with uptake intensity greater than liver in most sites of disease (Krenning score 3) required for PRRT [48, 58]. Table 15.1 Tumor types and features which may have low SUV on 18F‐FDG PET. NET, neuroendocrine tumor; RCC, renal cell carcinoma; SUV, standardized uptake value. Although 18F‐FDG does not play a role in the radionuclide therapy of NETs, it does offer prognostic information. The presence of 18F‐FDG uptake is a negative prognostic indicator [48]. As NET tumor grade increases, the intensity of uptake of 18F‐FDG increases, though low‐grade NETs can still show 18F‐FDG uptake [43, 48, 59]. Tumor grade is also inversely proportional to SSTR expression [57]. Even in patients with low‐grade NETs with typical positive SSTR‐based PET imaging, progression‐free survival and overall survival are lower if tumors are also 18F‐FDG PET positive [48]. The NETPET score has been developed which combines the uptake intensity on both SSTR‐based PET and 18F‐FDG PET studies and has prognostic value [60]. Figure 15.9 shows a patient with liver metastases from poorly differentiated (grade 3) NET with no 68Ga‐DOTATOC uptake, but intense 18F‐FDG uptake. Molecular imaging is not perfectly sensitive. Figure 15.8 shows a patient with liver metastases demonstrated on MRI, but with PET imaging negative with both 18F‐FDG and 68Ga‐DOTATOC. Biopsy showed high‐grade 2 NET with negative staining for SSTR2A receptors. An alternative but less sensitive imaging agent for NETs is 123I‐MIBG, which has been reported to show uptake in 50–70% of patients [61, 62]. When imaging with this agent, it is important to note a potential imaging pitfall: there is often normal differential uptake in the hepatic lobes on SPECT, with the left lobe showing more intense diffuse uptake than the right [63, 64]. Figure 15.10 shows a case of MIBG with the demonstrated differential uptake in the liver. Figure 15.7 Metastatic mucinous subtype of esophageal cancer with liver metastases that are not visible on 18F‐FDG PET, but clearly seen on CT and MRI. 74‐year‐old male with mild dysphagia and endoscopic evaluation showing 2.0 cm ulceration in the distal esophagus. Biopsy revealed adenocarcinoma, poorly differentiated, intestinal type with mucinous features. 18F‐FDG PET/CT was performed for staging showing liver lesions without FDG uptake that were later proven metastatic by biopsy. (a, b) Anterior and lateral maximum intensity projection images show uptake at the distal esophageal malignancy (arrow) and T5 vertebra (arrowhead), likely metastatic. (c) Axial noncontrast CT from the PET/CT scan shows two ill‐defined hypodense liver lesions with no uptake of radiotracer (arrows). (d–f) Axial T1 pre‐contrast, diffusion, and apparent diffusion coefficient (ADC) MRI images through the liver show hypointense lesions with diffusion restriction. Due to contrast infiltration, no post‐contrast images were obtained. Figure 15.8 Metastatic NET to the liver showing neither 18F‐FDG nor 68Ga‐DOTATOC uptake. 66‐year‐old female with history of Crohn disease on azathioprine presenting for new finding of liver masses and retroperitoneal para‐aortic lymphadenopathy with liver biopsy showing metastatic NET (WHO grade 2, Ki‐67 proliferation index 12%, SSTR2A immunostatin negative, and immunoprofile supportive of NET, likely pulmonary origin). FDG PET/CT MIP and axial views through the liver (a–c) show no abnormal uptake in the liver masses (c, arrows) and intensely hypermetabolic lymphadenopathy in the upper abdomen (a, arrowhead). Small low avidity lung nodule was also noted (not shown). DOTATATE PET/CT was performed 3 months later. MIP and axial views through the liver (d–f) show no abnormal uptake in the liver masses (f, arrows) and resolution of the abdominal lymphadenopathy status post initiation of sandostatin. Mild uptake in mediastinal lymph nodes is noted (d, arrowhead). Contrast enhanced liver MRI with arterial (g), venous (h), delayed (i), and diffusion‐weighted imaging (j) shows several relatively hypovascular liver lesions with diffusion restriction, peripheral arterial enhancement, and portal venous perilesional enhancement (arrows). Figure 15.9 Neuroendocrine tumor: 18F‐FDG uptake, but no 68Ga‐DOTATOC uptake. 62‐year‐old male with poorly differentiated NET metastatic to the liver (WHO grade 3, Ki‐67 proliferation index 60%, and negative SSTR2A receptor immunohistochemical staining). (a) Axial CT through the liver shows a hypodense right liver lesion (arrow). (b, c) 18F‐FDG PET axial fused and coronal images show intense uptake in the hepatic lesion and other small lesions (arrows). (d–f). Axial CT, 68Ga‐DOTATOC PET fused axial, and maximum intensity projection showing no radiotracer uptake, indicating somatostatin receptor‐negative disease. Rapid progression is evident between the two scans which were 3 months apart based on lesion size on CT (arrows). Figure 15.10 Normal variant MIBG uptake in left hepatic lobe. 28‐year‐old female with family history of neuroendocrine malignancy and pheochromocytoma. Genetic testing revealed no clinically significant gene mutations. (a, b) Planar whole‐body 123I‐MIBG shows normal distribution and no focal lesions. (c–e) SPECT CT through the liver shows normal variant heterogeneous increased uptake in the left lobe of the liver (arrow, c) with no correlating lesions on corresponding noncontrast CT (e).
15
Hepatobiliary Imaging
Introduction
Congenital Hepatobiliary Disorders
Neoplasm
Malignant Liver Tumors
Origin of Hepatic Metastases
Imaging of Hepatic Metastases
Some Specific Tumor Types
Neuroendocrine Tumor
Intratumoral alterations
Hypocellularity
Pulmonary
Hepatobiliary
Gastrointestinal
Endocrine
Gynecologic
Urologic
Musculoskeletal
Hematologic
Noncutaneous melanoma
Melanoma
Related posts:
 Nephro‐urinary Tract Pathologies: A Correlative Imaging Approach
 Imaging in Gliomas: Clinical Principles and Synergies with MRI
 Osteoporosis: Diagnostic Imaging and Value of Multimodality Approach in Differentiating Benign Versus Pathologic Compression Fractures
 Emergency Radiology
 Vascular System
 Infection/Inflammation Imaging
Stay updated, free articles. Join our Telegram channel

Full access? Get Clinical Tree


