Fig. 19.1
PET-CT showing irregular physiological FDG-uptake commonly seen in the bowels: (a) PET shows focal FDG-uptake in the abdomen (arrow). (b) CT shows high resolution anatomical images of the abdomen. (c) Fused PET-CT shows that the focal FDG-uptake correlates to normal configured intestines and therefore interpreted as physiologic FDG-uptake (arrow)
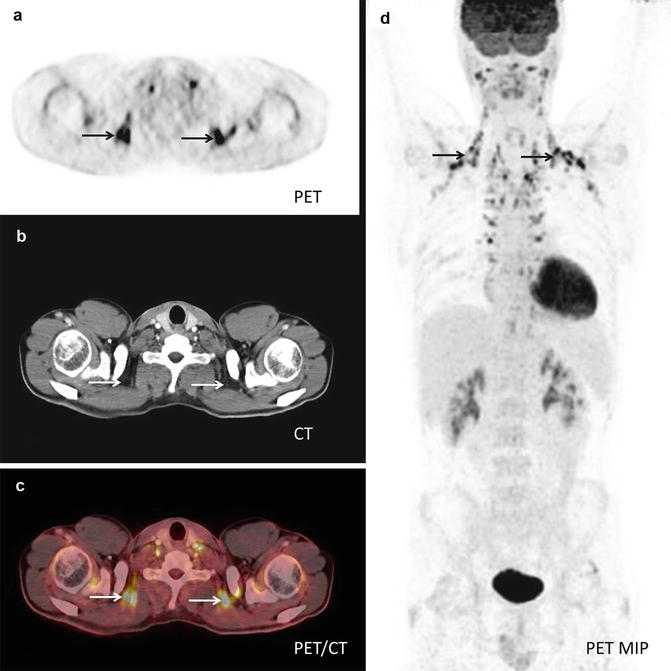
Fig. 19.2
PET-CT showing physiological FDG-uptake in brown fat: (a) PET shows intense FDG-uptake especially in the supraclavicular region (arrows). (b) CT shows high resolution anatomical images of the same region. (c) Fused PET-CT shows that the intense FDG-uptake correlates to adipose tissue (arrows). (d) PET MIP (maximum intensity projection) shows the symmetrical distribution of this metabolic active adipose tissue, aka brown fat
Two of the first larger studies comparing the performance of stand-alone PET and integrated PET-CT were published in 2003 by Bar-Shalom and in 2004 by Antoch and colleagues [20, 21]. In a retrospective, blinded analysis of 260 patients with a variety of oncologic diseases, Antoch et al. found that staging by PET-CT was significantly more accurate than staging by PEt alone or visually correlated PET and CT [20]. Bar-Shalom et al. evaluated a mixed population of 204 oncologic patients with a total of 586 suspicious lesions [21] finding that PET-CT provided additional information beyond that provided by the separate interpretations of PET and CT in 49 % of the cases and had an impact on patient management in 14 %. The impact of PET-CT on diagnostic interpretation was significantly greater for patients with abdominal findings compared to patients with findings in other regions, especially by enabling localization of physiologic FDG uptake, avoiding false-positive interpretation (Fig. 19.1). This has been confirmed by later studies focusing on gastrointestinal cancer: PET-CT optimizes localization and characterization of focal FDG uptake improving accuracy and especially specificity [23–26]. Similar findings have been reported in studies on patients with gynecologic malignancy; in a study including 103 consecutive patients with recurrent cervical or endometrial cancer, Kitajima and colleagues found PET-CT to be significantly more accurate compared to PEt alone, based on improved sensitivity as well as specificity. This improved diagnostic accuracy had an additional impact on patient management in 16 % of the patients as compared to PEt alone [27].
In the early study by Bar-Shalom et al., the impact of PET-CT was substantial not only in patients with abdominal foci, but also in characterizing thoracic lesions; almost half (12/28) of the cases in which PET-CT changed patient management had lung cancer or solitary pulmonary nodules, again avoiding false-positive interpretations by characterizing focal FDG uptake as nonmalignant, i.e., vascular structures or FDG embolus (Fig. 19.3). The superiority of combined PET-CT has also been confirmed for the staging of lung cancer, primarily with regard to assigning correct T and N stage, but not for the detection of distant metastases [28, 29]. Whereas no significant difference for the detection of distant metastases could be found in lung cancer, PET-CT was found to be significantly more accurate than PEt alone in restaging patients with malignant melanoma primarily as a result of improved sensitivity with regard to M stage (0.99, respectively, 0.89), especially for the detection of visceral metastases, including metastases to the lungs [30]. However, for follow-up of patients previously treated for malignant melanoma, no significant difference between PET and PET-CT could be found.
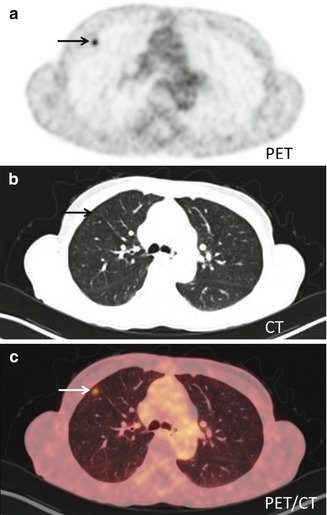
Fig. 19.3
Transaxial PET-CT of a FDG-embolus: (a) FDG-PET shows a focal accumulation of isotope (arrow) in the anterior part of the right lung. (b) CT shows high-resolution anatomical images of the lung parenchyma. (c) Fused PET-CT shows that there is no anatomical correlate to the isotope accumulation – this was therefore interpreted as being a FDG-embolus. FDG-embolus is an aggregation of FDG which follows the bloodstream after the injection to the lungs where it is trapped in the capillary bed
19.3 PET-MRI
19.3.1 Introduction to PET-MRI
For several decades PET has demonstrated its value in providing noninvasive information of tissue at the molecular level. Although the value of PET lies in its high sensitivity of biomarkers in vivo, it lacks precise anatomical information. As described above this problem was first addressed with the introduction of the PET-CT scanners in 2001. Introducing PET-MRI can, perhaps, approach some of the limitations applying to PET-CT as well as providing a new tool for molecular imaging [6].
An important limitation on the use of PET-CT is the amount of radiation exposed to the patients during diagnostic workup and follow-up schemes in patients with good prognosis, especially pediatric patients; the amount of ionizing radiation from repeated PET-CT scans is a matter of concern [31, 32] (Fig. 19.4). As CT generally accounts for approximately half of the dose associated with a PET-CT scan, substituting CT with MRI (which is performed without the use of ionizing radiation) will reduce the dose associated with the examination substantially. Thus, the availability of PET-MRI and an increased number of salvage therapies might render the clinicians more amenable, to more frequent follow-up with imaging also in younger patients [6].
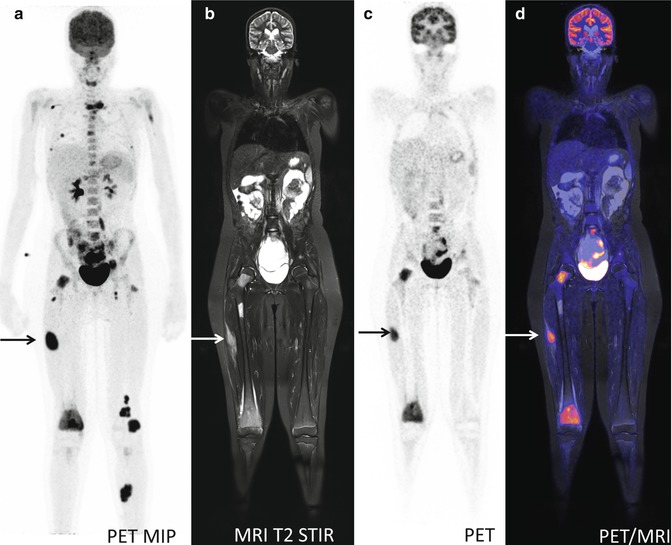
Fig. 19.4
A 13-year-old girl with neurological symptoms and pain in the right knee. FDG-PET for suspected infectious disease: (a) PET MIP demonstrates widespread foci of FDG-accumulation suspected for disseminated malignancy. (b–d) Sagittal MRI T2 STIR, FDG-PET, and fused PET-MR show soft tissue and bone marrow lesions. Biopsy from lesion in the right thigh (arrow on a–d) revealed the diagnosis: rhabdomyosarcoma
CT is a fast and reliable provider of structural information in most scenarios, but with some limitations, especially with regard to soft tissue and in areas with complex anatomy, i.e., the head and neck area and in the pelvis. MRI on the other hand is often time consuming but provides excellent soft tissue differentiation and in this aspect is considered superior to CT. Using MRI in cancer imaging could allow for more precise radiographic measurements of tumor location, size, and invasion (Fig. 19.5). In addition to routine anatomical MR imaging, a variety of MRI acquisition sequences are available which can yield images of more specific biological or functional properties of the tissue [6].
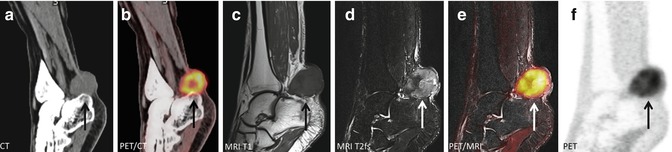
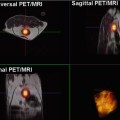
Fig. 19.5
A 50-year-old M with clear cell sarcoma surrounding the Achilles tendon: (a, b) CT and fused FDG-PET/CT shows a metabolic active tumor surrounding the Achilles tendon but cannot exclude invasion of the calcaneus bone (arrow). (c–f) Subsequent FDG-PET/MR could accurately distinguish the tumor from the adjacent bone and showed no infiltration which was confirmed by histology after surgery (arrow)
In PET-CT the duration of the CT scan is typically less than 1–2 min, whereas the PET scan lasts approximately 10–20 min from skull base to thighs. Thus, PET acquisition governs the total scan time. With simultaneously PET-MRI both modalities acquire data, and total scanning time is governed by MR imaging, so that a longer PET acquisition time could be without time loss [33]. This could make it possible to reduce the dose from the PET tracer without hampering sensitivity. Another limitation of PET-CT, not often addressed before the event of PET-MRI, is the sequential acquisition of CT and PET data. Sequential data acquisition and subsequent image fusion can hamper the possibility for accurate quantification and image interpretation due to misalignment. This is especially relevant in abdominal or thoracic studies, due to respiratory movements, bladder filling, and bowel motion [34]. Simultaneous imaging will make it possible to examine the patient in exactly identical metabolic state and condition and allows for essentially perfect temporal correlation of acquired data sets from both modalities.
Thus, combining PET with MRI provides many advantages, which go far beyond simply combining functional PET information with structural MRI information. Some of the challenges will be to adapt the MRI protocols to the PET acquisition time for each bed position and choose the right combination of PET tracer and MR imaging protocols [6]. In the following we will introduce the reader to the technical development of the PET-MRI scanner, together with faults and benefits and the current clinical evidence on the use of PET-MRI in oncology. For a more thorough introduction to specific MRI protocols, the reader should consult one of the chapters dedicated to MR imaging.
19.3.2 The Technical Evolution of PET-MRI
The success of combining PET and CT stimulated the work and interest in trying to combine PET and MRI. MRI with its excellent soft tissue contrast and its possibilities within functional imaging such as diffusion-weighted imaging (DWI), dynamic contrast enhancement (DCE), spectroscopy (MRS), functional MRI (fMRI), and arterial spin labeling (ASL), in combination with the molecular information from PET, would result in unparalleled structural, metabolic, and functional information. However, it should take almost a decade to reach the goal of a combined PET-MRI scanner.
Software fusion of PET data and MRI has been used for many years in neurology where MRI is preferred over CT and the registration between the two exams is pretty straightforward. To fuse whole-body PET and MRI exams is more troublesome due to the nonrigid patient motion between the scans and lack of stable landmarks (like the skull for image fusion in neurology imaging). Thus, there was a need for a development of combined acquisition of PET and MRI, preferably simultaneously. Combining MRI and PET in the same gantry for simultaneous imaging has some prerequisites:
1.
The PET detectors and electronics must not interfere with the field gradients or the RF signals.
2.
The PET detectors should be insensitive to the magnetic field and the RF signals.
3.
The coils must be constructed so there is a minimum of interference with RF signals and a minimum of attenuation of the coincidence photons.
4.
New strategies for PET attenuation correction have to be developed.
The challenge of combined PET and MR imaging has been approached by three major vendors of hybrid scanners in three different ways (Fig. 19.6):
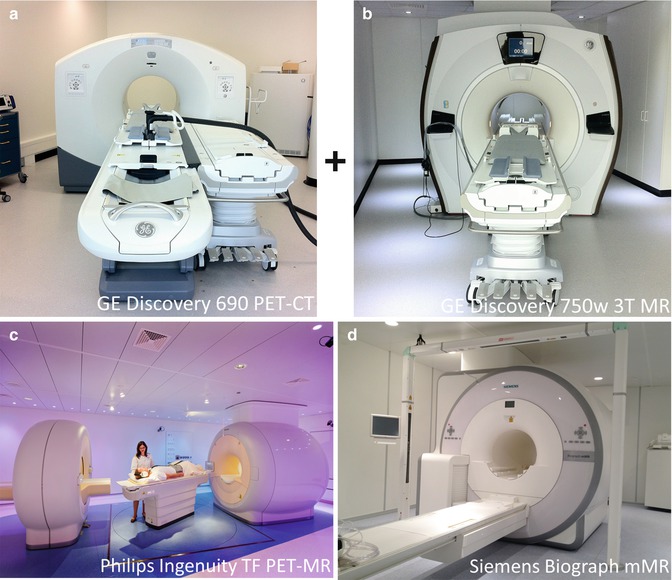
Fig. 19.6
The three commercially available combined PET and MR imaging devices as of today (summer 2013). (a) GE Discovery 690 PET-CT with air hovered board mounted onto a mobile shuttle system combined with (b) GE Discovery 750w 3 T MR (Courtesy of Patrick Veit-Haibach, MD), (c) Philips Ingenuity TF PET-MR (Courtesy of Prof. Otto S. Hoekstra) and (d) Siemens Biograph mMR
GE Healthcare has developed a kind of pseudo PET-MRI system – a tri-modality PET-CT+MRI system. This is composed of a 3 T MRI system, a state-of-the art time-of-flight PET-CT system, and a transferable board mounted onto a mobile shuttle system [35]. The shuttle system makes it possible to move the patient without repositioning between the PET-CT and the MRI, placed in separate rooms. This solution has some advantages, for example, the possibility to use the two systems together or as separate stand-alone scanners to optimize the usage. But it still is two sequential scans, and for the patient it is a long acquisition time.
In launching the world’s first really integrated PET-MRI system in 2009, Philips Healthcare used another approach [36]: This system is based on an existing 3 T MRI, combined with a PET scanner similar to the one in GEMINI TF PET-CT. The PET scanner was redesigned to be operational inside a standard MRI scanner room by applying magnetic shielding and moving all electronics from the PET gantry to the equipment room. Further, the PET and MRI scanner is placed 3 meter apart. This system acquires PET and MRI sequentially, similar to the workflow in current PET-CT systems. The system suffers some of the same drawbacks as the tri-modality PET-CT+MRI system, but possibly providing better alignment owed to less risk for patient motion between the scans.
The first example of simultaneous PET-MRI system was developed by Marsden and Cherry in 1997 [37]. A single-slice PET was placed in the receiver coil connected to PM tubes outside the magnetic field via long optical fibers. Mainly due to the signal loss in the optical fibers, this approach has never gained commercial success. Instead the work with magnetic insensitive avalanche photodiodes (APDs) prospered. APDs could replace the very magnetic sensitive photomultiplier tubes used in PET detectors, and in 2007 Pichler and colleagues presented a PET insert based on APDs. This insert fits inside a 3 T whole-body MRI scanner with the remaining space in the gantry suitable for scanning brains and extremities [38]. This same approach led to the first clinical and commercially available simultaneous whole-body PET-MRI scanner, the Siemens Biograph mMR. In the Siemens Biograph mMR, optimization of the factors mentioned initially in this section has been attempted, but further development will improve the performance of future generations of simultaneous PET-MRI systems.
19.3.3 Current PET-MRI Systems: Strengths and Weaknesses
Today, summer 2013, there are three commercial available whole-body PET-MRI systems on the market: Discovery PET-CT+MRI (GE Healthcare), Ingenuity TF (Philips Healthcare), and Biograph mMR (Siemens). The performance of these systems is roughly similar (Table 19.1), but as mentioned in the previous section the design is completely different (Fig. 19.6).
Table 19.1
Design and performance characteristics for today’s commercial whole-body PET-MRI systems
GE Discovery PET-CT+MRIa | Philips Ingenuity TF | Siemens Biograph mMR | |
|---|---|---|---|
PET | |||
Crystal type | LBS | LYSO | LSO |
Crystal size (mm3) | 4.2 × 6.3 × 25 | 4 × 4 × 22 | 4 × 4 × 20 |
Axial field of view (cm) | 15.7 | 18.0 | 25.8 |
Transaxial field of view (cm) | 70 | 67.6 | 59.4 |
Sensitivity (cps/kBq) | 7.0 | 7.0 | 13.2 |
Axial resolution 1 cm (mm) | 5.6 | 4.9 | 4.5 |
Axial resolution 10 cm (mm) | 6.3 | 5.5 | 6.7 |
Transverse resolution 1 cm (mm) | 4.9 | 4.9 | 4.4 |
Transverse resolution 10 cm (mm) | 6.3 | 5.5 | 5.2 |
Time-of-flight | Yes | Yes | No |
MR | |||
MR field strength | 3 T (or 1.5 T) | 3 T | 3 T |
MR field of view (cm3) | 50 × 50 × 50 | 50 × 50 × 45 | 50 × 50 × 45 |
PET-MRI | |||
Max patient weight (kg) | 180 | 200 | 200 |
Min gantry diameter (cm) | 70 | 60 | 60 |
Acquisition | Sequential (two separate rooms) | Sequential (same room) | Simultaneous |
Attenuation correction | CT based | MRI based | MRI based |
Presently, Siemens mMR is the only truly integrated PET-MRI scanner enabling simultaneous imaging possible. However, a PET-CT+MRI system has some obvious advantages, especially regarding the possibility to obtain a CT-based attenuation correction and thereby a reliable PET quantification. Although improvement of the MRI-based attenuation correction has been done, it is still work in progress and with plenty of room for future improvement. Especially the problem of correctly identifying bone in the head and neck region is a serious challenge, together with correct segmentation of tissue in close proximity to metal containing implants and devices. Until this problem is solved, clinical users should routinely review non-corrected and attenuation-corrected emission images together with the diagnostic MR images and the MRI-based attenuation maps (μ-maps) (Fig. 19.7) in order to elucidate and interpret possible image artifacts arising from MRI-based AC [39] (Fig. 19.8). Unfortunately, we do not expect a completely reliable MRI-based attenuation correction method for quantitative whole-body imaging to be developed within the next 2–3 years.
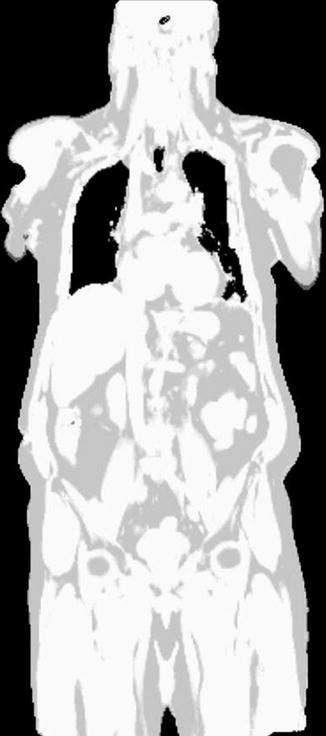
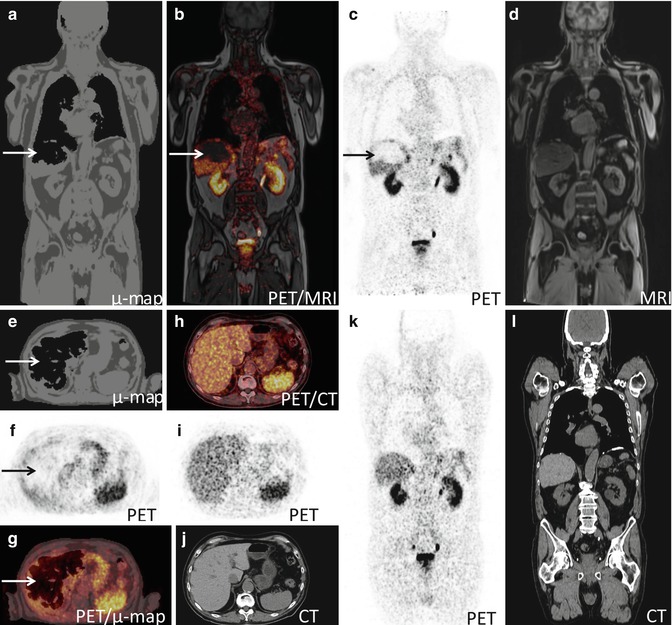
Fig. 19.7
MR-based attenuation map (μmap) from Dixon Water Fat segmentation. In- and opposed-phase MR imaging is used for delineation of the four classes of attenuation coefficients: soft tissue, fat, air, and lung (identified by post-processing algorithm) but not bone
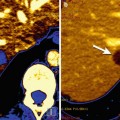
Fig. 19.8
MRI-based attenuation map (μmap) from a 64Cu-Dotatate-PET/MRI scan illustrating an artifact in the liver (arrow). (a–g) PET/MRI, (h–l) PET-CT. (a and e) MRI-based attenuation map (μmap) where the algorithm has falsely segmented a substantial part of the liver as air, (b and g) attenuation corrected PET fused with MRI erroneous revealing an area in the liver without FDG-uptake, (c and f) attenuation corrected PET, (d) MRI, (h–l) corresponding images from a subsequent PET-CT with correct attenuation correction
Another advantage of the PET-CT+MRI system is the broader gantry. In the simultaneous system the PET scanner is inserted into the gantry of the MRI scanner, resulting in a narrow and relative long tunnel. This can be a challenge regarding patient comfort, especially for patients with a tendency of claustrophobia and obese patients. A bigger gantry will be less claustrophobic and render it possible to scan patients in fixation devices for radiotherapy planning.
The advantages of the truly integrated PET-MRI scanner enabling simultaneous acquisition are however also quite obvious: This method will reduce misalignment, shorten the total acquisition time, potentially reduce radiation burden, make it possible to do synchronized image gating, and to acquire PET and MRI data simultaneously for functional studies under identical physiological conditions. Thus it is our conviction that the development of future PET-MRI scanners will focus on optimization of the truly integrated PET-MRI and gradually abandon the in-line system.
19.3.4 Clinical and Research Application in Oncology
Reported evidence on the use of PET-MRI in oncology is steadily increasing. However the bulk of evidence comes from mixed populations or smaller case series reporting the experience with PET-MRI compared to PET-CT, performing clinical PET-CT in a mixed population followed by PET-MRI on the same injection of FDG [40–45]. As PET-MRI was developed and launched ahead of detailed considerations for practical issues like clinical application, work flow, optimized scan protocols, and attenuation correction [6, 46], this seems to be the logical way to go. But, apart from the small number of patients, this approach causes a number of problems: The sequential acquisition of PET-CT and PET-MRI, often more than an hour apart, makes interpretation and comparison of sensitivity and quantification very difficult – is the difference in focal findings and/or SUV values between the modalities due to different FDG kinetics (dual-time point imaging), technical quality, or different methods for attenuation correction? [40, 43
 New Therapies and Functional-Molecular Imaging
 Overview of Functional MR, CT, and US Imaging Techniques in Clinical Use
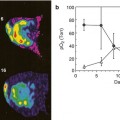 MRI Hypoxia Measurements
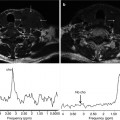
 Spectroscopy of Cancer
 Dual-Energy and Spectral Energy Computed Tomography: Oncological Body Applications in Clinical Use
 Medical Image Computing for Oncology: Review and Clinical Examples


Related posts:
New Therapies and Functional-Molecular Imaging
Overview of Functional MR, CT, and US Imaging Techniques in Clinical Use
MRI Hypoxia Measurements
Spectroscopy of Cancer
Dual-Energy and Spectral Energy Computed Tomography: Oncological Body Applications in Clinical Use
Medical Image Computing for Oncology: Review and Clinical Examples
Stay updated, free articles. Join our Telegram channel
Full access? Get Clinical Tree
