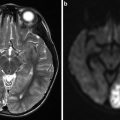
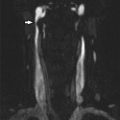
Fig. 1
The consecutive steps of blood vessel branching are shown, with the key molecular players involved denoted in parentheses. (a) After stimulation with angiogenic factors, the quiescent vessel dilates and an endothelial tip cell is selected (DLL4 and JAGGED1) to ensure branch formation. Tip-cell formation requires degradation of the basement membrane, pericyte detachment, and loosening of endothelial cell junctions. Increased permeability permits extravasation of plasma proteins (such as fibrinogen and fibronectin) to deposit a provisional matrix layer, and proteases remodel preexisting interstitial matrix, all enabling cell migration. For simplicity, only the basement membrane between endothelial cells and pericytes is depicted, but in reality, both pericytes and endothelial cells are embedded in this basement membrane. (b) Tip cells navigate in response to guidance signals (such as semaphorins and ephrins) and adhere to the extracellular matrix (mediated by integrins) to migrate. Stalk cells behind the tip cell proliferate, elongate, and form a lumen, and sprouts fuse to establish a perfused neovessel. Proliferating stalk cells attract pericytes and deposit basement membranes to become stabilized. Recruited myeloid cells such as tumor-associated macrophages (TAMs) and TIE-2-expressing monocytes (TEMs) can produce pro-angiogenic factors or proteolytically liberate angiogenic growth factors from the ECM. (c) After fusion of neighboring branches, lumen formation allows perfusion of the neovessel, which resumes quiescence by promoting a phalanx phenotype, reestablishment of junctions, deposition of basement membrane, maturation of pericytes, and production of vascular maintenance signals. Other factors promote transendothelial lipid transport (From Ref. [3] with permission)
Plasma proteins extravasate into the extravascular space and form an early extracellular matrix, while integrin signaling stimulates migration of EC onto the matrix. New vessels grow in an ordered process that involves migration of a single EC, known as the tip cell along the new matrix. Nearby EC, known as stalk cells, divide to form an elongated vascular core that then develops a patent lumen in response to a range of signaling molecules. These new vessels fuse with existing ones to initiate blood flow and, in time, develop a pericyte coverage. As they mature they may reform EC tight junctions and basement membranes.
In general terms, rapidly growing aggressive tumors provide greater angiogenic drive and will result in increasingly disordered microvascular environments. In some, slowly growing, tumors such as low-grade meningiomas, the microvascular architecture can be remarkably structured with well-developed hexagonal arteriolar and capillary territories clearly seen. In more aggressive tumors such as glioma, tumor vessels are disorganized, irregular, and tortuous with bizarre branching patterns. They do not maintain the normal arterial/capillaries/venous hierarchy and all components of the tumor vessel wall are abnormal. EC tight junctions are absent, rendering tumor vessels leaky to macromolecules and often with a propensity to microhemorrhage. These neovascular structures are dynamic, showing constant changes in blood vessel development and variations in hemodynamics so that blood flow in individual regions may change in volume and direction even over short time periods. Primary malignant brain neoplasms exhibit the greatest degree of vascular proliferation of any tumor type, and angiogenesis is a key step in their progression [4].
Most tumors have far less blood flow than would be expected from their vascularity, reflecting the inefficiency of the tumor vasculature. In addition, leakage of large molecules and the lack of normal lymphatic drainage can result in high interstitial pressures, which further impair regional perfusion. Consequently, regional hypoxemia and necrosis are common, particularly in aggressive tumors .
Antiangiogenic Therapies
The ubiquitous nature of the angiogenic process led to great excitement in the 1990s with the hope that therapeutic approaches, which targeted pathological angiogenesis, would provide a “magic bullet” that could be used to deprive a large range of tumors of the blood vessels necessary for development and expansion. The development of antiangiogenic drugs and of antivascular agents, which target abnormal, developing vessels, led to one of the most extensive areas of anticancer research in recent decades. Despite this, antiangiogenics, while showing efficiency as single or combination agents in a number of tumor types, have failed to provide the prolonged tumor suppression of tumor activity commonly observed in animal models. Many mechanisms have been identified which imbue tumor cells, EC, or other components of the tumor stroma with resistance to angiogenic inhibition, and some agents have proven toxic when combined with chemotherapy [5]. Compensatory increase in other pro-angiogenic signaling pathways can support tumor angiogenesis independently from VEGF, and some evidence is beginning to suggest that antiangiogenic therapy may cause cancer cells to become increasingly malignant in behavior. Secondary hypoxia can induce mutations resulting in hypoxic-resistant tumor cells and alternate pro-angiogenic “escape” mechanisms. In glioma there is also evidence that EC can be formed from primary tumor stem cells via a process that is relatively insensitive to blockade of VEGF. While the lack of curative single-agent efficiency is disappointing, it is clear that antiangiogenic agents offer significant survival benefit in combination therapies and research into this mechanism of drug action continues, albeit with new expectations. The main questions which now face imaging researchers in this field are more demanding and include: Can IB predict therapeutic response to specific agents or combination therapies? Can IB guide selection of optimal therapeutic combinations? Can IB be used to optimize the timings of combination therapies? Can IB identify and/or predict specific mechanisms of resistance and appropriate subsequent interventions?
Imaging the Tumor Vascular Microenvironment
It is clear that the TVM represents one of the most profoundly important factors both in tumor behavior and therapeutic response. It controls the ability of individual regions of proliferating tumor cells to obtain sufficient nutrients and oxygen. Failure of vascular development, adequate to the requirements of the developing tumor, results in regional hypoxia with the consequent effects on local tumor and blood vessel growth and a drive toward genotypic instability and tumor cell mutation. It can also result in regional necrosis and tumor cell death. Features of the TVM also control the passage of macromolecules and inflammatory cells into the tissue and the generation of hematogenous metastatic deposits. The ability to study and measure these biological processes is essential, and many can be characterized and quantified in exquisite detail on the basis of tissue biopsy or even by examination of circulating tumor cells and soluble biomarkers. Despite this, imaging techniques remain the only available approach to studying the TVM in situ without the need for biopsy or surgical resection. Furthermore, imaging techniques support studies of the entire tumor, can provide information on the heterogeneity of individual biological features, and can, in many cases, be optimized to provide biological data of direct relevance to tumor biology. These features, together with the minimally invasive nature of most imaging techniques and the ability to repeat studies whenever necessary, give imaging significant advantages over other methodological approaches.
In recent years, the concept of the imaging biomarker (IB) has become the basis for the development of novel imaging methods. A biomarker is defined as “a quantitative parameter which directly reflects the physiology, anatomy or pathological process under investigation.” The use of soluble and tissue biomarkers, like prostate-specific antigen or CA 125, has led to the development of “biomarker roadmaps” designed to standardize the discovery, technical, and biological validation of individual biomarkers to ensure that they are fit for purpose. The concept of an IB is identical and requires identification of a potentially valuable, measurable imaging feature, proof that it is technically measurable in single or multi-institutional settings, characterization of its repeatability and reproducibility, and evidence to support its biological validity. For imaging techniques the technical validation steps are often more extensive than those required for soluble and tissue biomarkers and can be technically challenging, particularly where imaging techniques must be standardized across different manufacturers, imaging platforms, and institutions. Despite this, the development of novel IB now forms one of the main areas of imaging research both in cancer and other diseases.
In the remainder of this chapter, the IB available for quantified imaging of the TVM is reviewed, the evidence for their technical and biological validity is discussed, and their applications to the present time are reviewed.
Imaging Biomarkers
The development of IB to characterize the tumor microenvironment and the angiogenic process has been and continues to be a major area of imaging research. All major modalities have been utilized, including CT, MR, single-photon emission computed tomography (SPECT), positron emission tomography (PET), ultrasound, and optical imaging. The last two are largely experimental, being used primarily in the intraoperative setting or in animal models of disease, and will not be discussed further.
Most early imaging studies focused on the characterization of aspects of the TVM involved in the angiogenic process, specifically the amount of blood vessels and the increases in capillary endothelial permeability induced by pro-angiogenic cytokines. Both of these features can be estimated using dynamic contrast-enhanced imaging techniques, which are now widely employed both in clinical practice and in trials of antiangiogenic and vascular targeting agents. However, more recently there has been significant interest in developing biomarkers that target other aspects of the TVM, leading to the description of an increasingly wide range of IB and, in particular, of PET-based molecular imaging agents.
Biomarkers of Perfusion and the Vascular Microenvironment
The early development of IB for tumor microvascular structure focused on attempts to measure the known histological features of angiogenic tissue. Classically, histochemical staining studies had identified the importance of the density of new vessels (microvascular density; MVD) measured on stained tissue. MVD has been shown to relate to malignancy and outcome in a number of tumors and is routinely used in histological studies [6]. It was quickly realized that a theoretical surrogate of MVD could be extracted from dynamic contrast-enhanced MRI.
Dynamic Susceptibility Contrast-Enhanced MRI (DSCE-MRI)
Early studies concentrated on the use of dynamic T2*WI acquisitions, often referred to as Dynamic Susceptibility Contrast-Enhanced MRI (DSCE-MRI), in neoplastic and cerebral vascular disease. The initial focus on DSCE-MRI arose from the fact that system architecture at that time made rapid dynamic acquisitions with T2* star weighting more straightforward than dynamic T1-WI imaging. More importantly, the signal change in T2*WI images arises from the effects of the locally altered magnetic field which extends some distance from the contrast molecule. In isolated capillary beds this means that signal is generated from protons within the extravascular extracellular space (EES), even if contrast molecules remain entirely intravascular. This susceptibility effect gives rise to slightly higher proportional signal changes in the normal gray and white matter which is a significant advantage in normal cerebral capillary beds. The analysis of the dynamic signal intensity time course curves (SI-TCC) from DSCE-MRI is also relatively straightforward. Dynamic time course signal changes can be transformed into estimates of contrast concentration time course curves (CAA-TCC) from which estimates of proportional cerebral blood volume can be derived as the area under the contrast agent concentration curve during its first passage. This area correlates with the proportion of the volume of the voxel filled by blood vessels often referred to as the relative cerebral blood volume (rCBV). By scaling to normal white matter or pure vascular tissues (large veins), rCBV can be normalized to produce absolute values (CBV), which have shown close agreement with histological assessment of MVD in a number of cancer types and show similar correlations with tumor grade, aggressiveness, and survival data [7].
The basic analysis approaches for the DSCE-MRI assumed that contrast agent remains intravascular in the presence of an intact blood–brain barrier. In tumor tissue this causes very significant errors since contrast agent leakage into the EES produces contradictory signal changes, due to T1 effects. These give rise to artificially low estimates of CBV (so-called T1 shine through). These leakage errors can be reduced by preloading the tissue with a dose of contrast agent prior to the dynamic contrast study, by the use of low flip angle sequences with low T1 sensitivity, or by signal post-processing [8]. Increasingly, contrast agent preloading, signal processing, or a combination of the two is routinely used. The use of low flip angle acquisition sequences has been relatively unpopular since, although these do abrogate the effect of the so-called T1 shine through signal, they also result in significant decreases in signal-to-noise ratio with consequent reductions in the accuracy of subsequent curve fitting analyses.
The growing application of DSCE-MRI in neuro-oncology led to a number of additional analytical approaches designed to provide additional data about the TVM. It was rapidly realized that in tumor vasculature, the normal shape of the CC-TCC was distorted by retention of contrast agent following the first passage of the contrast bolus. This elevation of contrast concentration was first described as the relative recirculation (rR) parameter and has also been widely referred to as the percentage recovery (describing the percentage of signal recovery to the baseline). This has been variously attributed to contrast linkage and to retention of contrast agent within the abnormal microvasculature due to vessel tortuosity and regional reductions in perfusion pressure. These metrics allow identification of areas of tumor where capillary flow is present, but delayed, corresponding to regions with reduced perfusion pressure and reduced flow and has been used to differentiate GBM from metastasis [9].
The development of more complex image analysis techniques led to the development of pharmacokinetic models designed with the intention of measuring regional blood flow and/or capillary endothelial permeability. These approaches require correction of the tissue residue function from the individual tumor voxels to correct for variations in the width of the injected arterial bolus, known as the arterial input function (AIF). Correcting for the variation between patients resulting from individual variations in AIF allows estimations of regional capillary blood flow. Unfortunately, the accuracy of these estimates is greatly affected by delays in the arrival of the contrast bolus within the tissue and by variations in dispersion of the contrast bolus, which result from a combination of flow delays and irregular vessel flow patterns. The result of these effects is that regional capillary flow estimates can only be acquired reliably where there can be an assumption of normal arterial/capillary/venous hierarchy, which is not the case in tumor tissue [10].
Most early antiangiogenic agents targeted VEGF or VEGF signaling. Since VEGF produces rapid and significant increases in the permeability of the endothelial membrane, considerable work was directed toward the quantification of permeability by measurement of MR contrast agent leakage. Analysis of DSCE-MRI using a two-compartment leakage model was described in an attempt to estimate permeability surface area product of the local tumor capillary bed. These pharmacokinetic analysis techniques allow estimation of the contrast transfer coefficient (Ktrans) between the plasma and extravascular extracellular space (EES). However, modeling of leakage effects using T2* dynamic images is challenging, and attention rapidly shifted to the use of T1-WI dynamic acquisitions .
Dynamic Relaxivity Contrast-Enhanced MRI (DRCE-MRI)
On T1-WI images, signal change observed in response to intravascular and extravascular contrast agent is additive, simplifying attempts to estimate the magnitude of contrast agent leakage in comparison to DSCE-MRI. Furthermore, the majority of clinical MR scanning systems are capable of acquiring DRCE-MRI data. DRCE-MRI data can be analyzed using simple semiquantitative metrics, although in research applications these have commonly been avoided since intensity changes can vary between systems due to differences in acquisition sequence design, receiver gain settings, and other technical variables. Early studies attempted to minimize these sources of variation by the use of simple, normalized, metrics such as the maximal rate of change of signal intensity or the ratio of pre- and postcontrast signal intensity. Subsequent improvements in hardware and particularly in gradient coil design have minimized variations in observed signal change, and these together with the use of normalized metrics have led to routine clinical use of semiquantitative measurements in prostate, breast, pancreatic, cervical, colonic, and rectal cancers, bone sarcoma, as well as brain tumors. The clinical preference for semiquantitative metrics reflects the complexity of pharmacokinetic approaches and the lack of available standardized software for clinical application (Fig. 2) [11].
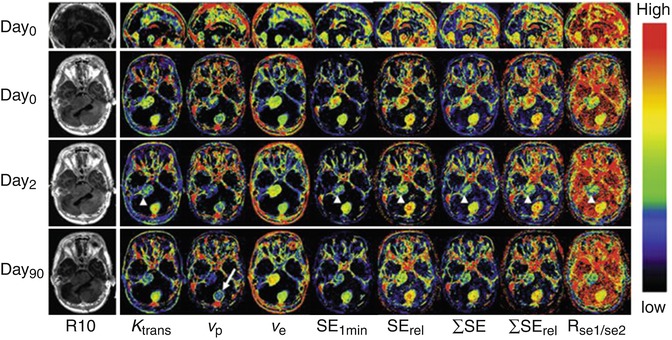

Fig. 2
Axial view of central slices of 3D longitudinally co-registered kinetic and semiquantitative parametric maps obtained in a 26-year-old woman, who has Type II neurofibromatosis with a progressive VS (arrow heads) and an occipital located meningioma (arrow) undergoing treatment with bevacizumab. Images show comparisons of pharmacokinetic leak derived parameters Ktrans, vp, and ve with semiquantitative parameters: (1) absolute signal enhancement (SE1min), (2) relative signal enhancement (SErel) which uses a baseline value for normalization in order to reduce the dependence on biological and imaging system variables, (3) the sum of SE over a fixed post–injection duration (SE), (4) the sum of SE rel over a fixed post–injection duration (SErel), and (5) signal enhancement ratio, commonly defined as the ratio of early to late contrast enhancement ratio, e.g.,  (From Ref. [11] with permission)
 (From Ref. [11] with permission)
Despite this a desire for better standardization across imaging systems and for greater physiological specificity led to the development and widespread application of pharmacokinetic analytical approaches [12].
Pharmacokinetic analysis of DRCE-MRI data requires transformation of signal change measurements into estimates of contrast agent concentration to allow the measurement of CC-TCC (Fig. 3).
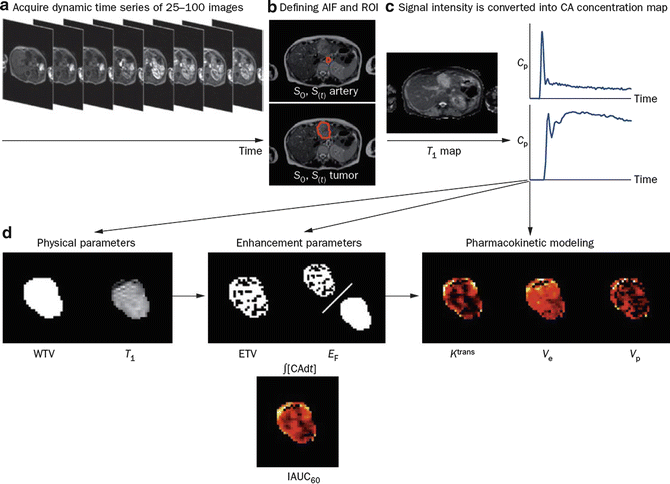

Fig. 3
DCE-MRI data acquisition and analysis. (a) Multiple images (typically 25–100) are acquired as a bolus of contrast agent passes through tissue capillaries; (b) the region of interest for a tumor and the feeding vessel arterial input function are defined; and (c) signal intensity values for each voxel are converted into contrast agent concentration using a map of T1 values. These steps allow calculation of (d) WTV and T1 values. Next, voxels are classified as enhancing or not after which parameters based on the amount and proportion of enhancement can be defined, along with the IAUC60. Finally, a pharmacokinetic model may be applied to derive parameters such as Ktrans. Abbreviations: ∫[CA]dt area under the contrast agent–time curve, AIF arterial input function, Cp contrast agent concentration in plasma, CA contrast agent, DCE-MRI dynamic contrast-enhanced MRI, EF enhancing fraction, ETV enhancing tumor volume, IAUC60 initial area under concentration agent–time curve at 60 s, Ktrans volume transfer constant between plasma and the extracellular extravascular leakage space, ROI region of interest, S signal, T1 longitudinal relaxation time, ve volume of extracellular extravascular leakage space, vp blood plasma volume, WTV whole tumor volume (From Ref. [13] with permission)
This can be performed assuming that the baseline T1 values of the tissue are measured prior to contrast agent administration. While accurate measurement of T1 values can be time-consuming, the use of multiple flip angle gradient echo sequences produces adequate accuracy in acceptable acquisition times and has become routine. Analysis of the CC-TCC can then be undertaken using a variety of pharmacokinetic distribution models. All of these models require provision of an explicit input function representing the arterial input to the tissue (AIF). The accuracy of measurement of AIF has a considerable effect on the accuracy of derived values of parameters from the analysis, and many authors have studied the optimal sampling and modeling of the AIF. Where an AIF cannot be measured with sufficient accuracy, then a population-based AIF may be applied.
The most common pharmacokinetic analysis approach is a modified version of the original Toft’s pharmacokinetic model that produces estimates of vascular fraction (v p ), extravascular extracellular space fraction (v e ), and the transfer contrast coefficient (Ktrans) [14]. The Ktrans parameter is widely used in DRCE-MRI studies, often as a potential surrogate of capillary endothelial permeability. However, although Ktrans will be affected by the permeability, it is a bulk transfer coefficient, so that it is also affected by the surface area of the capillary endothelial bed and by rate of delivery. This means that in very low flow states, particularly where leakage is high, the transfer coefficient will depend almost entirely on flow, whereas in high flow states with low permeability, it will depend almost entirely on permeability. Nonetheless it rapidly became evident that the VEGF inhibition was indeed associated with rapid and profound reductions in Ktrans [13]. Although the modified Toft’s model has been widely used, a variety of alternate pharmacokinetic models exist, ranging from simple two-compartment models, such as the original Toft’s model, to more complex models, such as the adiabatic tissue homogeneity model, where more specific physiological information is sought by definition of additional biological variables (Table 1).
Table 1
Parameters derived in DCE-MRI
Parameter | Definition | Unit | Notes |
|---|---|---|---|
Primary end points a | |||
K trans | Volume transfer constant between plasma and the EES | min−1 | Composite measure of permeability, capillary surface are and flow |
IAUC60 | Initial area under concentration agent-time curve at 60 s | mmol min | Similar measure to Ktrans, but also influences by Ve |
Alternative functional biomarkers b | |||
k ep | Rate constant between EES and plasma | min−1 | NA |
V e | Volume of EES per unit volume of tissue | NA | NA |
V p | Blood plasma volume | NA | Relatively poor reproducibility |
F | Blood flow | ml/g min−1 | Temporal resolution achieved in most studies s too slow |
PS | Permeability surface area product per unit mass of tissue | ml/g min−1 | Temporal resolution achieved in most studies is too slow |
Alternative biophysical measurements c | |||
WTV | Whole tumor volume | mm3 | Easy to measure |
ETV | Enhancing tumor volume | mm3 | Easy to measure |
E F | Enhancing fraction (ETV:WTV ratio) | none | Easy to measure |
T 1 | Longitudinal relaxation time | ms | Easy to measure |
The choice of appropriate pharmacokinetic models depends on a wide range of factors. In some instances the demands of an individual study may require absolute estimation of physiological variables such as regional capillary blood flow (F) which can be provided only by more complex models. In contrast, the use of increasingly complex models introduces uncertainty into parameter estimates due to the need to optimize to an increasing number of variables. This in turn places significant demands on the image acquisition strategy requiring high temporal resolution data with high signal-to-noise characteristics. The need to “square the circle” by producing very high spatial resolution data with high temporal resolution measurement of the AIF and high signal-to-noise characteristics has led to extensive research into MR image acquisition leading to a number of novel fast image acquisition approaches for DCE-MRI and the development of dual injection methods where separate dynamic acquisitions are acquired to provide matched high spatial and high temporal resolution data .
Dynamic Contrast-Enhanced Computed Tomography (DCE-CT)
With the development of rapid multi-slice CT acquisitions, it was natural that the analytical approaches taken with DCE-MRI would be applied to CT data. Dynamic CT (DCT) has a number of potential advantages over MRI. The main one of these is that the concentration of contrast agent is directly linearly related to the measured attenuation value; this makes measurements of semiquantitative parameters and the application pharmacokinetic models more simple and alleviates many of the problems associated with multicentered studies in MRI [16]. The main problem with DCT is of course the radiation dose, which is significant and limits the application of the technique into clinical trials requiring repeated imaging measurements.
Stay updated, free articles. Join our Telegram channel

Full access? Get Clinical Tree


