Location
Frequency (%)
Hypertension
36
Aneurysm
36
Arteriovenous malformation (AVM)
11
Others
17
Hemorrhagic strokes represent 10–15 % of all strokes and are characterized by the sudden onset of a focal neurologic deficit due to intracranial hemorrhage, which can be intraparenchymal (IPH), subarachnoid (SAH), intraventricular (IVH), or a combination of locations. IPH is more likely to mimic acute ischemic stroke, while subarachnoid hemorrhage classically presents with “thunder clap” headache. IPH will more commonly manifest as seizures and nausea/vomiting. However, there is considerable overlap in the presenting symptoms for both IPH and SAH.
Non-contrast-enhanced head CT is often the imaging modality selected for the initial evaluation of suspected intracranial pathology. The wide availability in various clinical settings, the ability to scan without antecedent safety screenings (as in MR), and extremely rapid image acquisition and reconstruction have made CT the imaging modality generally used in the setting of a neurologic emergency. If there is high clinical suspicion for vascular pathology, starting with advanced imaging techniques, most often CTA or MRI/MRA can be performed [1, 2]. Once intracranial hemorrhage is detected, follow-up imaging with contrast-enhanced CT and/or MR imaging, with dedicated angiographic images (CTA/MRA) without or with perfusion, is often warranted if the etiology is not immediately obvious. The choice of modality will depend on patient issues (e.g., rapid clinical deterioration, MR-incompatible medical devices, uncooperative patient) and the most highly suspected underlying pathology (e.g., vascular lesion versus a hemorrhagic mass). In some cases, the patient will be best assessed and potentially treated by proceeding directly to conventional catheter-directed angiography. Given the appearance and distribution of the hemorrhage and the clinical presentation, a reasonable short differential diagnosis can be developed which will guide selection of the appropriate follow-up imaging modality.
Hypertensive Hemorrhage
Arteriopathy related to long-standing hypertension is the most common cause of spontaneous nontraumatic intracranial hemorrhage in adults [3]. Chronic systemic hypertension produces degeneration of the deep penetrating arteriolar branches of the major intracranial arteries on the basis of intimal hyperplasia and medial degeneration. These affected arterioles are the very small vessels at termination points of the perforators arising as end artery branches from the anterior and posterior circulation. Over time, sustained hypertension leads to deposition of hyaline, fibrin, and collagen in the arteriolar walls, leading to degeneration. Arteriolar sclerosis leads to narrowing of the vessel lumen and ischemia, with the ultimate end result being lacunar infarcts. Additionally, as arteriolar walls degenerate, they become weakened and begin to dilate partially on the basis of lipid and collagen replacing arteriolar smooth muscle cells, leading to formation of so-called Charcot–Bouchard microaneurysms (Fig. 1). These are not true aneurysms but rather are more accurately classified as degenerative fusiform dilations of chronically diseased vasculature. These weakened, dilated walls are thought to be more prone to rupture.
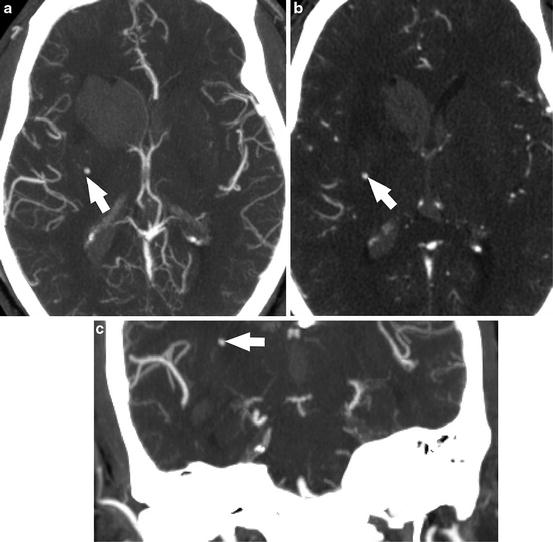
Fig. 1
Acute hypertensive hemorrhage. (a) Axial CTA maximum intensity projection image demonstrates intraparenchymal hemorrhage centered within the right caudate nucleus, with extension into the ventricular system. A punctate enhancing structure in the right basal ganglia represents an unruptured Charcot–Bouchard microaneurysm (arrow). (b) Axial source images from the CTA again show this enhancing punctate structure (arrow). The coronal MIP reformat CTA image (c) shows that the microaneurysm is at the termination of a lenticulostriate artery
Hypertensive hemorrhages occur in predictable locations, a characteristic that is useful in identifying chronic hypertension as the most likely etiology for intracranial hemorrhage. About 66 % occur in basal ganglia, particularly in the putamen and external capsule, 20 % within the thalamus, 10 % within the pons, 5 % within the cerebellum, and 5 % within the subcortical white matter (Table 2). It is important to note that while the basal ganglia, thalamus, and brainstem are the most common locations for hypertensive hemorrhage, this etiology must be considered in the differential diagnosis of spontaneous lobar hemorrhage, especially in the appropriate clinical setting (Fig. 2).
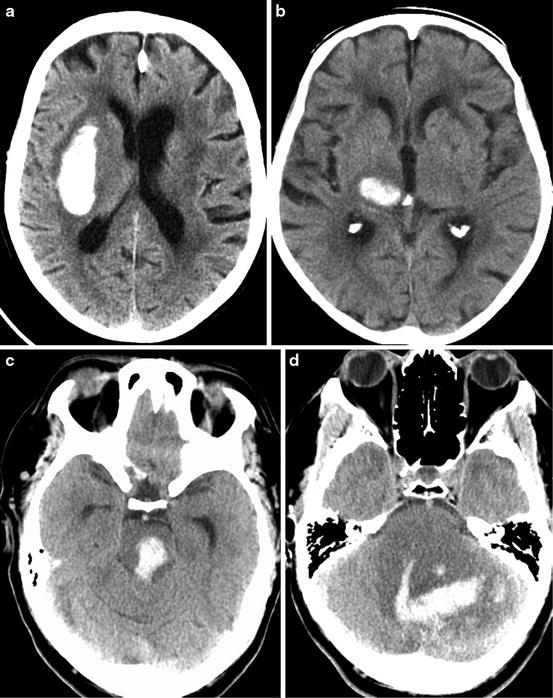
Table 2
Location of hypertensive hemorrhage
Location | Frequency (%) |
|---|---|
Putamen/external capsule | 60 |
Thalamus | 20 |
Pons | 10 |
Cerebellum | 5 |
Subcortical white matter | 5 |
Fig. 2
CT images in four patients demonstrate the classic locations of acute hypertensive hemorrhages, including the (a) putamen, (b) thalamus, (c) pons, and (d) cerebellum. Note that the cerebellar hemorrhage has extended in to the fourth ventricle. Dilation of the temporal horns of the lateral ventricles indicates obstructive hydrocephalus
In the acutely symptomatic patient, acute hemorrhage will be identified in characteristic locations, as detailed above. However, given the volume of brain MR imaging done for myriad potentially unrelated indications, sequelae of chronic hypertensive arteriopathy are often incidentally detected. Specifically, T2* GRE and SWI sequences will reveal loss of signal and “blooming,” often multifocal, in the distributions of the deep perforators. Multiple hypertensive microhemorrhages (Fig. 3) may mimic the presentation of cerebral amyloid angiopathy (CAA). This topic is discussed in detail later in the chapter. Some other potential associated findings seen in the setting of acute hypertensive hemorrhage include loss of brain volume, a background of chronic ischemic microvascular disease in the white matter, and old small lacunar infarcts. It is important to consider the possibility of illicit drug use, especially cocaine and other sympathomimetic drugs, as potential etiologies of acute intracranial hemorrhage in typical locations of hypertensive hemorrhage in otherwise healthy young patients.
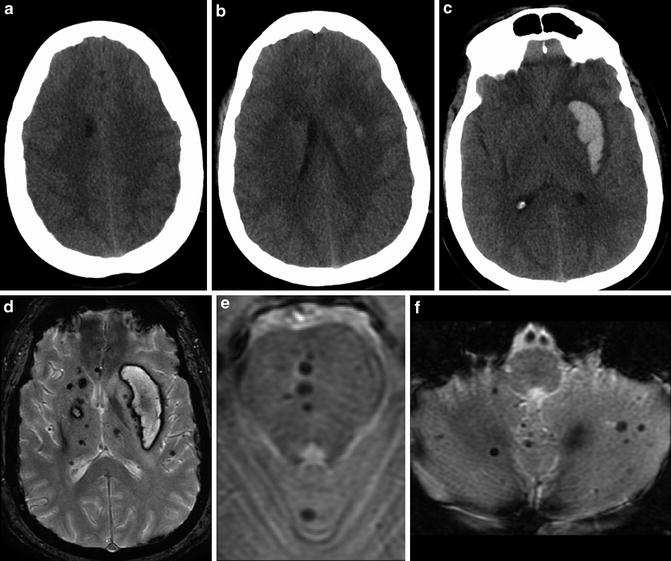
Fig. 3
Series of unenhanced head CT images obtained from a 30-year-old male presenting with right-sided weakness. Multiple hypodense foci were identified in the deep gray matter and white matter, including within the white matter of the right frontal lobe (a) and right caudate (b, c). A large acute hemorrhage was identified centered within the left putamen. Series of T2* MR images obtained in follow-up approximately 3 weeks after presentation. (d) Multiple microhemorrhages are identified within the bilateral basal ganglia and thalami. There has been evolution of the dominant left putaminal hematoma. (b, c) Additional microhemorrhages are identified in the central (e) pons and (f) cerebellum
The size of a hematoma on initial imaging and its subsequent expansion portend a worse prognosis in this patient population. Expansion of hematoma is identified in approximately one-third of cases of acute hypertensive hemorrhage and is most likely to occur within several hours of symptom onset. In the setting of active extravasation, the “swirl sign” may be seen on unenhanced head CT, characterized by hypodense acute liquid blood products surrounding a hyperdense organizing clot. Although not routinely performed in all institutions if there is a classic imaging presentation of acute hypertensive hemorrhage, dynamic combined CT/CTA imaging can be helpful in assessing the severity of the hemorrhage and the relative urgency of surgical decompression versus close clinical and imaging surveillance. Specifically, delayed post-contrast CT imaging performed shortly after the CTA acquisition is useful to assess for active blood–brain barrier breakdown. Contrast pooling within the hematoma seen on the delayed post-contrast imaging is indicative of active arterial extravasation. Additionally, the so-called spot sign, a focus or foci of arterial phase enhancement within the center of the hematoma, is visualized in approximately one-quarter of cases (Fig. 4) [4]. It has been speculated that this “spot sign” may actually represent visualization of the culprit microaneursym within the area of hemorrhage. The spot sign is present in 20–30 % of acute IPH patients presenting within 3–10 h of symptom onset. The spot sign provides prognostic information, as up to 75 % of these patients will go on to have extension of their hematomas. Additionally, the presence of active contrast extravasation on CTA (Fig. 5) is a predictor of poor clinical outcome and increased in hospital mortality (OR >10). It should be noted that the sensitivity and specificity of the spot sign appear to be dependent upon the timing of CTA and whether delayed post-contrast imaging is performed.
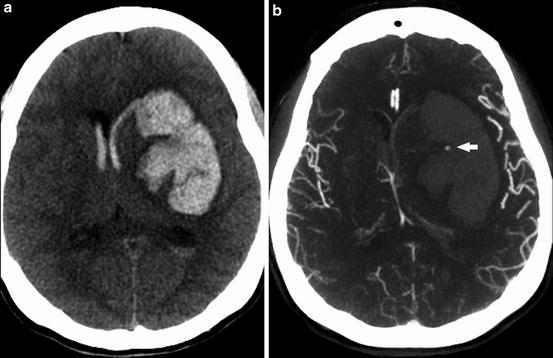
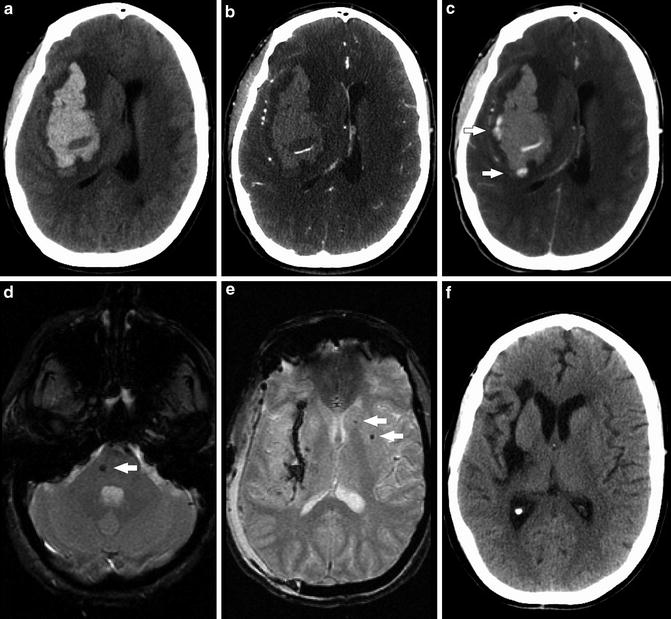
Fig. 4
(a) Unenhanced CT shows large acute hemorrhage centered in the left basal ganglia with associated rightward mass effect, subfalcine herniation, and intraventricular extension of hemorrhage. (b) MIP images from subsequently obtained CTA demonstrate the “spot sign” (arrow) – a focal blush of contrast extravasation centered within the basal ganglia hemorrhage
Fig. 5
Series of images obtained from a 41-year-old woman presenting with acute hypertensive hemorrhage (SBP >220 mmHg). (a) Unenhanced CT shows large acute hemorrhage centered in the right basal ganglia with associated mass effect, including rightward midline shift and subfalcine herniation (Source images from CTA) (b), and delayed post-contrast CT (c) demonstrate contrast pooling within the area of hemorrhage (arrows) consistent with active extravasation. (d) and (e): T2* GRE images status post-craniectomy demonstrate punctate foci of susceptibility in the right pons and left caudate and putamen consistent with additional microhemorrhages that were occult on initial unenhanced CT. Blood products line the site of the evacuated hematoma, in the region of the external capsule and putamen. (f) Unenhanced head CT performed 12 months after craniectomy shows expected evolution of the surgical bed, with volume loss and hypodensity in the right frontal lobe, subinsular region, as well as sites of initial hemorrhage in the putamen and external capsule
Factors associated with poor prognosis in patients with acute intracranial hemorrhage include age greater than 80 years, posterior fossa location of hemorrhage, volume of hemorrhage exceeding 30 mL, and intraventricular extension of hemorrhage [5]. It is imperative to be aware of, and actively search for, the potential secondary effects of acute hypertensive hemorrhage including acute hydrocephalus, herniation syndromes, and infarction. Many supratentorial hematomas can be managed medically; however, hematomas in the posterior fossa require close monitoring, often necessitating timely neurosurgical decompression, given the potential for rapid expansion of the hematoma and surrounding edema within the compact confines of the posterior fossa. There is limited ability of the posterior fossa structures to enlarge without clinically significant, often catastrophic, complications. Supratentorial herniation, cerebellar tonsillar herniation, and obliteration of the fourth ventricle with resultant obstructive hydrocephalus can develop in an impressively rapid fashion.
Hypertensive hemorrhages tend to dissect along the white matter tracts, so that the damage to the brain tissue and associated neurologic damage incurred by hypertensive hemorrhages are often much less than the injury related to traumatic hemorrhagic contusions. These patients will have a relatively good prognosis if they have not experienced any of the above-described severe secondary effects associated with the hematoma.
Evolution of Hematoma on CT and MRI
On unenhanced CT, the increased attenuation on CT (HU 50–60) within an acute hematoma is not due to iron content, but rather it is due to clot retraction and the presence of dense protein content within the hematoma (e.g., fibrin, cells, platelets) [6]. The attenuation of the hematoma may increase in the first few days after presentation (up to 80–100 HU) depending on the degree of organization of the clot. After the first few days, an acute hemorrhage evolves in a relatively predictable fashion on unenhanced CT related to its hydration. As the hematoma evolves, it begins to draw in water, resulting in the margins of the hematoma beginning to decrease in attenuation. As water is further drawn into the hematoma, there is continued expected reduced attenuation within the hematoma itself on the basis of increased water content. On average, one can expect the attenuation within the hematoma to decrease by approximately 1.5 HU per day. An element of inflammation is present at the margins of the hematoma as it begins to resorb, leading to breakdown of the blood–brain barrier. As such, a peripheral rim of contrast enhancement can be seen starting approximately 1 week after the initial hemorrhage, which can persist for up to 8–12 weeks (Fig. 6).
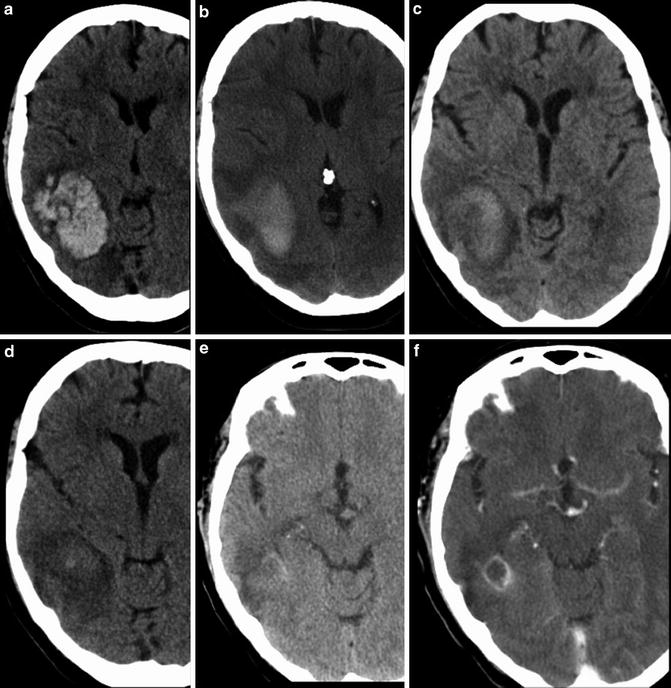
Fig. 6
Series of unenhanced head CT examinations demonstrating evolution of an intraparenchymal hematoma. (a) Initial head CT demonstrates large acute hematoma centered in the right temporoparietal region. Subsequent head CT examinations performed (b) 11 days, (c) 23 days, and (d) 29 days later demonstrate expected reduction in attenuation within the hematoma on sequential images related to increased water content. Pre- and post-contrast head CT (e) and (f) performed 84 days after the initial hemorrhage demonstrate a small amount of residual enhancement at the margins of the hematoma
MR imaging is even better suited to demonstrate the evolution of hematoma based on the signal characteristics of various stages of breakdown blood products and the anticipated time points at which they appear and transform (Table 3, Fig. 7) [7, 8]. Hyperacute hematoma (<6 h) is predominantly composed of oxyhemoglobin, demonstrating T1 isointense and T2 mildly hyperintense signal. Within an acute hematoma in slightly later evolution (7 h–3 days), the blood products become deoxygenated and there is conversion of oxyhemoglobin to deoxyhemoglobin, resulting in hematoma demonstrating T1 isointense-to-hypointense signal and T2 markedly hypointense signal. In the early subacute stage, as the blood products continue to degrade from deoxyhemoglobin to methemoglobin and the red blood cell remains intact, the hematoma predominantly demonstrates characteristic signal of intracellular methemoglobin, with T1 marked hypointensity and T2 marked hyperintensity. In the late subacute stage, after the red blood cells have lysed, characteristic signal of extracellular methemoglobin is seen, with T1 and T2 marked hyperintensity. In the chronic state, there is further degradation of blood products and subsequent uptake by macrophages resulting in deposition of hemosiderin and ferritin within the hematoma cavity, with marked T1 and T2 hypointensity.
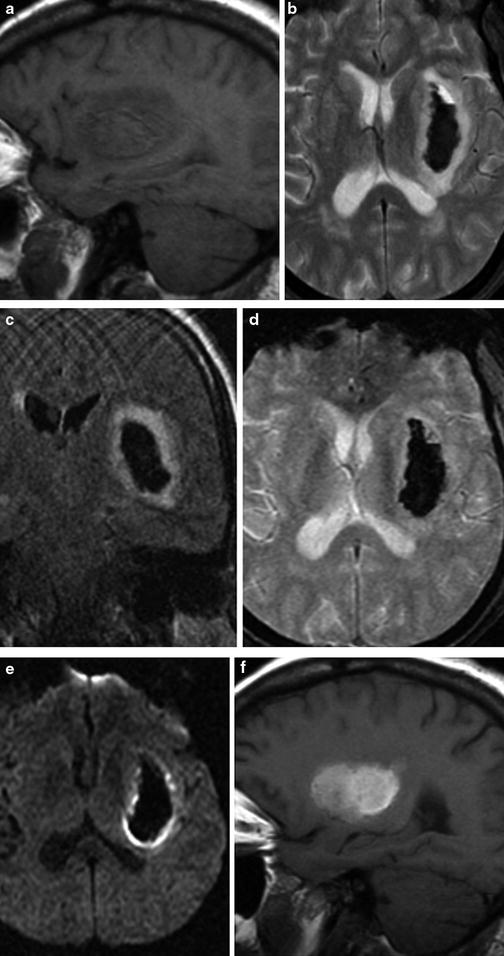
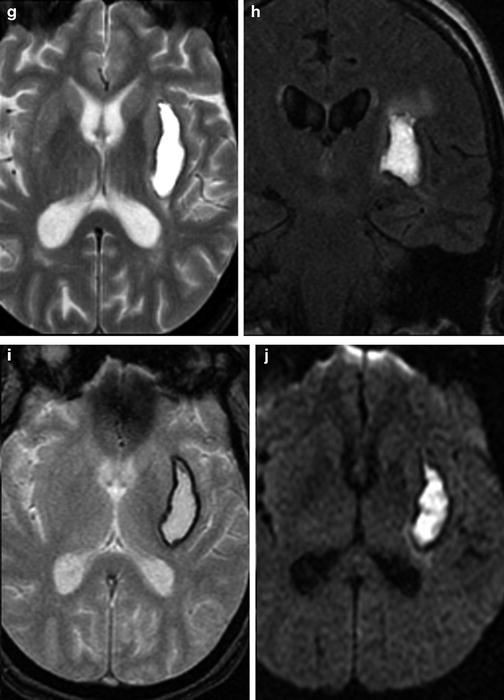
Table 3
Evolution of intracerebral hematoma on MR
Stage | Predominant blood product | Time course | T1 signal | T2 signal | Mass effect |
|---|---|---|---|---|---|
Hyperacute | Oxyhemoglobin | <6 h | Isointense | Mildly hyperintense | +++ |
Acute | Deoxyhemoglobin | 6–72 h | Iso- to hypointense | Hypointense | +++ |
Early subacute | Intracellular methemoglobin | <3 days to 1 week | Hyperintense | Hypointense | +++/++ |
Late subacute | Extracellular methemoglobin | 1–2 weeks to months | Hyperintense | Hyperintense | +/− |
Chronic | Hemosiderin | 2 weeks to years | Hypointense | Hypointense | − |
Fig. 7
Evolution of hematoma on MRI. Multiplanar, multisequence MR imaging demonstrates a typical left basal ganglia hypertensive hemorrhage. Top row: Demonstration of late acute stage hematoma (1–2 days after hemorrhage). (a) Sagittal T1, (b) axial T2, (c) coronal T2 FLAIR, (d) axial T2* GRE, (e) and axial DWI sequences. Several days out, expected signal changes associated with deoxyhemoglobin are seen, with mildly T1 hypointense and marked T2 hypointense signal; the T2-WI also shows expected edema surrounding the hematoma in the region of the left basal ganglia. Bottom row: Demonstration of late subacute stage hematoma (2–4 weeks after hemorrhage). (f) Sagittal T1, (g) axial T2, (h) coronal T2 FLAIR, (i) axial T2* GRE, and (j) axial DWI sequences. As the hematoma continues to evolve over the course of several weeks, the contents of the hematoma are mostly extracellular methemoglobin, demonstrating hyperintense signal on both T1- and T2-WI images
Hematomas often contain blood products at different stages of evolution, resulting in a mixture of these imaging features, complicating image interpretation, and sometimes establishing chronicity of hemorrhage is difficult. The timing of evolution of blood products detailed above is most reliable for intraparenchymal hemorrhage. Extra-axial hemorrhage tends to progress in a similar order, but in a more delayed fashion, likely on the basis of lower oxygen tension. Additionally, subarachnoid and intraventricular hemorrhage signal will be affected by mixing with CSF. Finally, it is possible that on occasion an acute hematoma may be confused with infarction. The core of an acute hematoma may be hyperintense on DWI (representing “T2 shine through”) with decreased ADC values (representing “T2 dark through”), mimicking arterial stroke [9]. However, correlation with other sequences and/or CT should be helpful to avoid this potential pitfall.
Coagulopathy
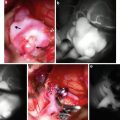
Spontaneous intracranial hemorrhage related tocoagulopathy, whether on the basis of hematologic disease, metabolic disease, or therapeutic anticoagulation, is an entity that must be suspected in the appropriate clinical context and is one that may demonstrate potential clues to its diagnosis on imaging. Similar to patients with low hematocrit, blood products within a hematoma in the setting of coagulopathy may be isodense to brain parenchyma on CT imaging. Identification of a fluid–fluid level within the hematoma on CT is a characteristic finding of intracranial hematomas in this patient population (Figs. 8 and 9). These fluid–fluid levels can persist for several hours after the hemorrhage. Similarly, on MR imaging, heterogeneous signal within the hematoma cavity with identifiable fluid–fluid levels can suggest underlying coagulopathy. Peri-hematoma edema is a nonspecific finding, but could identify potential brain tissue that is at risk due to compression, increased permeability, and inflammation related to the hematoma (Fig. 10).
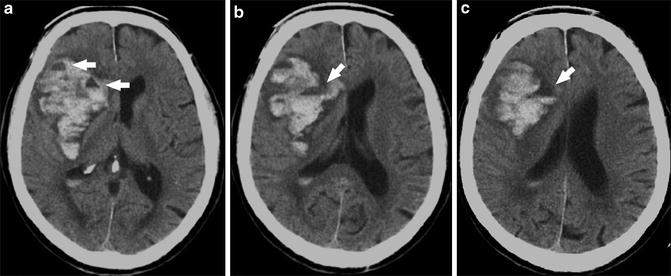
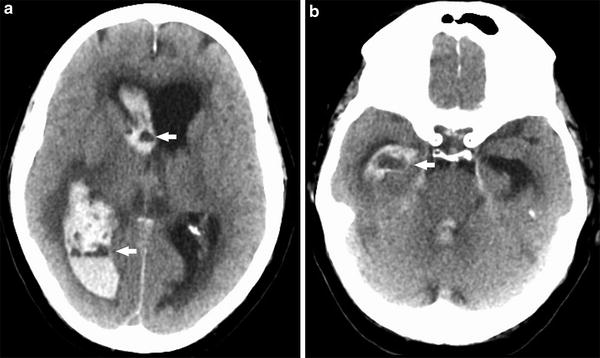
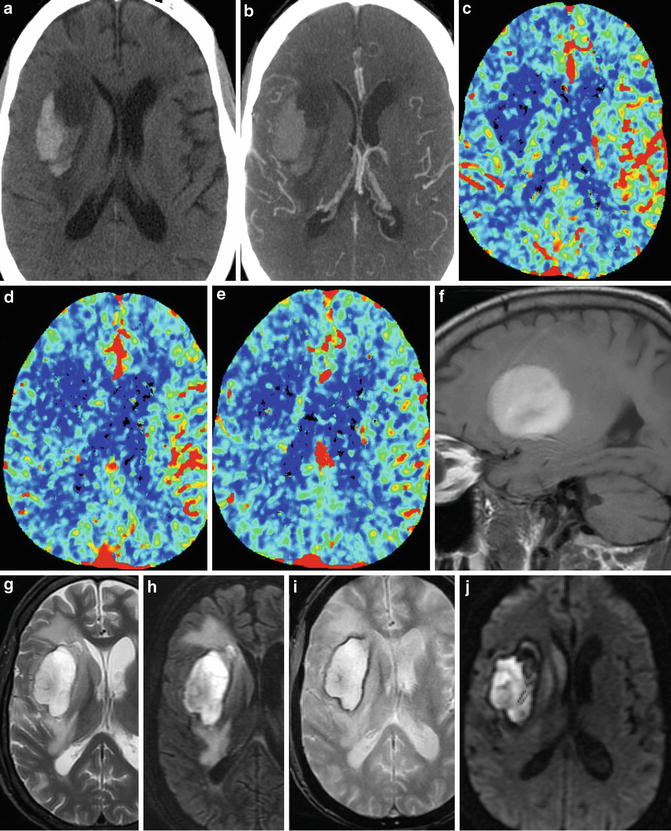
Fig. 8
Coagulopathic hemorrhage. Series of unenhanced head CT images from inferior to superior (a–c) demonstrate a large right basal ganglia hemorrhage. Note fluid–fluid levels (arrows), characteristic of intracranial hemorrhage in the setting of coagulopathy
Fig. 9
Coagulopathic hemorrhage. Two unenhanced head CT images demonstrate a large amount of intraventricular hemorrhage and resulting obstructive hydrocephalus, with heterogeneous attenuation and fluid levels (arrows) involving the right lateral, third, and fourth ventricles
Fig. 10
Coagulopathic hemorrhage. (a) Unenhanced head CT demonstrates large right basal ganglia hemorrhage with fluid–fluid levels, characteristic of hemorrhage in the setting of coagulopathy. (b) Axial maximum intensity projection image from the concurrently performed CTA demonstrates displaced MCA branches. (c–e) Cerebral blood flow maps performed part of the CTA exam demonstrate reduced CBF within and surrounding the area of hemorrhage. Sagittal T1 (f) and axial T2 (g) images demonstrate heterogeneous hyperintense signal within the hemorrhage. (h) T2 FLAIR imaging best demonstrates degree of vasogenic edema surrounding the hematoma. DWI (i) and ADC (j) demonstrate a large component of “T2 shine-through” in the core of the hematoma, but also true diffusion restriction at the anterior and medial portion of the hematoma
Cerebral Amyloid Angiopathy
Beta amyloid deposition within the small- and small-to-medium-sized arteries of the cortex and leptomeninges is the pathologic hallmark of cerebral amyloid angiopathy (CAA) [10]. Beta amyloid deposition at these sites increases with age, accounting for the estimated 20 % of spontaneous intracranial hemorrhage in the elderly. This entity is rare before age 60, but is a common cause of spontaneous intracranial hemorrhage in the elderly population, second only to hypertension. CAA can present as lobar macrohemorrhage or as multiple microhemorrhages, often recurrent (Fig. 11). The hemorrhage associated with CAA is often lobar or cortical or combined cortical/subcortical in location [11]. Pathologically, beta amyloid deposition is identified within the brain, perivascular spaces, and outer walls of arterioles and leptomeningeal vessels leading to fibrinoid degeneration and necrosis leading to vascular fragility, accounting for the association with hemorrhages. Microaneurysms have also been described as resulting from this degenerative process, likely also contributing to hemorrhage. Finally, vessel lumen obliteration may result, leading to microvascular ischemia. Characteristically, these microhemorrhages are most conspicuous as foci of low signal on T2* GRE and SWI sequences [12]. Leptomeningeal amyloid angiopathy can initially present as acute blood layering within the subarachnoid space. Superficial siderosis, characterized by diffuse low signal and blooming on susceptibility-weighted images along the pial surfaces of the brain and within the basilar cisterns, can be seen on follow-up imaging, thought to be related to recurrent subarachnoid hemorrhage (Fig. 12) [13].
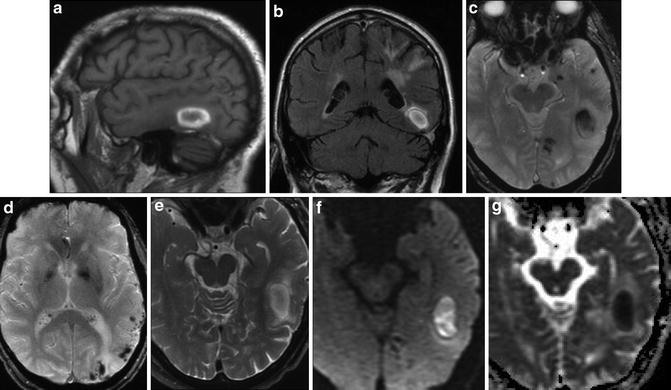
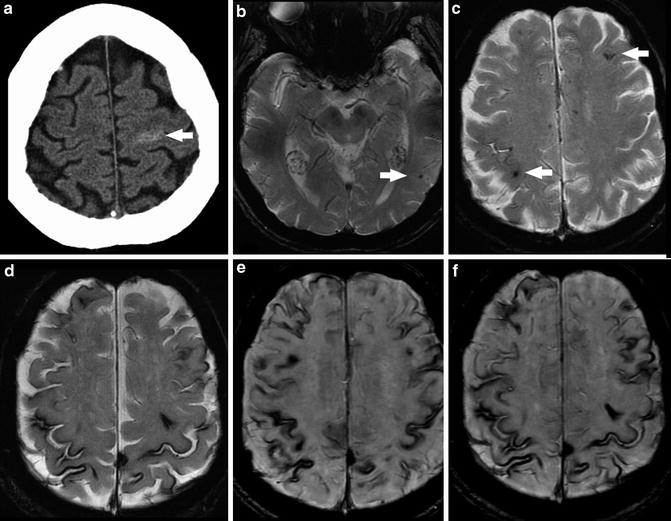
Fig. 11
Lobar hemorrhage and microhemorrhages in CAA. (a) Sagittal T1 image demonstrates right temporal lobar hemorrhage with peripheral hyperintensity related to methemoglobin formation. (b) Coronal T2 FLAIR image demonstrates peripheral hyperintense rim of the lobar hemorrhage and minimal surrounding edema. Periventricular and subcortical white matter signal abnormalities are also seen. (c) Axial T2* image demonstrates hypointense signal in the lobar hemorrhage but also reveals punctate hypointense foci representing microbleeds in the subcortical left temporal lobe, left parahippocampal region, and left occipital lobe. (d) Axial T2* image at a more superior location demonstrates additional microbleeds in the left temporal and occipital cortices and subcortical white matter. (e) Axial T2 image demonstrates peripheral hyperintense rim of the lobar hemorrhage. (f) Axial DWI demonstrates hyperintense signal throughout the hematoma. (g) ADC map demonstrates hypointense signal throughout the hematoma on the basis of “T2 dark through,” mimicking an acute infarct
Fig. 12
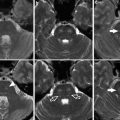
Superficial siderosis due to recurrent subarachnoid hemorrhage in a patient with leptomeningeal amyloid angiopathy (top row, imaging at presentation; bottom row, follow-up imaging 7 years later). (a) Unenhanced head CT at presentation demonstrates subarachnoid hemorrhage layering within the sulci of the left frontal lobe. (b) Axial T2* GRE image at the level of the midbrain demonstrates punctate foci of susceptibility along the pial surface of the right temporal and occipital lobes (arrows) representing subarachnoid hemorrhage. (c) Axial T2* GRE image shows punctate foci of susceptibility along the pial surface of the left frontal and right parietal lobes (arrows) representing additional subarachnoid hemorrhage. (d) Axial T2* GRE image obtained 7 months later demonstrates diffuse hemosiderin staining of the pial surface of the brain bilaterally, representing superficial siderosis. (e) Axial SWI image obtained at the same time of d demonstrates the increased sensitivity of this sequence for hemorrhage. (f) Axial SWI image more cephalad than e again shows superficial siderosis to better advantage compared to routine T2* GRE imaging
The Boston criteria were established in 1990 in order to standardize the diagnosis of CAA, using clinical, imaging, and/or pathologic parameters (Table 4). Definite cerebral amyloid angiopathy can be diagnosed only postmortem, while probable CAA is defined in a patient older than 55 years, in the setting of appropriate clinical history, with MRI findings of multiple microhemorrhages and lobar hemorrhage or convexity subarachnoid hemorrhage without any other explanation.
Table 4
Boston criteria for diagnosis of cerebral amyloid angiopathy (CAA)
Diagnostic category | Criteria |
|---|---|
Definite CAA | Postmortem examination: Lobar, cortical, or cortical/subcortical hemorrhage Evidence of severe CAA vasculopathy |
Probable CAA with pathologic evidence | Supportive clinical history Pathologic specimen: lobar, cortical, or cortical/subcortical hemorrhage |
Probable CAA | Supportive clinical history Age ≥55 MRI evidence of multiple lobar, cortical, or cortical/subcortical hemorrhages without other explanation |
Possible CAA | Supportive clinical history Age ≥55 MRI evidence of a single lobar, cortical, or cortical/subcortical hemorrhage without other explanation |
CAA coexists with Alzheimer dementia and other dementias in 20–30 % of patients (Fig. 13). Symptoms of dementia may be due to leukoaraiosis resulting from progressive microvascular ischemia. Unfortunately, as discussed above, advanced hypertensive arteriopathy can similarly present as multiple small areas of hemorrhage, so there can be substantial overlap between the imaging appearance of CAA and advanced hypertensive changes [14]. These two entities account for the majority of cerebral microhemorrhages detected at imaging. However, the differential diagnosis of multiple microhemorrhages includes hemorrhagic metastatic disease, vasculitis, diffuse axonal injury (DAI), cerebral embolism (including fat emboli), multiple cavernomas, radiation-induced vasculopathy, cerebral autosomal dominant arteriopathy with subcortical infarcts and leukoencephalopathy (CADASIL), and Parry–Romberg syndrome (Figs. 14 and 15).
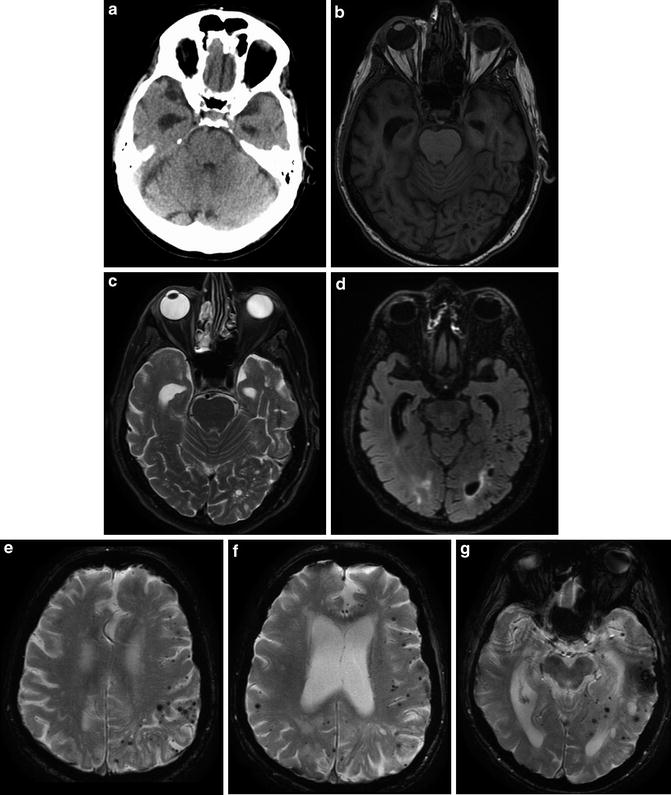
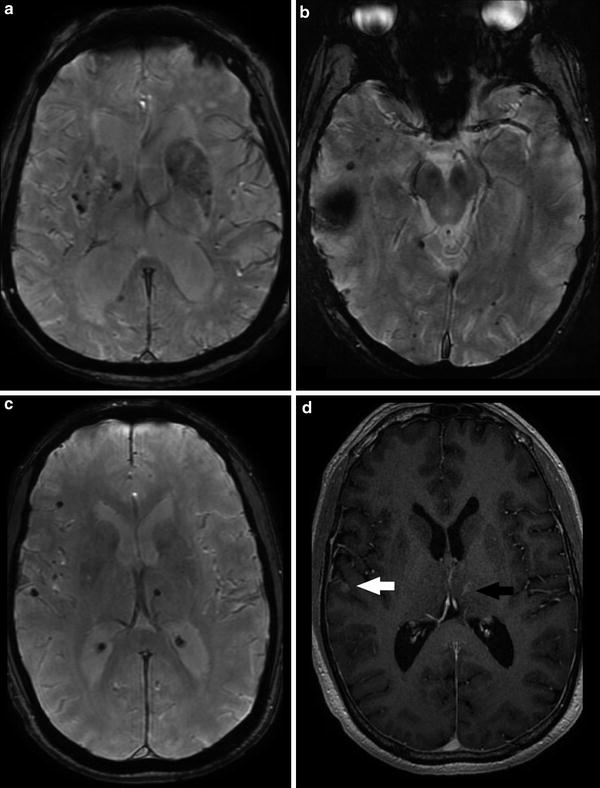
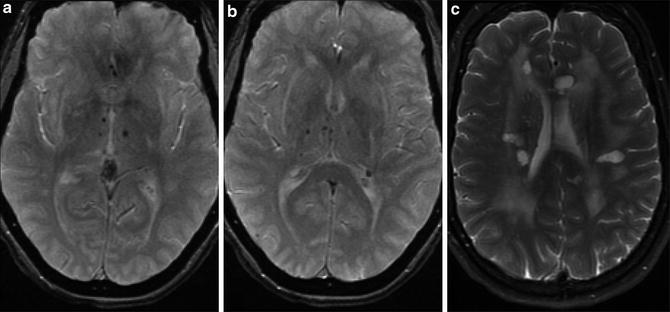
Fig. 13
A 77-year-old male with rapidly progressive dementia, diagnosed with Alzheimer dementia 2 years prior to this imaging. Unenhanced head CT (a) and T1 (b), T2 (c), and T2 FLAIR (d) MR images demonstrate the classic appearance of dilated temporal horns of the lateral ventricles due to hippocampal and medial temporal lobe atrophy characteristically seen in Alzheimer-type dementia. Multiple axial T2* GRE images (e–g) demonstrate innumerable foci of signal loss consistent with microhemorrhages, most pronounced in the left parietal lobe, in a cortical–subcortical distribution typical of CAA. Hippocampal and temporal lobe volume loss, seen to better advantage on the previous figure, again is compatible with Alzheimer dementia
Fig. 14
Differential diagnosis of multiple bilateral microhemorrhages. (a) Axial T2* GRE image demonstrates punctate microhemorrhages in bilateral basal ganglia in a patient with hypertensive arteriopathy. (b) Axial T2* GRE image demonstrates multiple punctate foci of susceptibility bilaterally at cortical and cortical–subcortical junction locations as well as a larger focus in the right temporal lobe. Findings favored to represent radiation-induced telangiectasias and a cavernoma, respectively. (c) Axial T2* GRE image demonstrates microhemorrhages in the subcortical white matter of the right frontal and temporal lobes as well as the left thalamus in a patient with metastatic melanoma. (d) Axial post-contrast T1-WI (same patient as c) demonstrates enhancement of the right temporal (white arrow) and left thalamic (black arrow) lesions
Fig. 15
Patient with cerebral autosomal dominant arteriopathy with subcortical infarcts and leukoencephalopathy (CADASIL). (a) Axial T2* GRE image demonstrates microhemorrhages in bilateral thalami in a patient with CADASIL. (b) Axial T2* GRE image at a slightly higher location again shows the thalamic microhemorrhages. (c) Axial T2-WI in the same patient shows multiple hyperintense lesions in the periventricular white matter bilaterally superimposed on diffuse confluent deep white matter signal abnormality
Inflammatory CAA is a condition which is thought to represent an autoimmune response to the deposited beta amyloid. The imaging manifestation of inflammatory CAA is distinct from those of multiple microhemorrhages classically associated with CAA. Inflammatory CAA may manifest as extensive white matter edema, perivascular inflammation, and vasculitis (Fig. 16). The imaging appearance of inflammatory CAA may very closely mimic acute hypertensive encephalopathy/posterior reversible encephalopathy syndrome (PRES).
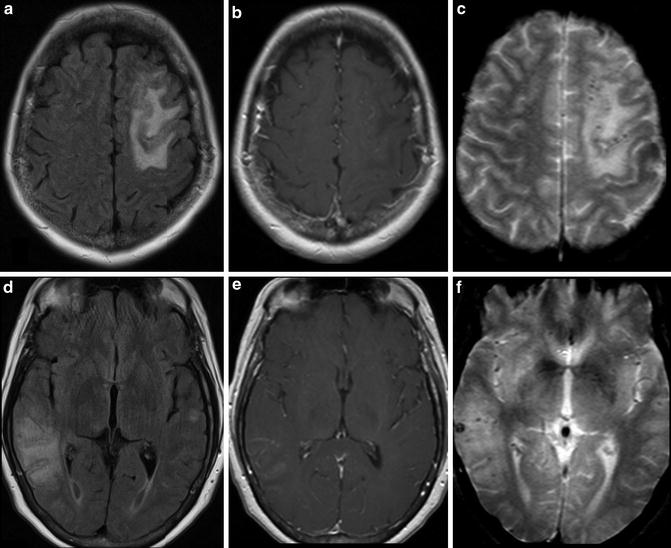
Fig. 16
Inflammatory cerebral amyloid angiopathy. (a) Axial T2 FLAIR image demonstrates hyperintense signal in the subcortical white matter of the left frontal lobe. (b) Axial T2 FLAIR image a more inferior level in the same patient demonstrates subcortical white matter signal abnormality in the right temporo-occipital region. (c) Axial post-contrast T1-WI at the same level of a demonstrates non-enhancing hypointense signal corresponding to the FLAIR abnormality in the right frontal lobe. Abnormal leptomeningeal enhancement is present surrounding the signal abnormality. (d) Axial post-contrast T1-WI at the same level of b demonstrates non-enhancing hypointense signal corresponding to the T2 FLAIR abnormality in the left temporal and occipital lobes. Abnormal leptomeningeal enhancement is present surrounding the signal abnormality. (e) T2* GRE image at a similar level to a and c demonstrates punctate foci in the cortex and juxtacortical locations in the left frontal lobe representing microhemorrhages. (f) T2* GRE image at a similar level to b and d demonstrates punctate foci in the cortex and juxtacortical locations in the right temporal and parietal lobes representing additional microhemorrhages
T2* Gradient Echo Imaging
GRE T2* images are significantly more sensitive to both hyperacute hemorrhage and microhemorrhages compared to conventional spin echo T1- and T2-WI sequences. Susceptibility-weighted T2* images can be of benefit in further characterizing intracranial hemorrhage/hematoma. Gradient echo T2* acquisitions do not have a refocusing radiofrequency pulse and are thus very susceptible to static variations in the magnetic field, such as that produced by the paramagnetic properties of hemosiderin [15]. This local field inhomogeneity presents as loss of signal on T2* images. While T2* images do not have a high contrast resolution and image clarity of other pulse sequences, they are highly sensitive to blood products (Fig. 17).
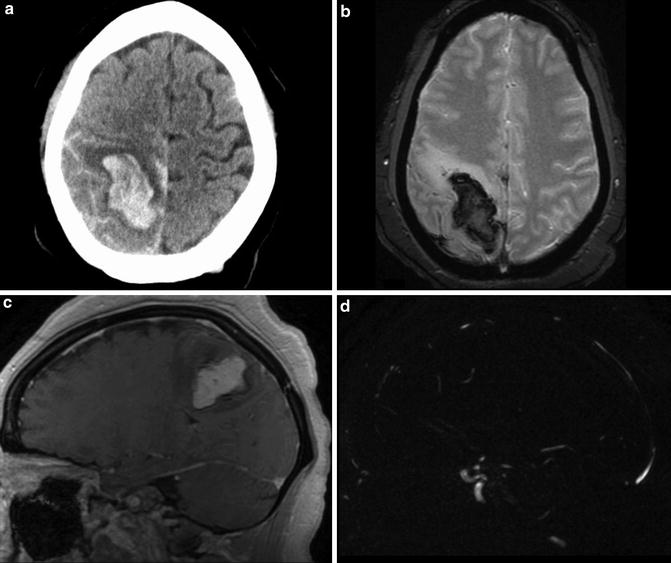
Fig. 17
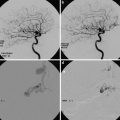
Intraparenchymal hemorrhage of unknown etiology in a 24-year-old woman. (a) Initial unenhanced head CT demonstrates large parenchymal hemorrhage centered in the right parietal lobe. Subarachnoid hemorrhage layers along the sulci of the right parietal and left frontal lobes. (b) T2* MR image demonstrates susceptibility-related signal loss within the hematoma. (c–d) Subtracted three-dimensional phase-contrast MR angiography demonstrates excellent subtraction of the hyperintense hematoma present on the MR images
One pitfall in using MR to evaluate hematomas is related to the signal intensity seen on diffusion-weighted images. The core of an acute hematoma can be hyperintense on DWI with decreased ADC values, simulating an area of infarction.
Susceptibility-Weighted Imaging (SWI)
A more advanced imaging method, which enables increased sensitivity to the detection of microhemorrhages superior to even that of T2* GRE (Fig. 18), is susceptibility-weighted imaging (SWI) and susceptibility-weighted angiography (SWAN) [16]. The basis of SWI is a high-resolution, flow-compensated, three-dimensional gradient echo sequence [17–19]. SWI combines magnitude images and phase shift information related to T2* dephasing to exploit field inhomogeneity to increase the ability to detect foci of susceptibility (e.g., cortical veins, calcification, hemosiderin). Variations in the local magnetic field result in dephasing of signal and reduction of T2*. Nonheme-related iron can be detected and may be useful for the detection and surveillance of diseases that result in iron deposition in the brain, such as Parkinson, Huntington, and Alzheimer dementias. SWI performance and sensitivity are positively related to field strength.
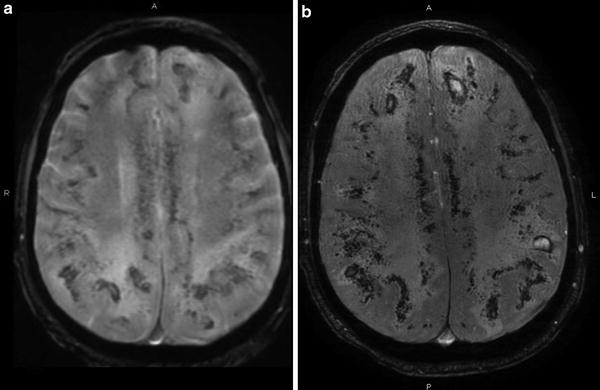
Fig. 18
Comparison of T2* and SWI. (a) Axial T2* GRE image demonstrates extensive multiple small hemorrhages related to disseminated aspergillosis. (b) Axial SWAN image in the same patient shows the increased conspicuity of this sequence for microbleeds
Using postprocessing techniques, following application of a high-pass filter to reduce aliasing, a phase mask is applied to the magnitude images to increase the conspicuity of foci of susceptibility. For paramagnetic substances, the increase in magnetic field leads to a negative phase (right-handed system) relative to the surrounding parenchyma and CSF. At the workstation, the separately acquired phase shift information and the magnitude images combined into a single image can be displayed using minimum intensity projections (MinIP) for ease of interpretation. The MinIPs are useful in confirming the vascular nature of tortuous foci of susceptibility by demonstrating contiguity with other vascular structures. SWI has been reported to provide twofold to fivefold increased sensitivity for the detection of microbleeds versus routine MPGR T2* sequences.
An important clinical use of SWI is distinguishing diamagnetic materials (e.g., calcium) from paramagnetic materials (e.g., hemosiderin) [20]. Calcium and hemosiderin may both present as increased attenuation on unenhanced CT images and as foci of signal hypointensity and blooming on conventional gradient echo T2*WI images. Diamagnetic materials such as calcium appear as high signal on phase images, allowing distinction from paramagnetic hemosiderin.
Nontraumatic Subarachnoid Hemorrhage
Nontraumatic subarachnoid hemorrhage (SAH) is commonly due to three etiologies: arterial aneurysm rupture, extension of intraparenchymal hemorrhage into the subarachnoid space, or perimesencephalic SAH (likely venous). Aneurysmal SAH represents the vast majority (>85 %) of nontraumatic SAH. Intracranial aneurysms occur in approximately 2 % of the asymptomatic population. In order of descending frequency, the most common sites of intracranial aneurysms are the anterior communicating artery (AComm) (30 %), the posterior communicating artery (PComm) (25 %), the middle cerebral artery (MCA) bifurcation/trifurcation (20 %), the internal carotid artery (ICA) bifurcation/terminus (7.5 %), basilar tip (7 %), pericallosal arteries (4 %), and the posterior inferior cerebellar artery (3 %). Additional miscellaneous aneurysm locations account for approximately 3.5 % of aneurysms (Table 5). While this chapter aims specifically to review the etiologies of nontraumatic SAH, both the radiologist and the clinical service should be alert to the clinical scenario of ruptured aneurysm and its concomitant subsequent neurologic deficit leading to the initial traumatic event. Thus, if the source of trauma is not clear, further evaluation with dedicated vascular imaging should be considered, as detailed below.
Table 5
Frequency of intracranial aneurysm by location
Location | Frequency (%) |
|---|---|
AComm | 30 |
PComm | 25 |
MCA bifurcation/trifurcation | 20 |
ICA bifurcation/terminus | 7.5 |
Basilar artery tip | 7 |
Pericallosal arteries | 4 |
Posterior inferior cerebellar artery | 3 |
Others | 3.5 |
For reasons described in the introduction, unenhanced CT is often the modality selected to evaluate for SAH. On non-contrast-enhanced head CT, the hallmark of SAH is the identification of hyperdense hemorrhage within the basal cisterns, interstices of the sulci, and the interhemispheric fissure. Of note, aneurysmal rupture may also result in intraparenchymal hemorrhage in up to one-third of cases. Rare intraparenchymal hemorrhage without associated SAH has also been described in relation to aneurysm rupture. The aneurysm itself may occasionally be visible on non-contrast-enhanced CT as a hyperdense round or lobular structure, a filling defect surrounded by SAH in a basilar cistern or fissure, and/or by mural calcifications, if the aneurysm is long standing. Classification systems (Fig. 19, Tables 6 and 7) can be used to describe both the imaging findings (Fisher grading scale) and the clinical presentation (Hunt and Hess).
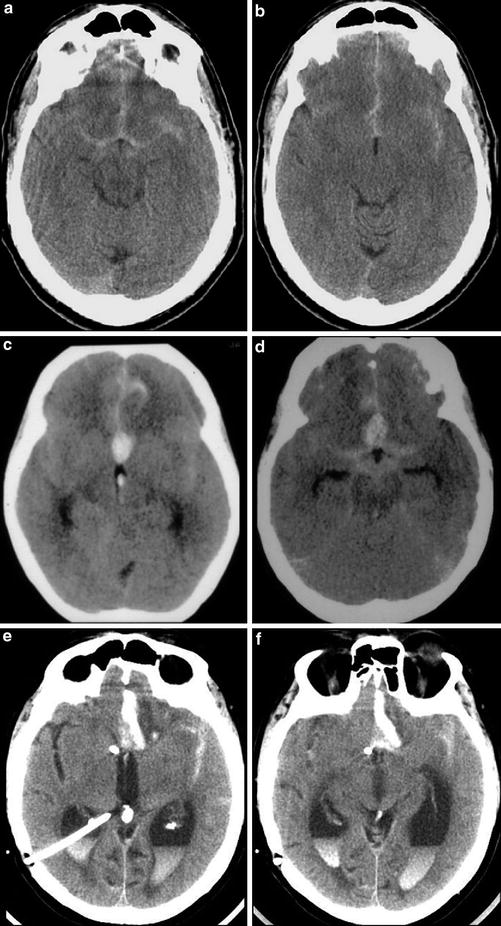
Fig. 19
Series of unenhanced head CT examinations with subarachnoid hemorrhage of varying degrees of severity demonstrating Fisher grades 2–4. (a–b) Fisher grade 1. Thin subarachnoid hemorrhage layers within the suprasellar cistern, anterior interhemispheric fissure, and the Sylvian fissures. (c–d) In a different patient, a similar pattern of subarachnoid hemorrhage in the basilar cisterns is seen, but the presence of a focal clot in the interhemispheric fissure upgrades this case to Fisher grade 2. (e–f) The presence of intraventricular hemorrhage (causing obstructive hydrocephalus, in this case) results in this case being classified as Fisher grade 4. Note the presence of right posterior approach ventriculostomy catheter placed to decompress the dilated lateral ventricles
Table 6
Fisher grading scale for subarachnoid hemorrhage (SAH)
Grade | CT findings |
|---|---|
1 | No subarachnoid hemorrhage |
2 | Diffuse blood Clot <3 mm Thin layer <1 mm |
3 | Clot >3 mm Thick layer >1 mm |
4 | Intraventricular hemorrhage |
Table 7
Hunt and Hess grading scale for subarachnoid hemorrhage (SAH)
Grade | Clinical findings |
|---|---|
1 | Asymptomatic or minimal headache and slight nuchal rigidity |
2 | Moderate-to-severe headache, nuchal rigidity, and no neurologic deficit other than cranial nerve palsy |
3 | Drowsiness, confusion, of mild focal deficit |
4 | Stupor, moderate-to-severe hemiparesis, and, possibly, early decerebrate rigidity and vegetative disturbances |
5 | Deep coma, decerebrate rigidity, moribund appearance |
Although CT is very sensitive for the detection of SAH, if only a small amount of blood is present in the subarachnoid space, it may be difficult to detect with CT. Additionally, the sensitivity of unenhanced CT for SAH decreases as time since symptom onset increases, related to both evolution of blood products and dilution of blood within the CSF. Using MR imaging, fluid attenuation inversion recovery (T2 FLAIR) sequences are a very sensitive method for detecting SAH [21]. However, while FLAIR imaging can be utilized to detect very small amounts of blood in the subarachnoid space in both the acute and subacute setting, it is not very specific. Potential etiologies for hyperintense signal in the subarachnoid space on FLAIR imaging other than SAH include increased protein content within the subarachnoid space (e.g., meningitis), retained circulating gadolinium-based contrast material from a prior contrast-enhanced scan in a patient with renal failure, high oxygen tension (e.g., patients on or near 100 % supplemental oxygen), and intubated or sedated patients receiving propofol. Metal artifact (e.g., braces, ventriculostomy shunt catheter hardware) can interfere with the inversion pulse applied during the FLAIR sequence, resulting in incomplete nulling of the cerebrospinal fluid. Furthermore, if using two-dimensional image acquisition, inflow enhancement of the CSF within the subarachnoid space can also have a similar appearance; this effect is eliminated with use of a 3D acquisition technique. Finally, incomplete nulling of CSF signal may give false-positive findings in the subarachnoid space, particularly a problem in the basilar cisterns.
Related posts:
Stay updated, free articles. Join our Telegram channel

Full access? Get Clinical Tree


