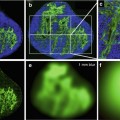
Fig. 9.1
Early whole-brain tomographic FDG images of brain function in a normal volunteer reveal high concentration of the agent in cortical and subcortical grey matter. The brain images were obtained with positron computed tomography (PCT)
9.1.1.2 Fluorine-18 (F-18)
Fluorine-18 (F-18) is a useful positron-emitting radioisotope that has rapidly become the isotope of choice for labelling biomolecules. The F-18 radioisotope is produced using a cyclotron. The most common method used to produce the isotope is using enriched oxygen water target (oxygen-18). In the cyclotron, the hydrogen ions are accelerated and pushed onto a carbon foil and converted to protons. The protons impact the enriched oxygen-18 target which produce the radioisotope [6] and is used to radiolabel biomolecules with high specific activity. With a half-life of 109.8 min, F-18 radiolabelled isotopes such as 18F-FDG are desirable for research and clinical use without the need for an on-site cyclotron facility.
The decay of F-18 is primarily positron emission with an energy of approximately 0.633 MeV [7]. When injected intravenously, the emitted positrons travel a few millimetres in tissue before combining with negatively charged electrons, converting mass into energy and releasing two high-energy (511 keV) photons (gamma rays), which are emitted at approximately 180° to each other (Fig. 9.2). The simultaneous detection of these photons by the PET scanner is then used to construct a three-dimensional image of the sequence of events [7].
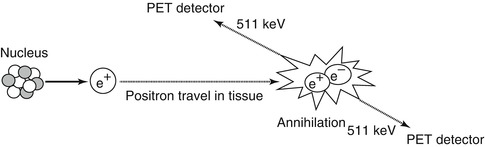
Fig. 9.2
A positron emission tomography scanner is used to detect photons emitted by the annihilation event of an electron and positron. The photons have identical energies (511 keV) and emitted simultaneously at approximately 180° in opposite directions. The near-simultaneous detection by PET of these high-energy photons is known as annihilation coincidence detection
9.1.1.3 2-Deoxy-d-Glucose
2-Deoxy-d-glucose (2-DG) is a glucose molecule which has the 2-hydroxyl group replaced by hydrogen, so that it cannot undergo further glycolysis (Fig. 9.3). Glucose hexokinase traps this substance in most cells (with the exception of the liver and kidney) making it a good marker for tissue glucose consumption and hexokinase activity [8]. This is exploited in oncologic imaging where many cancers have elevated glucose utilisation and upregulated hexokinase levels. 2-DG labelled with carbon-14 has been a popular ligand for laboratory research in animal models, where distribution is assessed by tissue slicing followed by autoradiography [9]. 2-DG has also been used in targeted optical imaging for fluorescent in vivo imaging. In PET, fluorodeoxyglucose is used where one of the two hydrogens of 2-deoxy-d-glucose is replaced with the positron-emitting isotope F-18 (Fig. 9.4) allowing distribution of the tracer to be imaged [10].
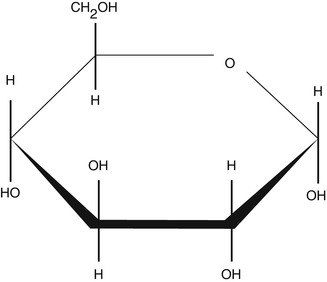
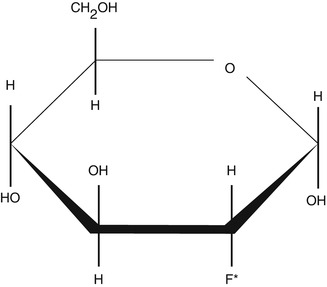
Fig. 9.3
Structure of 2-deoxy-d-glucose (2-dG)
Fig. 9.4
Structure of 2-deoxy-2-fluoro-d-glucose (18F-FDG). The asterisk indicates the location of the hydroxyl group for 2-DG which is replaced by the radioactive isotope fluorine-18 (F-18) to enable detection by PET
9.1.1.4 Positron Emission Tomography
The limited anatomical resolution of PET is overcome by the advent of combined PET and computed tomography (CT) scanners (PET-CT) in a single gantry. This landmark development allows the fusion of functional and precise anatomical information for the first time with a significant improvement in diagnostic confidence and accuracy. As a result, over the past decade, PET-CT has replaced PET-alone systems. The introduction of Time-of-Flight (TOF) technology for PET further improves lesion detection as a result of innovation in scanner detectors (scintillators) and enhanced accuracy in localising the annihilation event (Fig. 9.2). More recently PET combined with magnetic resonance imaging (MRI) (PET-MRI) [11] is also making a transition from a research tool into the clinical domain.
9.1.1.5 FDG Production
The production of FDG is a multistep process that begins with a particle accelerator such as a cyclotron which produces the [F-18] fluoride radionuclide. The most common reaction is through proton irradiation by the 18O(p, n) 18F reaction on a pressurised oxygen-18-enriched water target [12]. After irradiation the radioactive [F-18] fluoride is transferred to a radiopharmaceutical production laboratory or clean room for further transformation into FDG. The [F-18] fluoride is pumped from the cyclotron to a FDG synthesiser unit housed in a lead-shielded hot cell. The hot cell provides an environment of air classification compatible for pharmaceutical manufacturing and to protect the operator from ionising radiation. Several automated chemical manipulations are then carried out leading to a product which is ultimately formulated into a physiological injectable solution. The final product is subjected to either sterilising filtration or steam sterilisation, quality control analysis and quality assurance checks before released for injection into humans [13].
9.1.2 FDG Metabolism in Tumours
FDG is a glucose analogue and, just like glucose, is actively transported into the cell mediated by a group of structurally related glucose transport proteins (GLUT). Once internalised, glucose and FDG are both phosphorylated by hexokinase as the first step towards glycolysis. Glucose continues along the glycolytic pathway for energy production, whereas FDG cannot enter glycolysis (Fig. 9.5) and becomes effectively trapped intracellularly as FDG-6-phosphate and steadily accumulates [14–16].
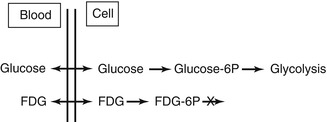
Fig. 9.5
Diagram of FDG metabolism in comparison with glucose. Whereupon glucose undergoes glycolysis to generate energy, FDG phosphorylated by hexokinase enzyme does not undergo further metabolism and is trapped within the cells. This results in increased tracer uptake and retention within metabolically active tissues. Since malignant cells have enhanced glucose metabolism, FDG allows this process to be imaged and mapped by PET
Published by Otto Warburg in 1927, glucose metabolism is enhanced in cancer cells [17] and displays an over-expression of GLUT, particularly GLUT-1 and GLUT-3, as well as higher levels of hexokinase isoforms type I and II [18, 19]. Cancer cells are highly metabolically active and favour the more inefficient anaerobic pathway adding to the already increased glucose demands. The increase in glycolysis has been proposed as a metabolic strategy of tumour cells to ensure survival and growth in environments with low oxygen concentration [16]. Tumour cells also have low levels of the dephosphorylation enzyme glucose-6-phosphatase which catalyses glucose-6-phosphate and FDG-6-phosphate. These combined mechanisms form the basis whereupon tumour cells take up and retain higher levels of FDG when compared to normal tissue.
9.1.3 Normal Physiologic FDG Distribution and Benign Variants
There is high physiologic FDG uptake in the cerebral cortex and basal ganglia of the brain where glucose is the main substrate for metabolism (Fig. 9.6). Normal biodistribution of FDG in other tissues includes mediastinal blood pool activity, liver, spleen and bone marrow with variable uptake in salivary glands, skeletal muscle, and gastrointestinal tract especially the stomach and colon. FDG accumulation in myocardium depends on substrate availability, and in a fasting patient where insulin levels are low, free fatty acid is the predominant substrate and glucose utilisation is usually low. FDG is not reabsorbed by renal tubules, and therefore a high percentage of the administered dose is excreted via the kidneys and bladder [20]. Urinary tracer pooling along the ureters is commonly seen and, in patients who had undergone urinary diversion surgery, may sometimes cause uncertainty in scan interpretation.
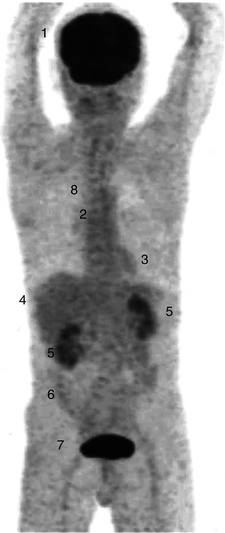
Fig. 9.6
Whole-body FDG PET (maximum intensity projection image) of a patient showing normal biodistribution following injection of 370 MBq of FDG and scanned at 60 min. There is intense FDG accumulation in the cerebral cortex (1) and mild FDG uptake in the bone marrow (2), myocardium (3), liver (4) and in large bowel (6). Tracer excretion is seen in the kidneys (5) and intensely in the bladder (7). There is minimal FDG activity in the lungs (8)
In males, testicular FDG uptake is normally mild to moderate in intensity, symmetric and diffuse in pattern, and the degree of uptake is dependent on age [21]. Physiologic FDG activity in the ovaries can be observed in premenopausal women during ovulation and within corpus luteum cysts [22] and in the uterus at mid-cycle and during the menstrual flow phase [23]. Diffuse FDG uptake can be seen in normal breasts due to proliferative glandular tissue and at the nipples, and high FDG uptake can also be observed in lactating breasts [22].
Normal diffuse homogeneous thymic activity is seen in children with an inverted “V” shape configuration on the coronal views [22]. Increased FDG uptake can be expected at sites of muscle activation (e.g. skeletal muscles following strenuous activity, lingual and mastication muscles from chewing, symmetric vocal cord uptake during phonation).
FDG is not cancer specific and will accumulate in areas with high levels of metabolism and glycolysis. Increased FDG uptake in adipose tissue observed on PET is well recognised, and an inverse relationship between the frequency of FDG uptake in brown adipose tissue (BAT) and the environmental temperature has been demonstrated [24]. BAT regulates thermogenesis and its activation is seen more frequently in winter months. Although BAT can significantly interfere with scan interpretation on PET-alone systems where it can be indistinguishable from uptake within pathological lymphadenopathy (Fig. 9.7), the problem is mitigated with PET-CT with the accurate localisation of tracer uptake to fat tissue on the corresponding CT images. Activated BAT may also account for a less common benign variant of focal increased cardiac FDG accumulation observed in lipomatous hypertrophy of the interatrial septum [25].
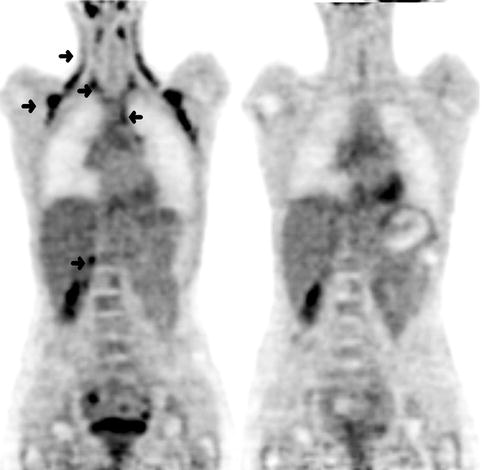
Fig. 9.7
(Left) Coronal FDG PET images of a 27-year-old woman with Hodgkin’s disease and a typical distribution of activated brown adipose tissue (BAT). There was intense FDG uptake in a symmetric pattern in the cervical, supraclavicular, axillary and paraspinal regions, left anterior superior mediastinum and in the right perinephric region (arrows). A repeat scan (Right) 1 week later with oral diazepam as premedication demonstrated resolution of these areas of uptake confirming the presence of activated BAT observed on the initial scan
Prominent diffuse bowel uptake, especially in the large bowel, is commonly seen in patients on metformin therapy [26] (Fig. 9.8). The underlying mechanism is thought to be due to an increase in glucose use by the intestine from upregulation of glucose transporters. Because the use of metformin could potentially mask significant colonic lesions, some investigators have suggested ceasing this medication prior to FDG PET [27]. One study which comprised 138 diabetic patients found that 2 days of discontinuation of metformin was sufficient in reducing high intestinal uptake [28]. Although discontinuation of metformin therapy does reduce intestinal FDG accumulation, this has to be balanced against potential hyperglycemia which could render the PET images suboptimal due to substrate competition between glucose and FDG.
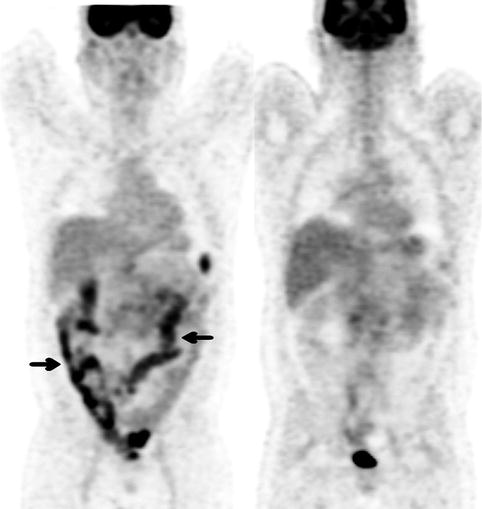
Fig. 9.8
(Left) Coronal FDG PET image of a 43-year-old man with newly diagnosed lymphoma in the abdomen. He has a history of type 2 diabetes on metformin therapy. The scan demonstrated moderate to intense diffuse FDG uptake throughout the bowel most markedly in the colon (arrows). (Right) A repeat PET scan a few days later after withholding metformin for 72 h showed resolution of reactive bowel uptake and better visualisation of the known sites of intra-abdominal lymphoma. There was physiological urinary tracer excretion in the bladder and normal FDG accumulation in the brain, myocardium and liver
There are a large number of benign conditions that can cause false-positive results when interpreting FDG PET oncology scans. Active inflammation and infection can cause positive uptake due to increased FDG accumulation in macrophages and leucocytes [29]. In patients who have recently undergone treatment such as radiotherapy (RT), post-therapy inflammation can be difficult to differentiate from residual malignancy. Intense pleural uptake from talc pleurodesis is frequently seen and may be indistinguishable from superimposed pleural malignancy. In active colitis intense segmental bowel uptake can be observed (Fig. 9.9).
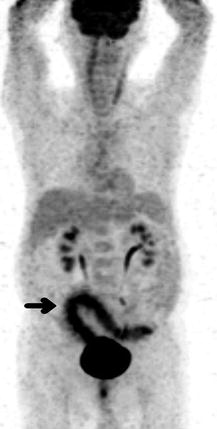
Fig. 9.9
A 77-year-old man underwent FDG PET scan for further investigation of chronic diarrhoea and abdominal pain. Colonoscopy findings were not specific and a gastrointestinal malignancy remained a possible diagnosis. Maximum intensity projection PET image showed intense segmental tracer accumulation along the sigmoid colon and rectum (arrow) with marked mucosal thickening, pericolonic inflammatory changes and mesenteric stranding on CT scan (not shown) consistent with an inflammatory process. On the rest of the PET image, there was prominent linear neck muscle uptake and physiologic tracer excretion in the kidneys, ureters and bladder. There was normal FDG accumulation in the brain, myocardium and liver. At surgery and histopathology, ischaemic colitis secondary to mesenteric panniculitis was found
Reactive focal FDG uptake is often seen at sites of subcutaneous/intramuscular injections (Fig. 9.10), tissue repair from recent surgery, biopsy or acute fractures (Fig. 9.11) [30], and a detailed clinical history from the patient should be recorded. Granulomatous disorders such as tuberculosis and sarcoidosis (Fig. 9.12) as well as chronic inflammatory disorders such as pneumoconiosis are also confounders and not infrequent causes of false-positive PET results. These conditions can lead to increased FDG uptake and mimic malignancy especially within pulmonary hilar and mediastinal lymph nodes and can pose a diagnostic challenge when interpreting PET oncology scans.
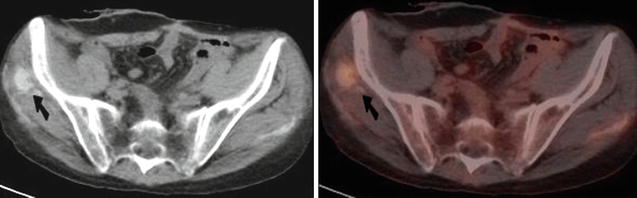
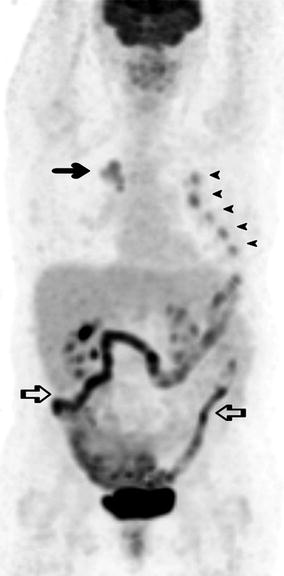
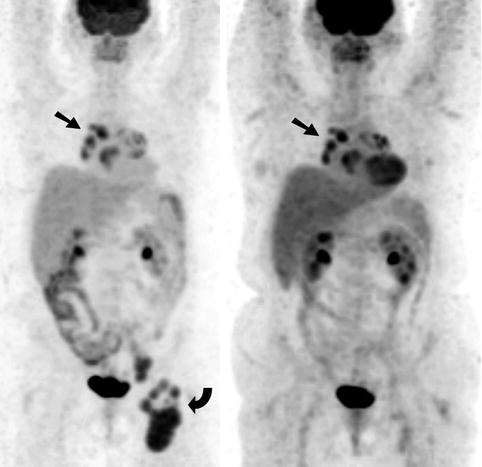
Fig. 9.10
Transaxial CT (Left) and combined FDG PET-CT (Right) of the pelvis. There was focal increased FDG uptake at the site of recent intramuscular iron injection associated with soft tissue calcification in the right gluteus medius muscle (arrows). There was also a linear area of mild uptake on the contralateral side due to a previous injection
Fig. 9.11
A 67-year-old woman presented for a FDG PET scan to further characterise an irregular 37 mm pulmonary mass in the upper lobe of the right lung. On PET the mass demonstrated moderately increased FDG accumulation (arrow) as well as adjacent focal uptake at the right pulmonary hilum consistent with primary lung cancer with ipsilateral hilar lymph node metastasis. There were multiple foci of increased uptake at the left second to sixth ribs anteriorly (arrowheads) in a consecutive pattern, some of which corresponded to callus formation on CT scan (not shown) consistent with rib fractures. Further history from the patient revealed recent trauma from an accidental fall onto her left side. There was also moderate to intense diffuse bowel uptake (open arrows) secondary to metformin therapy
Fig. 9.12
Sarcoidosis as a mimic of malignancy. A 56-year-old woman with newly diagnosed diffuse large B-cell non-Hodgkin’s lymphoma (NHL) underwent a staging FDG PET scan (Left). There was intense FDG uptake within multiple lymph nodes in the left groin (curved arrow) at the sites of biopsy proven NHL, as well as moderate to intense foci at the pulmonary hila and mediastinum bilaterally which were more marked on the right side (arrow). Following completion of chemotherapy, a repeat FDG PET (Right) was undertaken which demonstrated marked metabolic response at the sites of lymphoma in the left groin; however, the uptake in the pulmonary hila and mediastinum was relatively unchanged. There was physiologic FDG accumulation in the brain, oropharynx, myocardium, liver, spleen, kidneys and bladder and along bowel loops. As a result of the difference in metabolic response on PET and in order to exclude refractory lymphoma, a mediastinoscopy and biopsy of the mediastinal lymphadenopathy were arranged. Histology of the right paratracheal lymph nodes revealed granulomatous inflammation consistent with sarcoidosis and no malignancy was found
9.1.4 Standardised Uptake Value
In clinical practice, FDG PET scans are interpreted visually and semi-quantitatively using the standardised uptake value (SUV). SUV is a relatively simple, reproducible and well-established index for quantifying glucose utilisation by measuring the activity of tracer in the lesion or organ corrected for the patient’s weight and dose of FDG injected. Although there are many limitations and factors affecting SUV measurements and hence subject to variability [31–33], several popular indices are used in the clinical setting which includes maximum SUV (SUVmax), mean SUV (SUVmean) and SUV corrected for lean body mass (SUVlean). SUV measurements are increasingly incorporated in clinical trials in providing an objective assessment of therapy response on serial PET scans. While useful, it is important to be aware of the limitations of this parameter and potential over-reliance during clinical decision making [34].
Other PET imaging biomarkers that have attracted significant interest recently are the determination of the metabolic tumour volume (MTV) and total lesion glycolysis (TLG). MTV is estimated by delineating the region of interest (e.g. tumour) using either a fixed SUV cut-off or region growing up to a prefixed percentage of the SUVmax, whereas TLG is derived by multiplying the MTV by the mean SUV. These PET parameters have shown to be useful prognostic markers in certain solid tumours [35]. In a study of 328 patients with non-small cell lung cancer (NSCLC), the prognosis of patients could be stratified using median whole-body MTV [36]. For MTV ≤65.7 ml the median overall survival (OS) was 41.1 months, compared with 9.5 months for those with a median MTV of >65.7 ml. Both MTV and TLG were shown to be independent prognostic factors after adjusting for age, gender, treatment intent, histology and stage and were better prognostic markers than whole-body SUVmax and SUVmean.
9.2 Clinical Applications of FDG PET in Oncology
9.2.1 FDG PET in the Diagnosis of Malignancy and Characterisation of Tumours
9.2.1.1 Solitary Pulmonary Nodule
In the initial evaluation of a solitary pulmonary nodule (SPN), FDG PET is the most accurate imaging modality. Incidental pulmonary nodules are increasingly detected especially with improvement in the sensitivity of modern CT scanners and often pose a management dilemma. The risk of malignancy is dependent on the individual patient, and the use of FDG PET is incorporated in management guidelines [37]. For an accurate assessment, the size of the nodule should be at least 8 mm, below which PET is less reliable due to partial volume effects (i.e. the degree of tracer accumulation in small lesions which are near the resolution limits of the imaging equipment may be underestimated) and respiratory motion. Malignant SPN generally has a higher FDG uptake than benign lesions. By considering clinically relevant information and the pretest probability for malignancy, the addition of PET can risk-stratify and identify patients who would benefit from an invasive strategy [38]. Although false-positive results can occur (e.g. inflammation, infection or sarcoidosis), a nodule with a SUVmax of more than 2.5 is generally considered malignant until proven otherwise [39] (Fig. 9.13). The converse, however, is not necessarily true. Since the degree of FDG uptake depends on size and proliferative activity, false-negative results can occur in small nodules or in malignancy with low metabolic rates (e.g. carcinoid or bronchoalveolar carcinoma) (Fig. 9.14). In a study by Hashimoto and colleagues [40], the probability of malignancy in any visually evident lesion (SUV between 1.0 and 2.5) was reported at 60 %, and most lesions (15 out of 16 lesions) were ≥10 mm on CT. Some authors are of the opinion that nodules can only be regarded as benign if they are completely negative on PET [41].
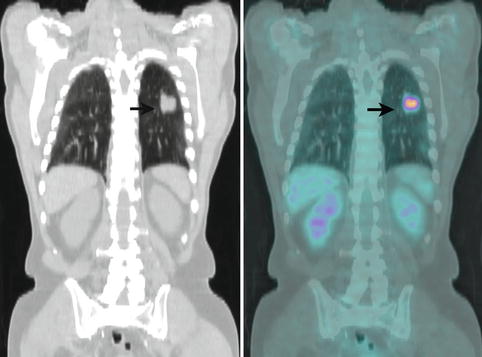
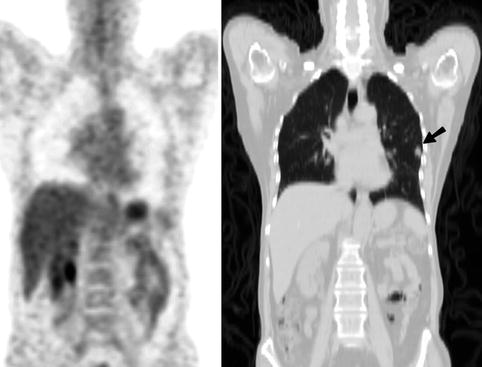
Fig. 9.13
Coronal CT (Left) and combined FDG PET-CT (Right) images of the lungs of a 78-year-old man who presented for further characterisation of an irregular 34 mm solitary pulmonary mass in the lower lobe of the left lung (arrows). SUVmax of the lesion on PET was 7.3. In view of the PET findings, the patient underwent surgery, and a T2N0 poorly differentiated squamous cell carcinoma confined to lung parenchyma was resected
Fig. 9.14
Coronal PET (Left) and CT (Right) images of a 58-year-old woman who presented for further characterisation of an irregular 10 mm solitary pulmonary nodule in the lower lobe of the left lung (arrow). The lesion had faint FDG uptake on PET with an SUVmax of 1.1. The patient underwent surgery, and a T1N0 bronchoalveolar carcinoma was removed
9.2.1.2 Brain Tumours
The use of FDG PET in brain tumours was the first oncological application. The initial clinical data emerged in the early 1980s when Di Chiro and colleagues demonstrated the efficacy in grading and predicting prognosis in primary brain tumours [42]. However FDG crosses the blood–brain barrier, and scan interpretation is hampered by high cerebral glucose consumption and consequently high physiologic tracer activity in the grey matter. Therefore FDG when utilised alone is not ideal in neuro-oncology. Moreover FDG PET may not differentiate benign and malignant cerebral lesions with sufficient accuracy [43]. Where FDG PET may be helpful is in determining the grade of the primary brain tumour at diagnosis (high vs. low grade), detection of malignant transformation of low-grade tumours (e.g. anaplastic transformation) and to provide prognostic information [44]. FDG PET can also contribute in targeting a site for biopsy by identifying the most metabolically active component of a lesion discriminating active tumour from surrounding oedema.
9.2.1.3 Adrenal Lesions
In patients with malignancy, FDG PET has demonstrated a sensitivity of 83 %, specificity of 85 % and a negative predictive value (NPV) of 93 % in the evaluation of adrenal masses of at least 10 mm in size [45]. Various semi-quantitative parameters have also been used such as SUV threshold or adrenal-to-liver ratios [46, 47]. In a cohort of 150 patients with various malignancies, by using a SUV cut-off of 3.1, FDG PET correctly classified most adrenal lesions with a PPV of 89 % and a NPV of 99 % [46] (Fig. 9.15). The reference standard used in this study was mostly imaging follow-up. Nine out of one hundred and seventy-five adrenal masses were misclassified where a small percentage of adrenal adenomas had an SUV of more than 3.1. When the unenhanced CT information of the PET-CT was interpreted in conjunction with PET using attenuation values less than or equal to 10 HU for diagnosing an adenoma, only three masses (1.7 %) were misclassified. PET was found to be useful even for small lesions defined as less than 15 mm. In patients with no history of malignancy, there is limited data showing the incremental benefit of adding PET. In a study comprising 37 patients with no previous history of cancer, active malignancy or elevated hormonal secretion, FDG PET was useful in characterising tumours following inconclusive CT or MRI results [48] (Fig. 9.16). A high NPV of 93 % was found in another study using visual analysis of adrenal FDG uptake less than hepatic uptake as criteria for a benign lesion [49].
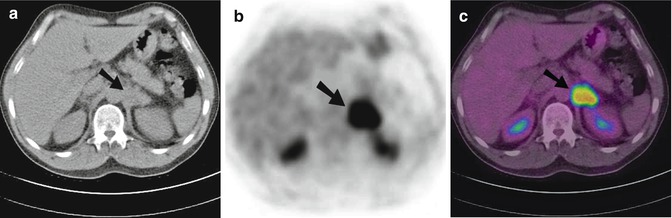
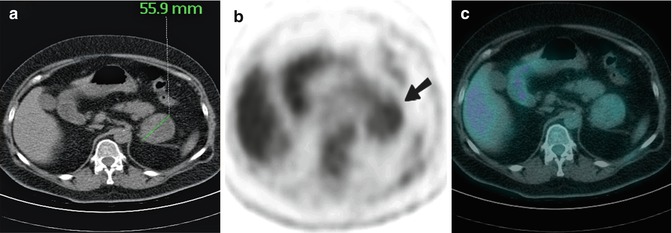
Fig. 9.15
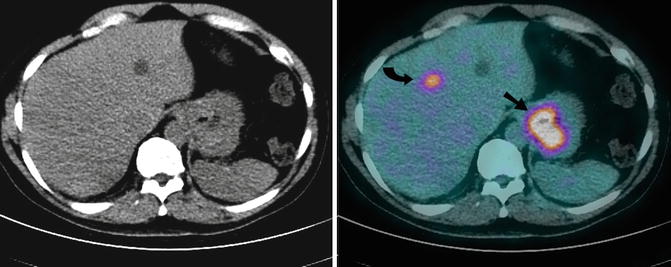
Transaxial CT (a), FDG PET (b) and combined PET-CT (c) images of the upper abdomen of a 55-year-old man with adenocarcinoma of unknown origin. Bilateral adrenal enlargement with abnormal increased FDG was noted. The right adrenal gland measured 30 mm with an SUVmax of 4.4 on PET (not shown). There was also intense FDG uptake within a 35 mm left adrenal mass with an SUVmax of 10.0 (arrows), and the level of uptake was significantly above that of background hepatic parenchymal activity. The SUV ratio of the left adrenal gland/liver was 5.3. The patient died 7 months after the PET scan
Fig. 9.16
Transaxial CT (a), FDG PET (b) and combined PET-CT (c) images of a 53-year-old woman with no history of malignancy who presented with a 55.9 mm left adrenal mass. At the site of the mass on CT, there was mild heterogeneous FDG uptake on PET (arrow) with an SUVmax of 2.6 (the level of uptake was less than background hepatic parenchymal activity) favouring a benign aetiology. There were no other abnormalities identified on PET. At surgery, a large benign adrenocortical adenoma was removed
9.2.1.4 Liver Tumours
Normal hepatic parenchyma demonstrates moderate physiologic FDG uptake, and as a result, the sensitivity for liver tumours is compromised due to poor contrast between lesion and background. There is currently no strong evidence to support FDG PET for diagnosing malignancy in hepatic lesions in patients with no history of cancer. The application is further diminished due to the variable degree of glucose metabolism in hepatocellular carcinoma (HCC). In one study, only 55 % of HCC (mean diameter of 57 mm; range 15–200 mm) demonstrated FDG uptake above normal background liver activity [50]. High levels of glucose-6-phosphatase in these tumours which lead to dephosphorylation of FDG are thought to account for this. Another PET tracer 11C-acetate has been used in conjunction with FDG for the detection of HCC with some success [51]. FDG avidity correlated with the degree of cellular differentiation and tumour grade, and increased FDG uptake is more likely to be exhibited by tumours which are poorly differentiated. Well-differentiated HCC tends to show a reverse pattern with negative uptake on FDG PET but positive uptake with 11C-acetate.
9.2.2 FDG PET in Staging Malignancy
9.2.2.1 Non-small Cell Lung Cancer
The role of FDG PET is well established in staging many malignancies. There is extensive evidence for NSCLC where PET-CT is more accurate than conventional methods [52], cost-effective [53] and incorporated into the diagnostic algorithm in management guidelines [54–56] (Fig. 9.17). The benefit in NSCLC has now been demonstrated and supported by several randomised controlled trials (RCT) where the addition of PET [57] or PET-CT [58] to conventional workup (CWU) at staging prevents unnecessary surgery in NSCLC (Fig. 9.18). In a multicentre RCT with 188 patients, the investigators demonstrated the addition of PET resulted in a 51 % relative reduction in futile thoracotomy and avoided unnecessary surgery in 1 out of 5 patients [57]. For mediastinal nodal staging with PET (Fig. 9.19), a meta-analysis of 44 studies published between 1994 and 2006 showed a pooled sensitivity and specificity of 74 and 85 %, respectively, whereas for CT, sensitivity and specificity of 51 and 85 %, respectively, were reported [54]. A RCT of 189 patients who underwent invasive mediastinal staging either with mediastinoscopy, endoscopic ultrasound (EUS) fine-needle aspiration or endobronchial ultrasound-guided transbronchial needle aspiration (EBUS-TBNA) regardless of PET-CT or CT findings showed in patients without enlarged lymph nodes and a PET-negative mediastinum, patients could proceed directly to surgery in view of the low false-negative results [59]. However in patients with enlarged lymph nodes irrespective of PET findings, further staging investigation is required. For mediastinal lymph node positivity on PET-CT, confirmation should be sought before a decision on operability is made as false-positive FDG uptake in mediastinal lymph nodes can occur in inflammatory or interstitial lung diseases (e.g. tuberculosis, anthracosis, silicosis, sarcoidosis) and can mimic or coexist with metastatic disease.
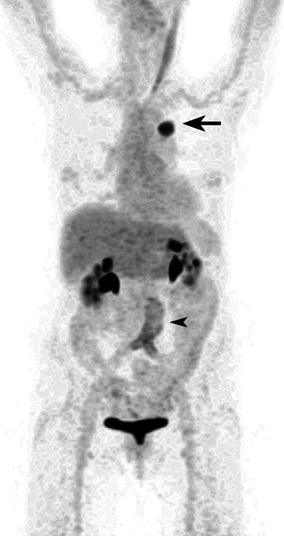
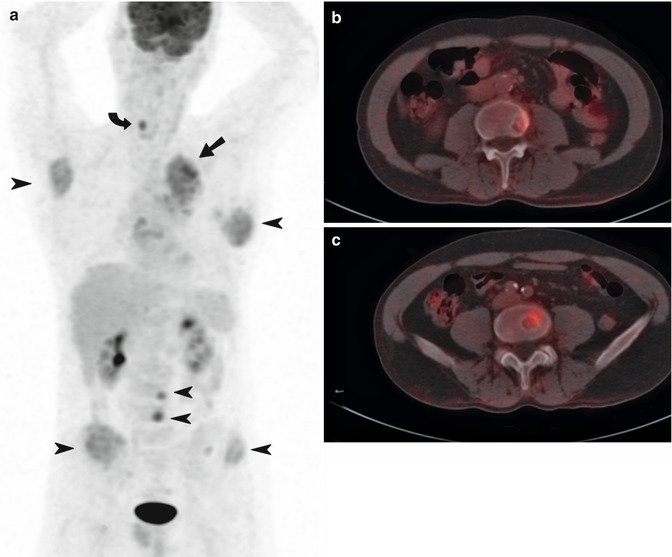
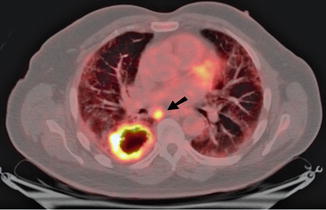
Fig. 9.17
Maximum intensity projection (MIP) image of an 80-year-old woman who underwent a FDG PET scan to stage newly diagnosed lung cancer in the apical segment of the left lower lobe. The primary demonstrated intense FDG uptake with a SUVmax of 17 (arrow), and PET did not reveal metastatic disease. There was also mild diffuse linear-increased FDG accumulation surrounding the asymptomatic aortobifemoral vascular graft (arrowhead). There was prominent muscle activation along the left sternocleidomastoid muscle as well as physiologic tracer excretion in both kidneys and bladder. The patient subsequently underwent surgery with a curative intent, and a T2aN0 moderately differentiated adenocarcinoma was resected which was confined to the lung parenchyma
Fig. 9.18
Staging non-small cell lung cancer. A 55-year-old man who presented with coughing, a hoarse voice and significant weight loss underwent a staging FDG PET-CT scan for newly diagnosed adenocarcinoma of the left lung. The patient was staged as T2N2M0 on conventional imaging, and the initial management plan was for radical treatment with a curative intent. On PET (a), the primary mass in the left upper lobe (arrow) demonstrated moderate FDG uptake (SUVmax = 5.4) with evidence of mediastinal invasion. There was also widespread metastatic disease within the bones (arrowheads) with extension into adjacent soft tissues in the scapulae and ilium. There was normal FDG accumulation in the brain, liver and testicles and physiologic urinary tracer excretion in the kidneys and bladder. Selected transaxial combined PET-CT images (b, c) showing abnormal focal FDG uptake within lytic lesions at the vertebral bodies of L3 and L4, respectively. Focal-increased FDG uptake was also observed at the right vocal cord (curved arrow) representing compensatory supraphysiologic activation as a result of left recurrent laryngeal nerve compression. Following PET, the patient’s management was changed to palliative chemotherapy with carboplatin and gemcitabine and subsequently palliative radiotherapy to the spine. The patient passed away 7 months after the PET scan
Fig. 9.19
Preoperative staging non-small cell lung cancer with FDG PET. A 67-year-old man with pulmonary fibrosis underwent a staging FDG PET-CT scan for newly diagnosed moderately differentiated squamous cell carcinoma of the right lung. On PET-CT, the primary mass in the right lower lobe measured 57 mm with a rim of intense FDG uptake (SUVmax = 18) and central photopaenia consistent with necrosis. There was focal intense uptake within a 24 mm subcarinal lymph node with a SUVmax of 12 (arrow) consistent with metastatic disease which was confirmed and resected during surgery
PET is increasingly incorporated in treatment planning for NSCLC especially in RT planning. The integration of structural and metabolic information on PET-CT in contouring allows a tumouricidal dose to be delivered to malignancy (primary and involved lymph nodes) and at the same time, sparing toxicity to surrounding organs by delivering the lowest RT dose to the smallest volume of normal tissue. This is especially relevant in the context of post-obstruction atelectasis where the boundary between collapsed lung and tumour is not distinguishable on anatomical imaging alone. The advent of 4-dimensional (4D) PET-CT imaging where image acquisition is “timed” in relation to the different phases of the respiratory cycle further improves the accuracy in defining the target volume [60]. Whether this improvement in contouring translates to superior patient outcomes will depend on future data regarding long-term follow-up of these patients.
9.2.2.2 Lymphoma
In aggressive lymphomas, FDG PET has replaced conventional imaging such as gallium scintigraphy. FDG PET leads to a change in stage in 10–40 % cases, especially upstaging by detecting additional lesions [61]. Results from the Australian PET Data Collection also suggested superiority in low-grade subtypes [62]. For bone marrow assessment, PET complements biopsy, and the accuracy depends on the histology of the disease. In a meta-analysis (n = 587), the sensitivity of PET was 76 % in aggressive lymphomas and 30 % for indolent subtypes [63]. Since the iliac crest is often chosen as the site for bone marrow biopsy (BMB) which in turn may not be involved by lymphoma, PET-CT can reduce false-negative BMB by locating the site of bone marrow infiltration prior to sampling where an accuracy of 100 % has been reported [64]. BMB is invasive and insensitive owing to sampling error, and some investigators have debated the need for routine BMB in patients with Hodgkin’s disease (HD) in the era of staging PET-CT [65–68]. Whether PET-CT obviates the need of BMB very much depends on the histological subtype of lymphoma and the pattern of FDG uptake in bone marrow. Where focal or multifocal uptake predicts marrow infiltration with a high degree of accuracy (Fig. 9.20), a diffuse pattern may be secondary to marrow hyperplasia or diffuse lymphomatous infiltration.
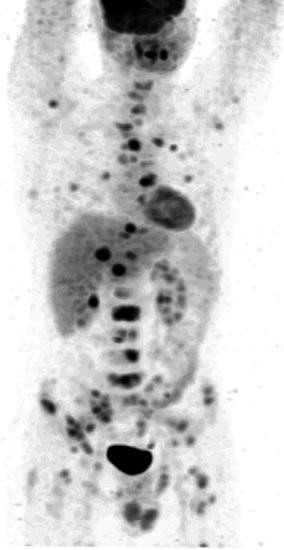
Fig. 9.20
Staging newly diagnosed lymphoma in a 40-year-old male with ALK negative anaplastic large cell NHL. Whole-body FDG PET (maximum intensity projection image) showed intense focal FDG activity in multiple liver lesions, left lung and extensively in multiple skeletal sites consistent with stage IV disseminated disease. Bone marrow biopsy of L2 vertebra at the site of the most intense FDG uptake confirmed bone marrow involvement. There was normal FDG accumulation in the brain and myocardium and physiologic urinary tracer excretion in the kidneys and bladder
Some investigators have demonstrated a correlation between cellular proliferation and SUV measurements and the ability to differentiate indolent from aggressive non-Hodgkin’s lymphoma (NHL) [69] and grade I/II from grade III follicular NHL [70]. However there is a significant overlap in the range of SUV in different subtypes of NHL, and no definite SUV threshold has been identified where a certain tumour phenotype can be predicted with sufficient accuracy.
9.2.2.3 Oesophageal Cancer
In a meta-analysis comparing EUS, CT and PET in staging oesophageal and gastro-oesophageal junction cancers, EUS was more sensitive but less specific than CT and PET for regional lymph node metastases [71]. For distant metastases, PET is superior. In a prospective trial of 129 patients, PET led to a high-impact change in management (change in treatment modality or intent) in 35 % of patients and from curative to palliative intent in 20 % [72].
9.2.2.4 Gastric Cancer
For gastric cancer the role of staging FDG PET is evolving and is currently not yet recommended as part of routine clinical practice [73]. The detection of the primary can be confounded by prominent physiologic uptake in the stomach and may partly explain the mixed results. The sensitivity is lowest for non-intestinal diffuse subtypes and in those containing signet ring cells and rich in mucin. A positive correlation between accuracy of nodal staging and FDG avidity in the primary also exists [74]. In our experience, PET is useful in detecting distant metastatic disease in approximately 8 % of cases not identified on conventional imaging [75] (Fig. 9.21) and may have incremental value in selected patients (e.g. T3 or T4 tumours of non-signet ring cell histology). We have also found positive uptake in lymph nodes on FDG PET independently predicts poor survival and may potentially be useful in stratifying patients with poor prognosis for upfront additional treatments such as biological therapy with trastuzumab, RT or participation in clinical trials [76].
Get Clinical Tree app for offline access
Fig. 9.21
A 67-year-old man with newly diagnosed fungating poorly differentiated gastric adenocarcinoma who underwent preoperative FDG PET-CT scan for staging. Axial CT (Left) and combined FDG PET-CT (Right) images demonstrated intense focal uptake at the site of the primary (arrow), within a perigastric lymph node (not shown) and in segment IV of the liver (curved arrow
 New Therapies and Functional-Molecular Imaging
 Overview of Functional MR, CT, and US Imaging Techniques in Clinical Use
 MRI Hypoxia Measurements
 Spectroscopy of Cancer
 Current Clinical Imaging of Hypoxia with PET and Future Perspectives
 Medical Image Computing for Oncology: Review and Clinical Examples


Related posts:
New Therapies and Functional-Molecular Imaging
Overview of Functional MR, CT, and US Imaging Techniques in Clinical Use
MRI Hypoxia Measurements
Spectroscopy of Cancer
Current Clinical Imaging of Hypoxia with PET and Future Perspectives
Medical Image Computing for Oncology: Review and Clinical Examples
Stay updated, free articles. Join our Telegram channel
Full access? Get Clinical Tree
