(1)
with homogeneous initial and boundary conditions. In soft tissue the speed of sound, ν s ~ 1.5 mm/µs, thermal expansion coefficient, β ~ 3.6e–4/°C, and compressibility κ ~ 4.6e–10/Pa. The heating rate is
(2)
(3)
![$$ \left[\frac{\partial^2}{\partial {t}^2}-{\nu}_{\mathrm{s}}^2\varDelta \right]p\left(\mathbf{x},t\right)=\left(\frac{\beta \sigma}{\kappa C\rho}\right)\left(\mathbf{x}\right)\frac{\partial }{\partial t}{\left|\mathbf{E}\left(\mathbf{x},t\right)\right|}^2 $$](/wp-content/uploads/2016/03/A303895_1_En_21_Chapter_Equ4.gif)
(4)
The tissue parameters ν s, κ, β, ρ, and C are often assumed constant but can vary with respect to x. EM loss is proportional to electrical conductivity. Additionally, dispersion cannot be ignored so conductivity is also frequency-dependent, σ = σ(x,f) where f denotes frequency. These are all intrinsic tissue properties, but the electromagnetic field, E(x,t) is applied by the experimental setup in short, high-power pulses. An idealized system excites with an electric field that is impulsive in time and uniform in space, i.e., 
Most TA systems propagate EM pulses with only 2–3 cm depth penetration. We have developed a benchtop TCT system that provides excellent depth penetration of the EM pulse and yet generates TA pulses of sufficient strength to be detected after travel through 6 cm of soft tissue. The applied electric field is nearly constant in the ROI, but susceptibility effects can cause significant spatial variations. The applied field is not impulsive in time, but it is reasonable to assume that it is separable as  and the governing equation becomes
![$$ \left[\frac{\partial^2}{\partial {t}^2}-{\nu}_{\mathrm{s}}^2\varDelta \right]p\left(\mathbf{x},t\right)=S\left(\mathbf{x}\right){I}^{\prime }(t) $$](/wp-content/uploads/2016/03/A303895_1_En_21_Chapter_Equ5.gif)
where  is the thermoacoustic source term which is recovered from measurements of p at receiver locations, x, located outside of the ROI.
and the governing equation becomes(5)
is the thermoacoustic source term which is recovered from measurements of p at receiver locations, x, located outside of the ROI.Ideal TCT Pressures
Idealized TCT pressures have straightforward mathematical representation and reconstruction of TCT data bears similarities to reconstruction methods for other imaging techniques. An idealized TCT system propagates impulsively in time so that I(t) = δ(t) and in this case the pressures generated can be written in terms of spherical means of the source term, S [20].
where the subscript, δ, indicates that the pressures were excited impulsively.
(6)
Mathematically, idealized TA pressures are equivalent to derivatives of the spherical Radon transform. Physically, TA pressures are nearly equivalent to reflection tomography data. TA pressures generated by impulsive irradiation and reflection tomography data both represent spherical integrals of a source term, S, centered at the transducer focal spot, x. Reflection tomography assumes 2-way travel in which pulses emitted by a transducer are recorded after experiencing only one scattering event. In contrast, TCT measurements represent 1-way travel from object to transducer. TCT sinograms represent internal sources of acoustic pressures, much as PET sinograms represent internal radiation sources. The difference between TCT and PET, however, is that TCT sinograms represent spherical integrals whereas PET sinograms represent line integrals. TCT differs from ultrasound transmission tomography, for which measured pressures are processed to provide line integrals of “slowness” [21, 22], attenuation [23] or both [24–26]. These methods reconstruct line integrals using techniques developed for X-ray CT. Ultrasound tomography accounting for refraction, scattering, and diffraction remains a topic of research. We cite just a few of the numerous results applied to breast cancer imaging [27–29]. Fourier interpolation of diffraction tomography data had long permitted bandlimited recovery of the refractive index of weak scatterers, but backpropagation of the acoustic field improved image quality [30].
Mathematically exact reconstruction of S from measurements of p δ restricted to a surface surrounding the ROI is a well-studied problem. Explicit inversion formulae for this spherical Radon transform were first derived in series form for circular and spherical measurement apertures [31, 32] while inversion of standard filtered backprojection (FBP) type was derived for a planar measurement geometry [33]. Mathematically exact FBP inversion was derived in [34] and quickly generalized to other measurement geometries [35]. Most of these results assume that the excitation pulse is impulsive in time, but neither ultrasound transducers nor high-power EM amplifiers can transmit true delta functions.
Experimentally Realized TCT Pressures
DuHamel’s principle explicitly reveals the extent to which the true pulse, with temporal envelope I, bandlimits TCT pressures
![$$ {p}_I\left(\mathbf{x},t\right)=\left[I*{p}_{\delta}\right]\left(\mathbf{x},t\right) $$](/wp-content/uploads/2016/03/A303895_1_En_21_Chapter_Equ7.gif)
where the convolution is performed with respect to time. This is derived by exploiting linearity of the wave equation and considering the source, S, as a sum of impulsive sources at times 0 < s < t [20]. By the convolution theorem,
where F denotes the Fourier transform with respect to time. The irradiation pulsewidth therefore directly bandlimits TA pulses, and therefore also bandlimits reconstructed images [36].
(7)
(8)
Necessary Steps for Translation from Benchtop to Clinical Prototype
Before clinical prototypes can be deployed to validate the TA contrast mechanism in vivo, it is necessary to show that VHF EM pulses can generate useful TA signals without overheating the patient. This requires judicious choice of system parameters, including irradiating EM frequency and pulsewidth as well as choice of ultrasound receivers.
Choice of EM Frequency
TA imaging systems must irradiate with an electric field that penetrates the entire ROI and yet is lossy enough to generate sufficiently strong acoustic pressures to survive the outgoing trip across the ROI. Near infrared radiation (NIR) is extremely lossy in soft tissue, with a typical penetration depth of only 1.7 cm [17]. Microwaves heat tissues with high water content efficiently, but with limited depth penetration [19, 37]. Additionally, diffraction of short wavelength microwaves can cause TA signal dropout [38]. In contrast, VHF frequencies penetrate large tissue volumes well with good uniformity, as witnessed by the success of whole-body 3T MRI, which excites spins using 128 MHz. Precisely because these EM pulses are not lossy in soft tissue, they generate a weaker TA signal than microwave or PA irradiation. Nevertheless, the TA pulses generated are sufficiently strong to survive passage through 5–6 cm of soft tissue [39, 40]. Unlike other systems that irradiate with microwave or optical pulses, 100 MHz EM radiation can penetrate an adult torso, creating the potential for an abdominal TCT system for applications that allow placement of an ultrasound array within just a few centimeters of the ROI.
Both optical and VHF EM energy heat blood, although the contrast mechanisms are dramatically different. NIR energy heats hemoglobin, and by varying optical wavelengths, PA systems discriminate between oxy- and deoxyhemoglobin [41, 42], as do pulse oximeters. Because VHF energy heats ions, blood and physiologic saline each generate a strong TA signal, which is not the case for pure water. The electrical conductivity of physiologic saline ranges from approximately 0.8 S/m at 30 MHz to 1.6 S/m at 100 MHz [43]. Blood is equally lossy near 100 MHz, but the conductivity of pure water is six orders of magnitude lower. Therefore we excite TA signal with a carrier frequency at the top of the frequency modulated (FM) radio band, 108 MHz.
Choice of EM Pulsewidth
Ideal irradiation would be instantaneous, but that is physically unrealizable. TA pulses generated by instantaneous irradiation would be bandlimited only by the content of the tissue. Attenuation limits the clinical utility of high frequency ultrasound for abdominal applications, so an irradiation pulsewidth of 70 ns would essentially bandlimit TA pulses to 14 MHz, approximately the bandwidth of higher frequency clinical ultrasound transducers. The VHF-pulsed amplifier used to generate the results presented here is limited in peak power output and response time. The results presented below were generated by either 900 or 700 ns irradiation pulsewidths, for the large organ and prostate testbeds, respectively.
Optical pulsewidths of order 10 ns are capable of generating PA pulses with essential bandwidth up to 100 MHz. However, such high ultrasound frequencies are quickly attenuated because acoustic attenuation in soft tissue is exponential with respect to both travel distance and frequency:
(9)
Small ROI applications are therefore suitable for photoacoustic tomography (PAT). Conversely, microwave and radiofrequency TCT systems struggle to propagate 100 ns pulses; most systems irradiate with 400 ns to 1 μs pulsewidths, generating very low frequency TA (below 1 MHz). Outgoing TA pulses are therefore attenuated very little. Extremely broadband TA signals have been generated [45, 46], but acoustic attenuation quickly decimates the high frequency components of the TA pulse. Because TA bandwidth directly impacts image resolution [36], TCT system design must balance bandwidth, signal strength, and depth penetration. Transmit pulses were optimized for diffraction tomography in [32] and the result applies to EM pulses used to generate TCT signals. Additional care is required for TCT to ensure that the irradiating electric field is sufficiently strong throughout the imaging volume.
Materials and Methods
The testbeds represent slight modifications of the first generation system [47], propagating submicrosecond TE10 pulses past the specimen. Testbed design was performed using ANSOFT high frequency structural simulator (HFSS) to minimize reflected power at transitions between air-filled rigid coaxial line and fluid-filled waveguide section. Specifically, S-parameters were optimized to maximize transmission (S 21) and minimize reflection (S 11 and S 22). To validate testbed EM performance broadband S-parameters were measured. The basic experimental setup during scanning involves collecting complete 4-channel measurements of incident and reflected pulses at both testbed ports whenever possible. During TCT sinogram acquisition, however, two channels are used to record TCT signal, leaving only two channels for monitoring EM pulses. Ultrasound hardware remains essentially unchanged between systems. The tomographic gantry hardware permits acquisition of “step-and-shoot” volumetric data. In all systems the axis of rotation and translation runs along the x direction, although the axes are rotated differently in the two systems.
EM Hardware
The testbeds have the dimensions of a TE103 cavity, but with different y-dimensions, depending upon the size of the object to be imaged. The testbed designed for imaging large organs was fabricated in the standard orientation of a TE10 waveguide, with vertically polarized electric field propagating horizontally along the z-axis. This testbed permits variable height in the y-direction, whereas the testbed optimized for prostate imaging has the y-dimension fixed at 6 cm. Additionally, the orientation of the smaller prostate imaging system is rotated so that the x-axis of translation and rotation is vertical.
Carefully designed coaxial-to-waveguide transitions at each port efficiently propagate TE10 pulses through the testbed to a load [47]. Directional coupler line sections and plug-in elements at input and output ports as shown in Fig. 1 allow direct measurement of incident and reflected pulses, from which power loss in the system can be calculated. The SAR in the tissue specimen is estimated by comparing power loss in the loaded vs. the unloaded system. In these benchtop systems SAR during TA signal production is tens of kW/kg, but duty cycle can be extremely low, keeping average SAR is on the order of 1 W/kg.
Fig. 1
(Left) A single VHF pulse in grey. Pulse envelope in thick black represents I 1/2. (Right) Spectrum of TA pulse
Active Components
A −10 dBm input pulse from a tunable signal generator (Rohde & Schwarz, SML10) is amplified from a fraction of a milliwatt to a peak power exceeding 40 kW by a custom designed RF amplifier (QEI VHF-50KP). This 3-stage amplifier propagates pulsewidths no longer than 1 μs. The first stage is solid-state and performs the lion’s share of the amplification, sending a 500 W square pulse to the first of two pulsed vacuum tubes. The intermediate pulse amplifier (IPA) is a vacuum tube (CPI #3CPX5000A7). It responds sluggishly, with rise and fall times exceeding 100 ns. This tube generates nearly 6.5 kW near the end of a 880 ns pulse. The final pulse amplifier (PA) tube (#3CPX800A7) further distorts the pulse shape, severely band-passing the irradiation pulse. The first two stages are monitored using directional coupler line sections which provide 27 dB attenuation, and are then further attenuated by an additional 20 dB. The final PA output is attenuated by 62 dB. Envelopes of the pulses generated by a −10 dBm pulse of 880 ns pulsewidth are shown in Fig. 1. High-power pulses propagate along air-filled Electronics Industry Alliance (EIA) 1–5/8″ rigid copper coaxial line to the testbed. A TE10 pulse propagates along the fluid-filled testbed. Additional ports added to the testbed permit positioning of the object under test by positioners that extend through a custom designed port outside of the testbed (Fig. 3). The entire setup is housed inside a 100 dB Faraday cage (Lindgren #14-W-5/S-I).
Fig. 2
Envelopes of VHF pulses at each stage of the amplifier.
Passive: Common Elements for Both Testbeds
Passive components include testbeds optimized for ex vivo large organ and prostate imaging, as well as the materials that load the testbed. The thermoacoustic testbeds propagate a submicrosecond TE10 pulse with carrier frequency 108 MHz and peak power of 40 kW. The dielectric is primarily deionized (DI) water mixed with 15 g/L glycine, which reduces the wavelength by nearly an order of magnitude compared to that in a vacuum. Testbeds have dimensions of a TE103 cavity, with a = 19 cm and c = 64 cm. However, coupling irises were carefully designed to provide a good match between the rigid EIA 1 5/8″ coax attached to each port.
Testbeds exploit reciprocity and efficiently transmit power to a dummy load, so that electromagnetic quality is nearly one. While resonance would increase field strength, it would also diminish our ability to irradiate the object with submicrosecond pulses. Incident and reflected pulses at each port are monitored using line sections (Bird #4715-000) fitted with 50 dB directional coupler slugs (Bird #0274-000). Incident pulses at each port have 2 kV peak amplitude, so they are attenuated by an additional 30 dB (80 dB total) to prevent over-ranging on the oscilloscope (Tektronix DPO 7140). EM pulses are collected using the oscilloscope’s full bandwidth of 1 GHz and a sampling rate of 5 GHz. Incident and reflected power at each port are calculated using these measurements (Fig. 3).
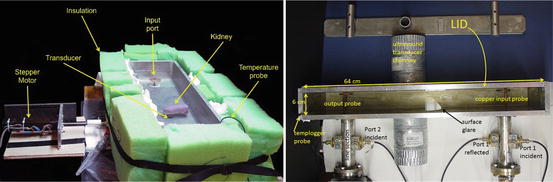
Fig. 3
(Left) Large testbed for imaging large organs. (Right) Optimized for prostate imaging
US Hardware
The testbeds have dual-channel capability, enabling either faster data acquisition or broader bandwidth imaging. Although TA pressures are relatively weak, we choose critically damped transducers over more sensitive lightly damped transducers. This is done because TA pressures tend to be very broadband compared to ultrasound pulse echoes, and the more heavily damped transducers have a broad bandwidth. Focused immersion transducers (Olympus V303, V306) with point target focus of 0. 6″ ~ 1.5 cm and center frequencies 1 and 2.25 MHz were positioned directly below and above the kidney, respectively. This was done to maximize bandwidth of the aggregate measured signal. To minimize scan time when imaging fresh surgical prostate specimens, we use a match pair of 2.25 MHz transducers with 0.8″ point target focus. The 2.25 MHz transducer captures first sidelobe of the power spectrum of a 700 ns irradiation pulse. These lobes lies between 1.4 and 2.9 MHz. TA signal is amplified 54 dB by low noise preamplifiers (Olympus #5662).
EMI Shielding
Great care is taken to electromagnetically shield the transducers and cables. Transducers are recessed 1 cm in an EM cutoff chimney to minimize their exposure to the E-field inside the testbed. Doubly shielded transducer cables (Olympus #BCU-58-10DSW) carry the TA signal to a penetration panel on the Faraday cage. Additionally, standard ductwork is used to further shield the transducer cable from stray electromagnetic interference (EMI) from the amplifier as shown in (Fig. 5). In addition to the cables’ mechanical shielding, inline low-pass filters (Mini Circuits) suppress any of the high-power 108 MHz excitation pulse that may still be picked up by the transducer. This is done to protect a 54 dB preamplifier (Olympus, #5662).
Thermal and Mechanical Hardware
Temperature of the glycine solution is monitored by a templogger (TDC D10370003, ThermoWorks, Lindon, UT), whose probe is permanently mounted in one corner of the testbed near port 2. The object under test is rotated and translated by a dual motion actuator and driver (Haydon Kerk #LR35KK4AD-05-940 and #DCM8028, respectively), so that data is collected in “step-and-shoot” mode.
Testbeds: Dimensions and Orientations, Ey for Each
E-field strength along the centerline of the waveguide is estimated using the relative permittivity of water as a function of temperature according to [48]
(10)
Here,  ,
,  , c is the speed of light in a vacuum, f is frequency, ε r is relative permittivity, P is power, μ o is free-space permeability, and a = 0.19 m is the testbed x-dimension. b is the testbed y-dimension, which differs depending upon testbed. b = 10 cm for the large testbed and b = 6 cm for smaller testbed.
, , c is the speed of light in a vacuum, f is frequency, ε r is relative permittivity, P is power, μ o is free-space permeability, and a = 0.19 m is the testbed x-dimension. b is the testbed y-dimension, which differs depending upon testbed. b = 10 cm for the large testbed and b = 6 cm for smaller testbed.The smaller testbed has b = 6 cm and propagates pulses of 700 ns duration and 22.5 kW incident power. Using the empirically estimated relative permittivity for 6 °C glycine of ε′ r = 92 yields a field strength near the input port of E y = 15.5 kV/m. Loss in an unloaded testbed filled with glycine is about 35 %, reducing the field strength to only 10 kV/m near the output port. Prostate specimens are positioned between the ports, and a conservative estimate of electric field strength experienced is 12 kV/m.
Similar calculations for the larger testbed with b = 10 cm propagating 900 ns pulses with incident power 25 kW implies a field strength near the input port of 12.6 and 10 kV/m near the kidney. Not only does the smaller testbed concentrate the electric field, but it also permits positioning the ultrasound receivers closer to the specimen. Both effects improve signal to noise ratio (SNR).
Specimen Prep and Scanning
LabVIEW software (2010 version, National Instruments, Austin, TX) controls the tomographic gantry and signal generator (SML-01, Rohde and Schwarz, Columbia, MD), while also controlling data acquisition on a 4-channel digital oscilloscope (DPO 7104, Tektronix, Beaverton, OR). LabVIEW runs directly on the digital oscilloscope, which has an onboard Windows PC. The program communicates to the actuator via a universal serial bus (USB) data acquisition board (#6008, National Instruments), and to the signal generator via a standard general purpose interface bus (GPIB) cable. Both testbeds acquire in step-and-shoot mode over cylindrical measurement apertures.
Great care is taken to prevent tissue damage during scanning. To minimize water absorption 0.2 M glycine (15 g/L glycine powder in deionized (DI) water) serves as acoustic couplant and also as waveguide dielectric. To minimize autolysis the specimen, and therefore couplant, are chilled.
The benchtop systems described below collects complete data in “step-and-shoot” fashion over a cylindrical measurement aperture. The transducer focal point remains outside of the specimen as it rotates, as indicated by the dashed lines in Fig. 4b.
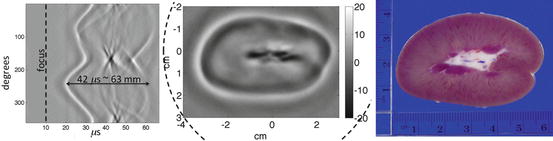
Fig. 4
(Left) Filtered sinogram corresponding to slice #31. (Center) Slice #31 reconstruction. (Right) Photograph from nearby slice
Gantry for Imaging Large Porcine Kidneys
Early work imaging swine kidneys was performed with a horizontal gantry axis and a single 1.8-degree rotation between tomographic views. Because total scan time was not a concern we drove the amplifier at a pulse repetition frequency (PRF) of 20 Hz and translated 2 mm between acquisition slices. “Jerking” of the specimen by rapidly rotating between tomographic views required waiting 3 s after rotation to allow the specimen to come to rest. Hollow-glass positioners were custom designed to maintain the TE10 electric field inside the testbed while securely rotating the object. Glass rods had 4 mm OD and 2 mm ID. To preserve the TE10 field care was taken to ensure that they were filled with acoustic coupling fluid. One end of each glass rod protruded approximately 1 cm into small cuts in the tissue specimen. The rod which “translated” the specimen was bound securely to the specimen using thread and small hooks in the rods. A custom adapter coupled the stepper motor to positioners. Buoyant forces on an immersed specimen are significant, but nevertheless long kidneys sag somewhat between positioners, degrading positioning accuracy.
Small Testbed for Imaging Fresh Human Prostates
This system has two advantages over the larger system. Firstly, the axis of rotation is vertical, improving positioning accuracy because gravitational forces on the specimen do not change during rotation about a vertical axis. Secondly, EM efficiency is improved because the electric field is concentrated and EM pulsing is optimized.
The third generation testbed gantry also collects volumetric data in “step and shoot” mode, but with gantry axis vertical and perpendicular to the direction of EM propagation. The translation distance between acquisition slices is 3 mm. To avoid suddenly jerking the specimen, each 1.8° rotation is executed in 64, 0.028125° substeps with a 0.025 s delay between each substep. This smoother specimen rotation approximates the continuous gantry motion of modern-day clinical CT scanners. An additional delay is imposed after the final substep to ensure that the specimen comes to rest before data acquisition commences. An even longer delay is imposed after each translation step. Validation performed using lamb kidneys can be viewed online at http://www4.uwm.edu/letsci/physics/research/patchs/upload/MicrosteppingGantry.mp4.
The system is loaded with fresh prostate specimens that include the whole prostate, as well as varying amounts of surrounding tissue, much of which is adipose tissue situated below the prostate. Samples are suspended below the stepper motor actuator by a monofilament (polydioxanone) surgical suture (PDS*II,0, Ethicon, Somerville, NJ). This study underwent a full committee review and was approved by the Institutional Review Board (IRB) of the Medical College of Wisconsin (MCW). An IRB-approved written informed consent was obtained from each participant prior to the start of any research procedures. Specimens are scanned for no more than 4 h and fixed immediately in formalin. Histology has not been impaired in any of the specimens scanned to date.
Besides concentrating the E-field by mechanically reducing the size of the testbed, software modifications minimize average SAR without degrading TA signal strength, despite a fivefold increase in PRF to 100 Hz. We pulse EM only during data acquisition in order to reduce average SAR. The average acquisition time per tomographic view is approximately 4 s, with more than half this time devoted to specimen positioning. To minimize average SAR the signal generator is switched off during gantry motion, settling time, and data storage. To ensure that recorded data represent a true average of 32 TA pulses, we add 20 % to the signal generator’s firing time immediately before recording data to the disk. At a 100 Hz PRF, only 384 ms are required for data averaging. Additionally, the amplifier may fire during the 300 ms switching time. While transmitting 700 ns pulses at a 100 Hz rate, the duty cycle is 0.007 %, but this is reduced conservatively to 0.001 % by switching the amplifier off during specimen positioning and data storage.
We note that our PRF of 100 Hz is limited not by the amplifier, but rather by the mechanical system. Only 50 μs are required for TA data acquisition, but the impulsive EM irradiation causes low frequency vibrations of the testbed, which arrive later and require up to 10 ms to decay. Although our current PRF of 100 Hz is 5 times faster than that of lasers used for photoacoustics, it is still slower than the amplifier’s 1 % duty cycle limit. Driving at a PRF of 25 Hz provides extremely stable power output, but 100 Hz makes power output variable, even though pulse shapes are preserved. Incident power upon port 1 of the testbed is variable, but percent loss in the passive testbed is stable.
Reconstruction
For our cylindrical measurement surface, a mathematically exact FBP formula [35] exists for ideal TCT data, which is neither attenuated, nor diffracted.
![$$ S\left(\mathbf{x}\right)=2{\displaystyle {\int}_{y\in \partial \varOmega }{\left[p\left(\mathbf{y},t\right)-t{p}_t\left(\mathbf{y},t\right)\right]}_{t=\left|\mathbf{x}-\mathbf{y}\right|/{\nu}_{\mathrm{s}}}\frac{\mathbf{n}\cdot \left(\mathbf{x}-\mathbf{y}\right)}{{\left|\mathbf{x}-\mathbf{y}\right|}^3} dy} $$](/wp-content/uploads/2016/03/A303895_1_En_21_Chapter_Equa.gif) where ∂ Ω is the cylindrical measurement aperture and n is the inward unit normal vector.
where ∂ Ω is the cylindrical measurement aperture and n is the inward unit normal vector.
In practice, however, both attenuation and diffraction degrade data quality so we emphasize small time data by applying an ad hoc weighting scheme only vaguely akin to Parker’s half-scan weights [49]
 where y conj is the conjugate source location, defined just as the conjugate ray is defined in X-ray CT [50]. Note that w(y conj,x) + w(y,x) = 1.
Backprojecting small time data out of plane implies a strong cone angle. Because our transducers are only mildly directional, we find that backprojecting in plane yields comparable (sometimes better) image quality than volumetric backprojection.
For the prostate specimen data we collect in the small testbed, we exploit the transducers’ bandlimited frequency response, and filter by merely applying a Hilbert transform rather than high-pass differentiation. The Hilbert transform plus the transducers’ apodized frequency response functions effectively differentiate with respect to time, yielding p t . To remove noise, TA pulses are bandlimited, typically with lower limit of 100 kHz and upper limit in the range 3–5 MHz. A smooth rolloff was applied to either end of the spectrum. Taking ν s = 1.5 mm/mus bounds the wavenumber k = 2πf/v s ∈ (0.42,15)1/mm. Our transducers are recessed in an EM cutoff chimney. For most points x inside the reconstruction region, k|x − y| ≫ 1 and the derivative term predominates, p(y,t) ≪ tp t (y,t
 Approach to Detection and Characterization of Hepatic Hemangiomas
 Resonance Imaging of Adenocarcinoma of the Pancreas
 Imaging of the Liver
 Self-Parameterized Active Contours for Medical Image Segmentation with Emphasis on Abdomen
 Liver Segmentation Without Prior Statistical Models
 Surface Registration Using Ricci Flow


Related posts:
Approach to Detection and Characterization of Hepatic Hemangiomas
Resonance Imaging of Adenocarcinoma of the Pancreas
Imaging of the Liver
Self-Parameterized Active Contours for Medical Image Segmentation with Emphasis on Abdomen
Liver Segmentation Without Prior Statistical Models
Surface Registration Using Ricci Flow
Stay updated, free articles. Join our Telegram channel
Full access? Get Clinical Tree
