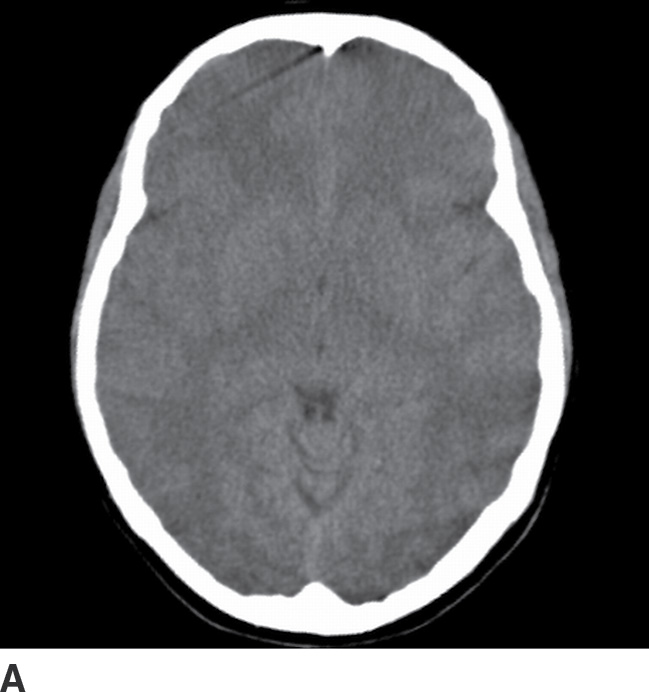
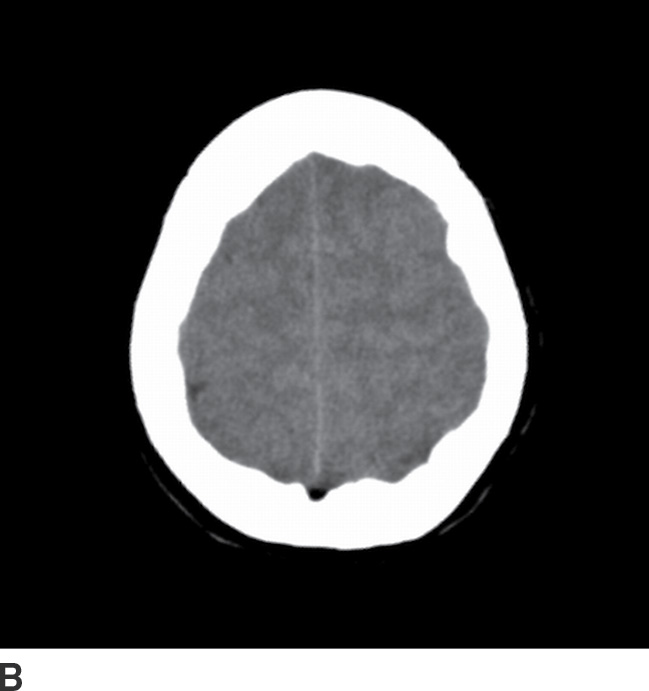
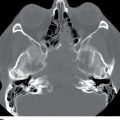
FIG. 6.1 Cerebral swelling in meningitis. Two axial images (A, B) from a noncontrast head CT demonstrate nearly completely effaced sulci. Even in young patients with healthy cerebral volumes, usually at least a few sulci are visible, particularly at the vertex (B) and in the perisylvian region (A).
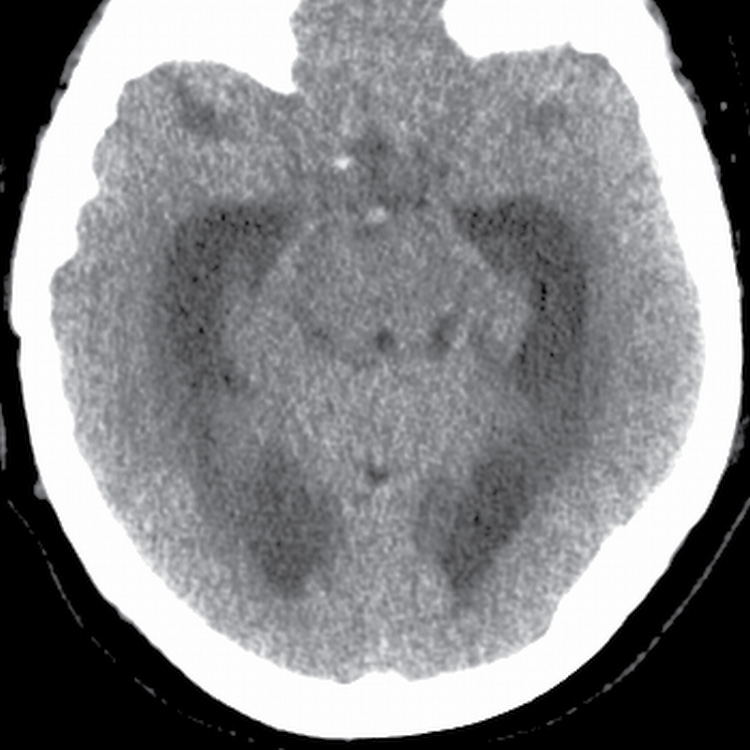
FIG. 6.2 Hydrocephalus in meningitis. Axial image from a noncontrast head CT demonstrates enlargement of the temporal and occipital horns of the lateral ventricles with periventricular hypoattenuation, consistent with transependymal edema. The temporal horns are often the first to dilate in early hydrocephalus. There is also partial sulcal effacement.
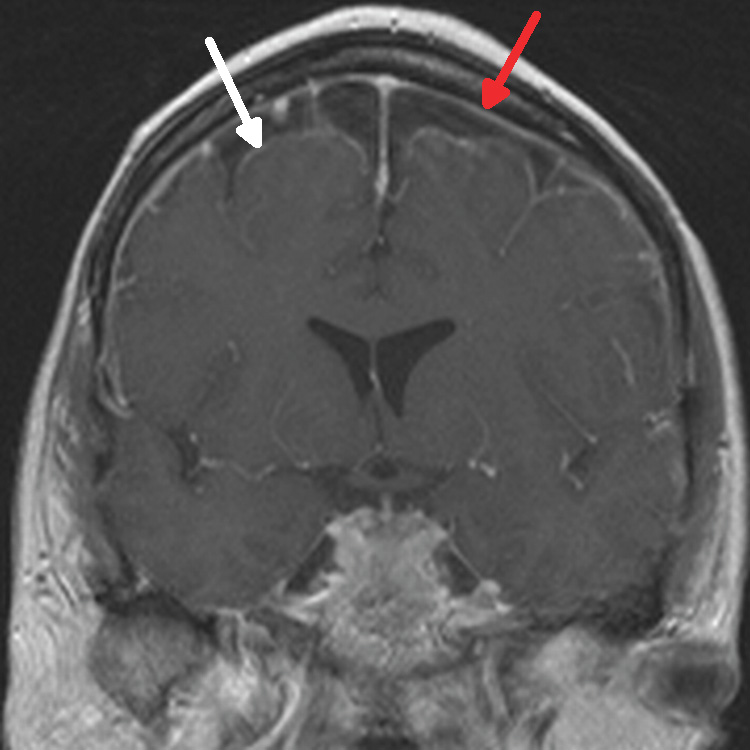
FIG. 6.3 Bacterial meningitis. Coronal, gadolinium-enhanced T1-weighted MRI image shows smooth leptomeningeal enhancement (white arrow) that extends along the surface of the brain into the cerebral sulci and continuous pachymeningeal enhancement (red arrow) underneath the inner calvarial surface.
Table 6.2 DIFFERENTIAL DIAGNOSIS OF ABNORMAL CSF SIGNAL ON FLAIR MRI
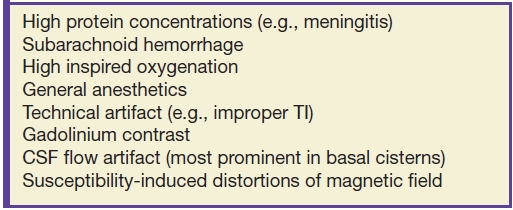
Table 6.3 DIFFERENTIAL DIAGNOSIS OF LEPTOMENINGEAL/PIA–SUBARACHNOID MENINGEAL ENHANCEMENT
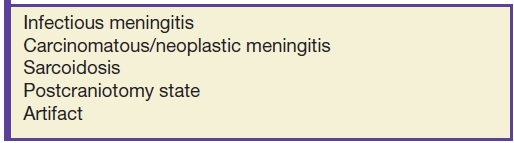
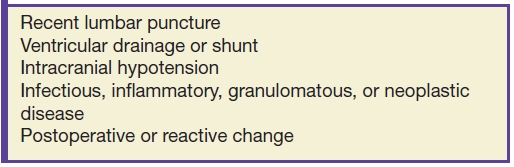
Table 6.4 DIFFERENTIAL DIAGNOSIS OF PACHYMENINGEAL/DURA–ARACHNOID MENINGEAL ENHANCEMENT
Viral Meningitis
Imaging studies are abnormal less often, with rare enhancement (8). Similar to bacterial meningitis, clinical findings include fever, chills, headache, photophobia, and nuchal rigidity. Unlike bacterial meningitis, profound alterations in consciousness and seizures generally do not occur (1). CSF analysis is often required to distinguish between viral and bacterial meningitis.
Fungal Meningitis and Tuberculous Meningitis
Patients generally have a more subacute presentation than in bacterial meningitis, with fever, malaise, and fatigue lasting for weeks (1). MRI findings overlap those of bacterial meningitis, with meningeal enhancement, hyperintense sulcal FLAIR signal, and hydrocephalus (Fig. 6.4). Fungal and tuberculous meningitides often present with thick basilar meningeal enhancement, similar to sarcoidosis (6,9). Coccidioidomycosis is a fungal meningitis endemic to the Southwestern United States. Histoplasmosis and blastomycosis are fungal infections endemic to the Midwestern United States. Cryptococcal meningitis is an opportunistic fungal infection of AIDS patients, which can present with nodular basilar leptomeningeal enhancement and/or gelatinous “pseudocysts” in the basal ganglia (Fig. 6.5) (10).
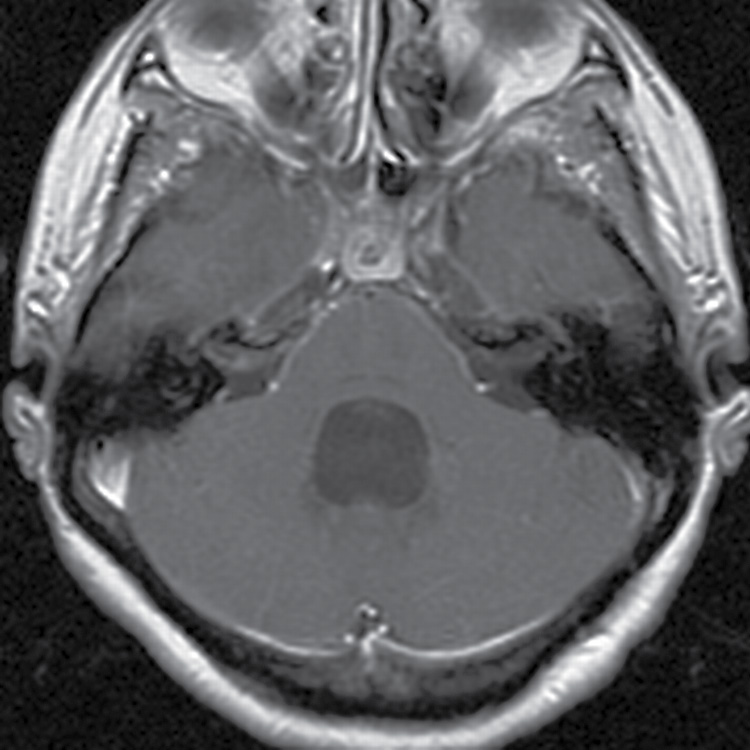
FIG. 6.4 Coccidioidomycosis meningitis. Axial, gadolinium-enhanced T1-weighted MRI image shows mildly nodular basilar leptomeningeal enhancement, extending into the right internal auditory canal, as well as hydrocephalus.
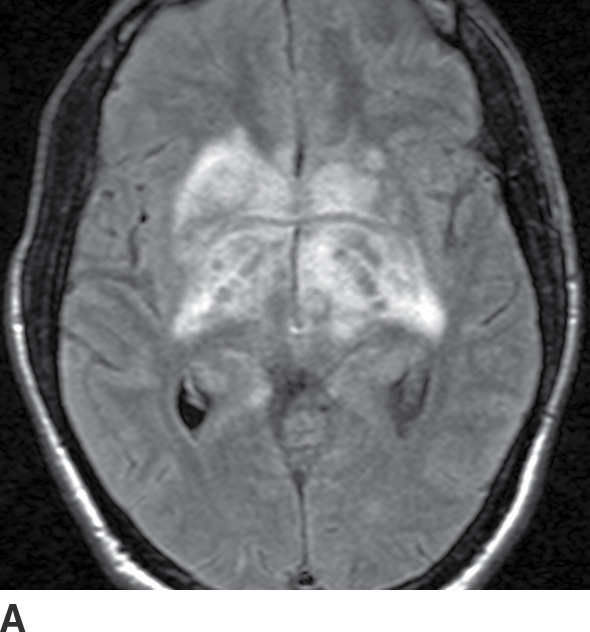
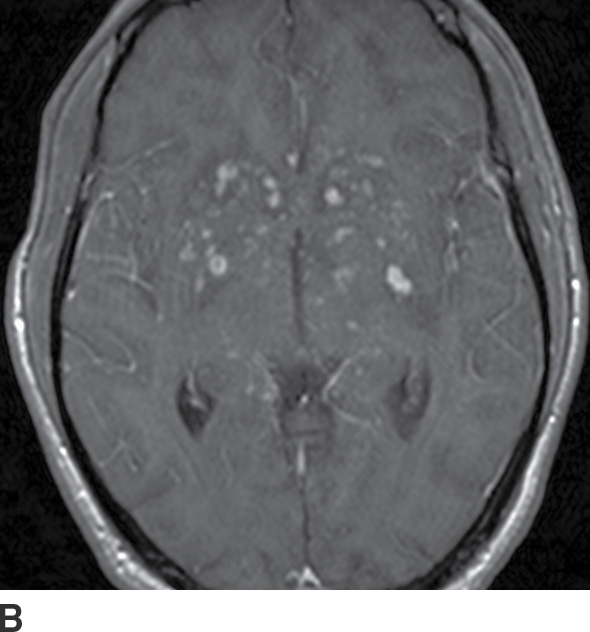
FIG. 6.5 Cryptococcal meningitis. A: Axial FLAIR MRI image demonstrates hyperintense edema in the basal ganglia, thalami, and deep white matter. B: Gadolinium-enhanced axial T1-weighted MRI image at the same level demonstrates associated nodular enhancement in the perivascular spaces at the base of the brain. There is also subtle nodular leptomeningeal enhancement.
Bacterial (Pyogenic) Abscess
Clinical findings
The classic triad consists of fever, headache, and focal neurologic deficit; however, with mature abscesses, patients may not have toxic signs or symptoms (1). Because many abscesses arise hematogenously, patients may have underlying risk factors such as endocarditis. Alternatively, direct spread from sinusitis or mastoiditis may be the cause. When edema and mass effect are significant, abscesses may present with seizures, altered sensorium, and papilledema (1).
Role of the radiologist
Neuroimaging is the definitive test to establish the diagnosis of bacterial abscess. The possibility of causative sinusitis or mastoiditis should also be evaluated.
Imaging findings (Table 6.5)
Table 6.5 IMAGING SUMMARY OF BACTERIAL (PYOGENIC) ABSCESS
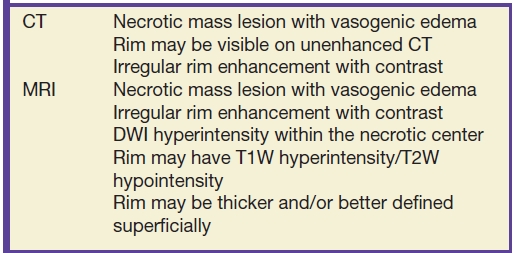
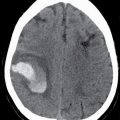
On noncontrast CT, the primary findings include focal mass effect and a vasogenic edema pattern, that is, white matter hypodensity that respects the cortical ribbon (11). While the rim of the mass may be visible even without contrast (Fig. 6.6A), intravenous contrast improves detection of an abscess because the rim avidly enhances. The deeper rim of the abscess may be thinner and/or less well defined due to asymmetric collagen deposition.
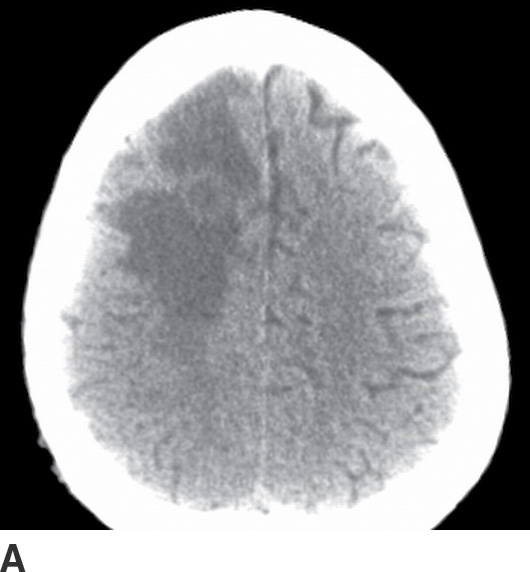
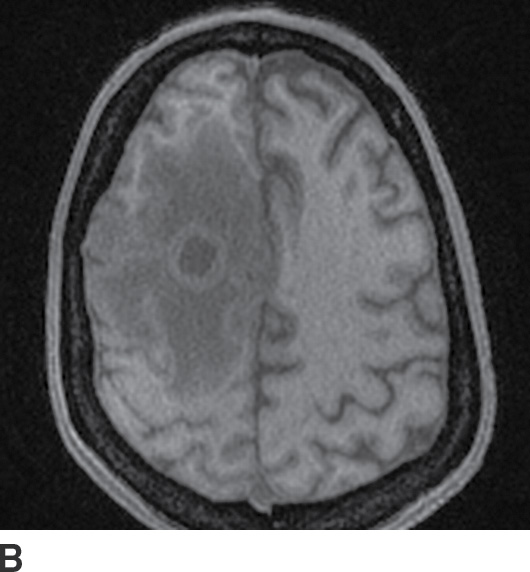
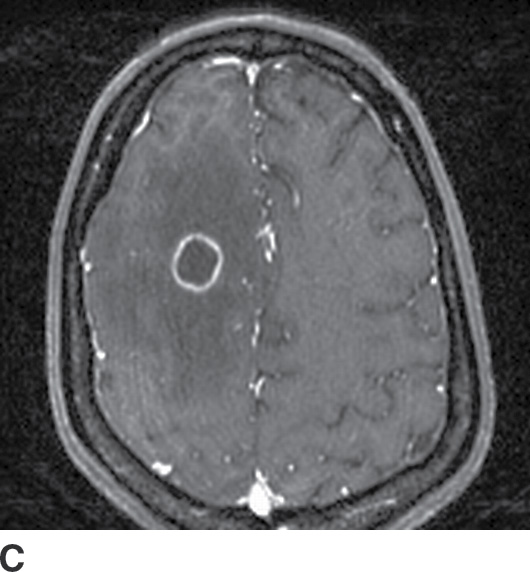
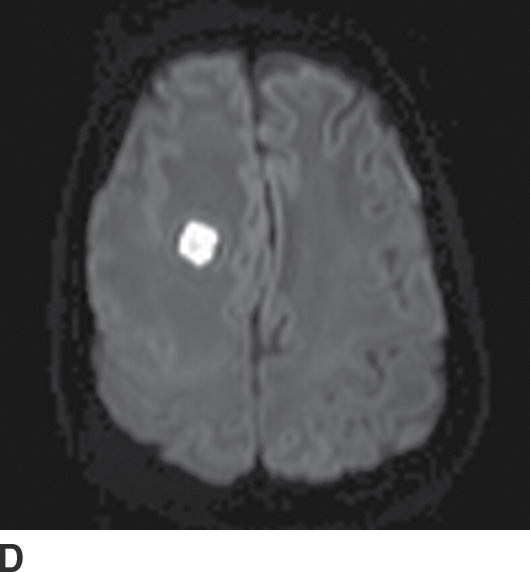
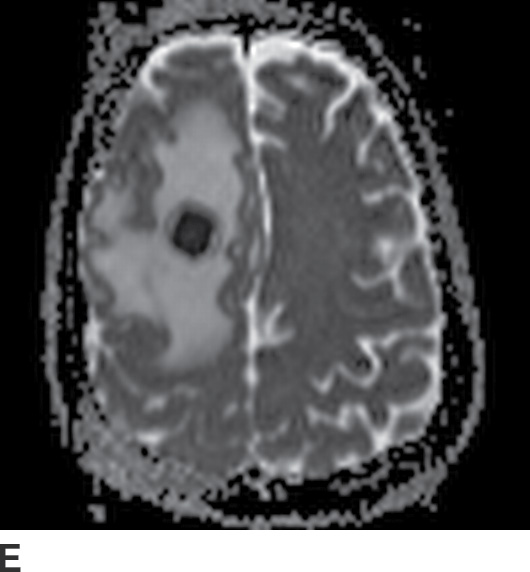
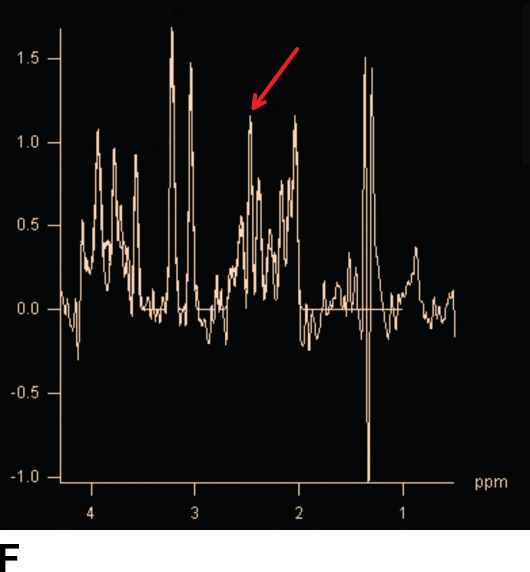
FIG. 6.6 Abscess. A: Noncontrast CT shows the isodense rim of the abscess. There is mass effect with effaced sulci and surrounding hypodense vasogenic edema. B,C: Noncontrast- and gadolinium-enhanced T1-weighted MRIs, respectively, show avid, smooth rim enhancement of the abscess. D: Diffusion-weighted MR imaging shows homogeneous hyperintensity in the center of the abscess. E: ADC maps show hypointensity, confirming true restricted diffusion. F: MRI spectroscopy shows an abnormal succinate peak (arrow) at 2.4 ppm.
MRI findings are similar to CT: focal mass effect, vasogenic edema, and a rim-enhancing mass (Fig. 6.6B,C)—but additional findings may add specificity. Careful examination of the rim signal on noncontrast imaging may reveal abnormal hyperintensity on T1-weighted images, and/or hypointensity on T2-weighted images, signal alterations thought to reflect blood products and/or free radicals in macrophages (12). Diffusion-weighted imaging (DWI) can be extremely helpful as the suppurative center of the abscess is typically very hyperintense (Fig. 6.6D) (13). This finding is less often present in other rim-enhancing masses, but the pattern is not completely specific; for example, noninfected hematomas can have similar “lightbulb”-bright DWI signal (Fig. 6.7) (14). Magnetic resonance spectroscopy (MRS) may add further specificity by revealing abnormal spectral peaks of acetate at 1.9 ppm and/or succinate at 2.4 ppm, markers of anaerobic metabolism (Fig. 6.6F) (12,15). Finally, if the abscess spreads outside of the brain parenchyma, findings of meningitis or ventriculitis (abnormal signal layering within the ventricles or ependymal enhancement) may be present (12).
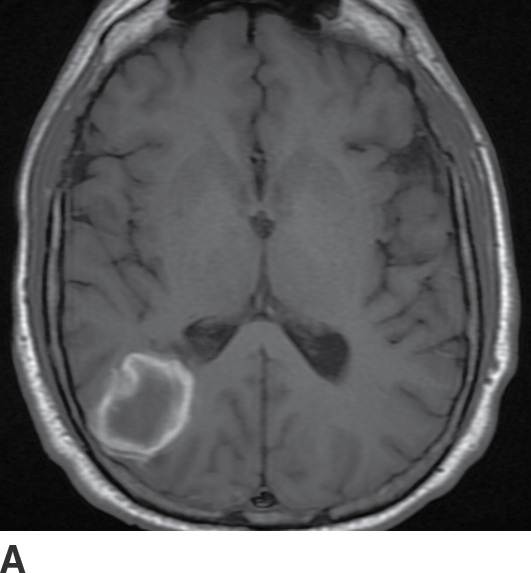
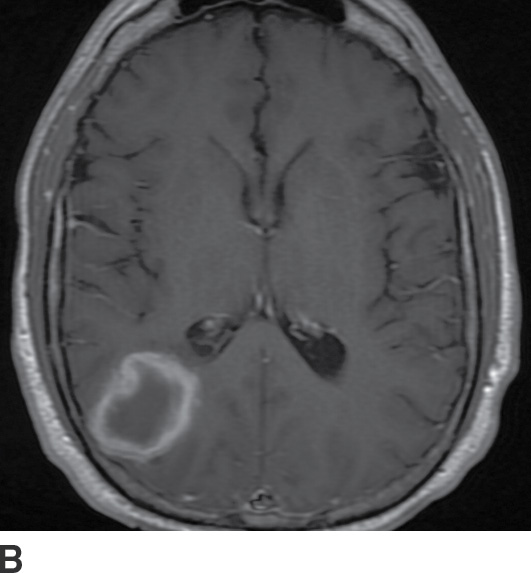
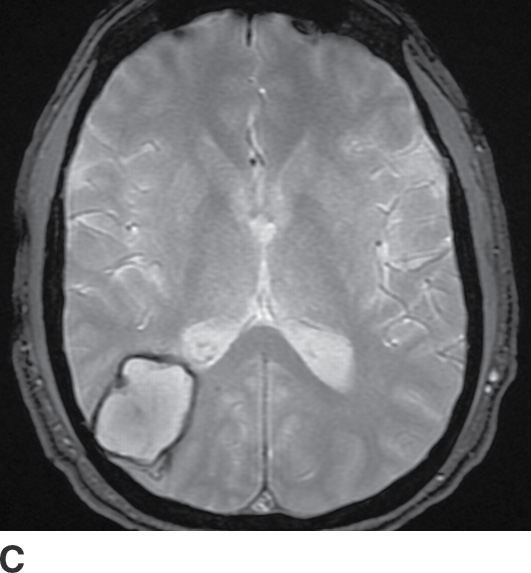
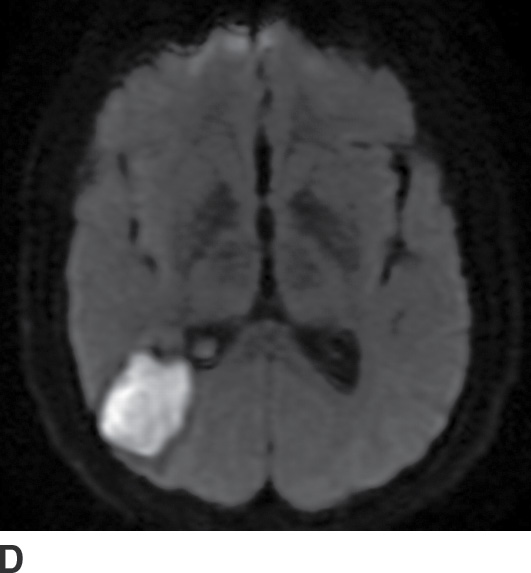
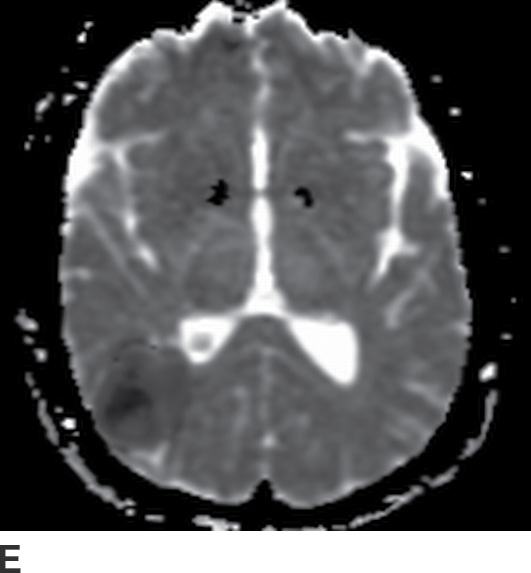
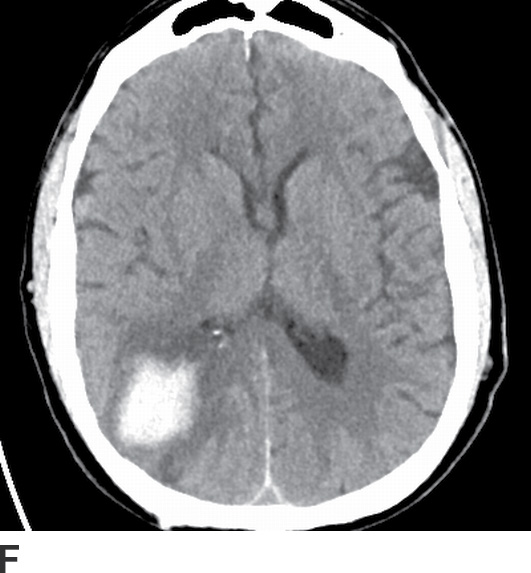
FIG. 6.7 Subacute hematoma. A: Axial noncontrast T1-weighted MR image shows hyperintensity around the periphery of the hematoma. B: Axial postcontrast T1-weighted MR image shows scant enhancement about the rim. C: Axial gradient-echo MR image shows hypointensity around the periphery of the hematoma, consistent with intracellular methemoglobin. D: Axial DWI shows a lightbulb-bright center to the hematoma. E: Axial ADC map shows hypointensity consistent with restricted diffusion. F: Axial CT performed 3 weeks earlier shows the hyperdense hematoma. While the axial DWI (D) may at first glance be confused for an abscess, evaluation of the other sequences allows for the correct diagnosis of subacute hematoma. The absence of parenchymal edema and the patient’s nontoxic clinical status militate against the possibility of an infected hematoma.
Bacterial Cerebritis
In this early stage of infection, CT and MRI may reveal focal edema but no rim-enhancing collection, as abscess organization has not yet occurred (11,12). Therefore, intravenous contrast is essential to distinguish cerebritis from abscess. DWI may show restricted diffusion, but the clinical presentation should allow discrimination from acute ischemic disease.
Fungal Abscess and Cerebritis
Patients are usually immunocompromised (1). Imaging findings overlap those of bacterial cerebritis (focal edema) and bacterial abscess (rim-enhancing mass surrounded by vasogenic edema), although the enhancement of a fungal abscess may only be slight in the severely immunocompromised (Fig. 6.8) (12). Detection of small hemorrhages in the abscess rim with gradient-echo imaging can be a helpful sign, particularly with invasive fungal infection. DWI often shows restricted diffusion (16).
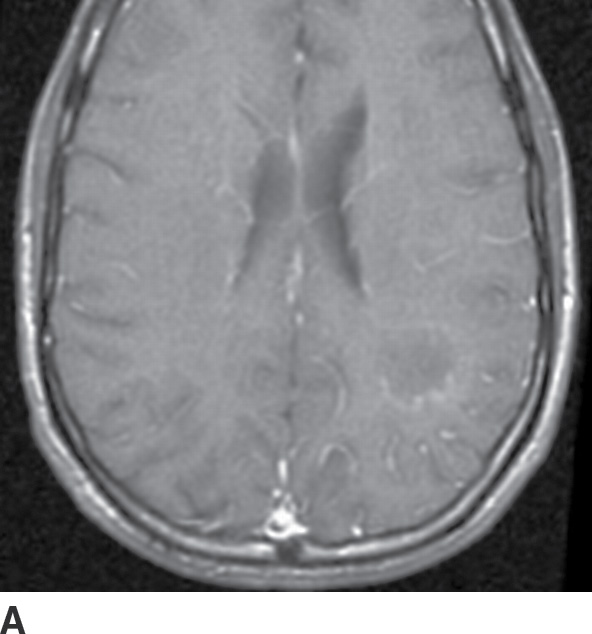
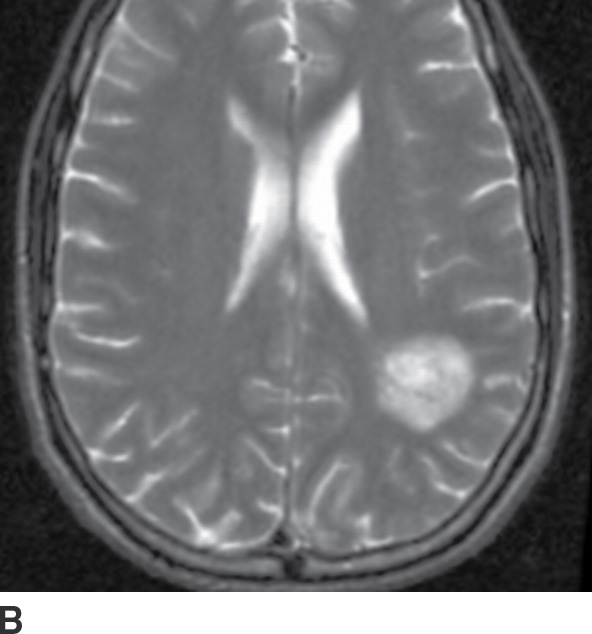
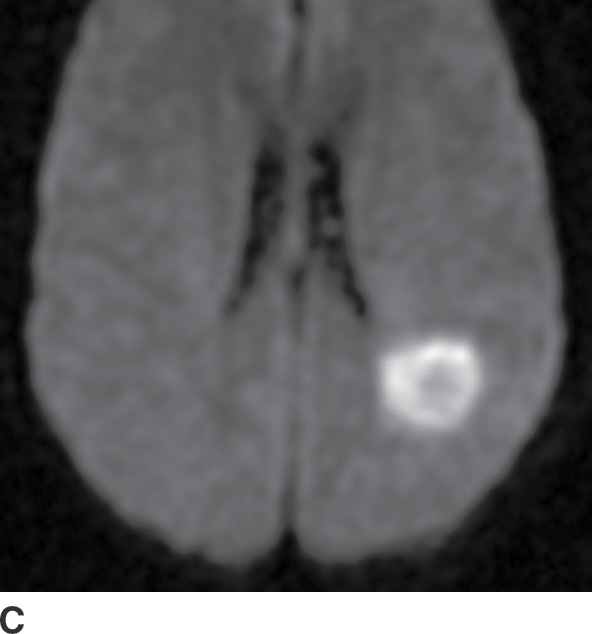
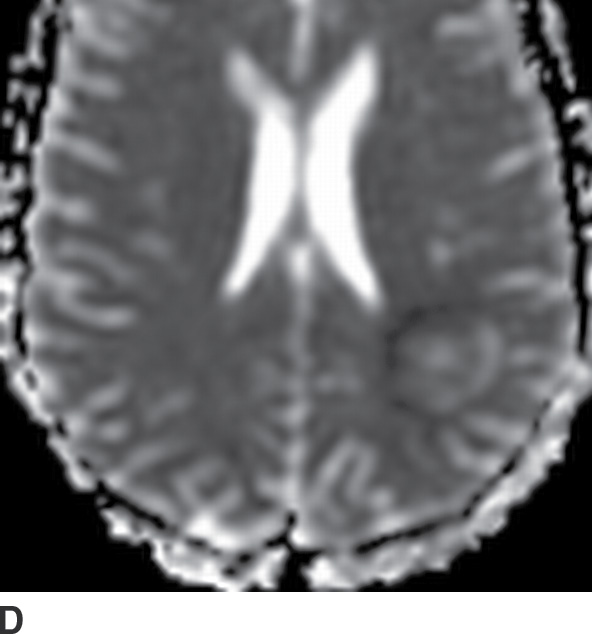
FIG. 6.8 Aspergillus abscess. This 25-year-old man had a history of acute lymphocytic leukemia and bone marrow transplant. A: Postcontrast T1-weighted axial MRI image shows scant rim enhancement of the abscess. B: T2-weighted axial MRI image shows heterogeneous foci of hypointense signal, perhaps reflecting small hemorrhagic foci. C,D: DWI and ADC map, respectively, show heterogeneous restricted diffusion within the abscess.
Tuberculous Granuloma (Tuberculoma) and Tuberculous Abscess
Parenchymal involvement by tuberculous infection occurs uncommonly (1). Tuberculomas have a variety of appearances on CT and MRI, and enhancement patterns that range from solid to rim-enhancing depending upon the state of caseation and liquefaction. A “target” appearance on CT with a calcified center and rim enhancement has been described. Liquefied, rim-enhancing tuberculous abscesses are rare. While they tend to be larger and more often multiloculated, abscesses may be difficult to distinguish from caseating tuberculomas (9).
Epidural Abscess and Subdural Empyema
Clinical findings
The classic presentation for both includes headaches and fever (1). With subdural empyema, encephalopathy (altered sensorium, focal neurologic deficits), papilledema, or seizures may also be present, as the dura cannot shield the brain from infection. Prior craniotomy, sinusitis, and mastoiditis may be causative risk factors for both. Meningitis is a risk factor for subdural empyema in children.
Role of the radiologist
Neuroimaging is the most important diagnostic test to establish the diagnosis of extra-axial infections and dictate further treatment. Because of the ease with which infection can spread in the subdural space and the rapidity at which the patient’s clinical course may deteriorate, subdural empyema is considered a neurosurgical emergency (1), and the referring provider should be contacted immediately when this diagnosis is suspected.
Imaging findings (Table 6.6)
Table 6.6 IMAGING SUMMARY OF EPIDURAL ABSCESS AND SUBDURAL EMPYEMA
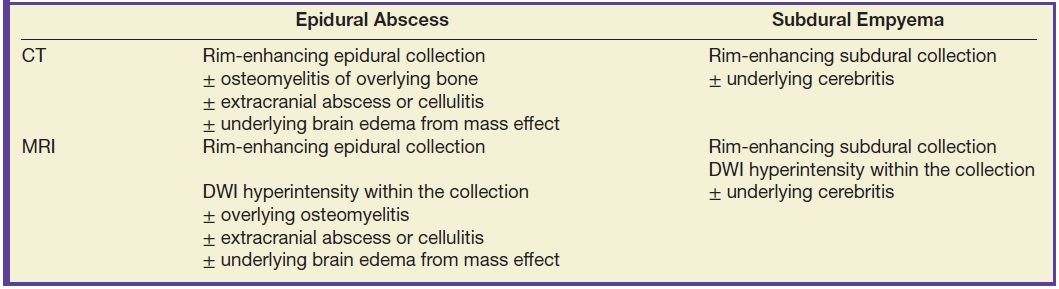
With contrast, the infected extra-axial collection shows prominent rim enhancement, frequently better seen with MRI than CT (Figs. 6.9 to 6.11) (12). With epidural abscess, anatomic areas that require additional evaluation include the overlying bone (for osteomyelitis) and scalp (for abscess, or drainage to the skin), as well as the underlying meninges (for meningitis). Brain edema can be seen with either subdural empyema or epidural abscess due to mass effect, but actual cerebritis is more typical of subdural empyema (12). Similar to parenchymal abscesses, DWI usually shows high signal (due to restricted diffusion) (12), which, along with rim enhancement, is a helpful clue to distinguish sterile subdural effusions from infected empyemas.
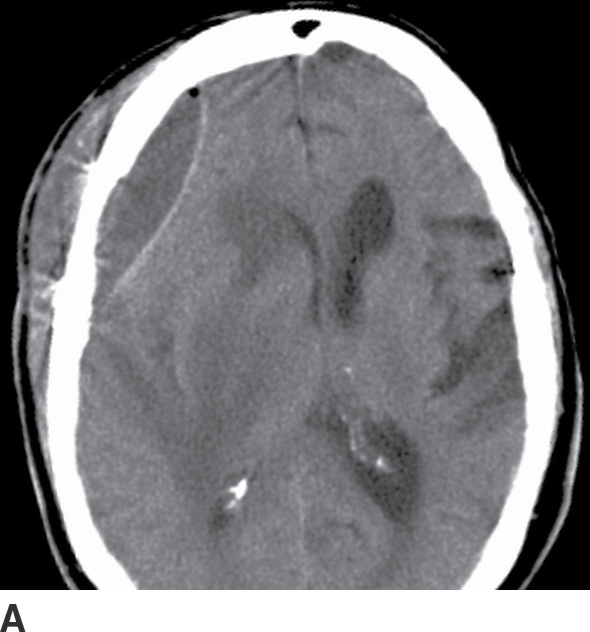
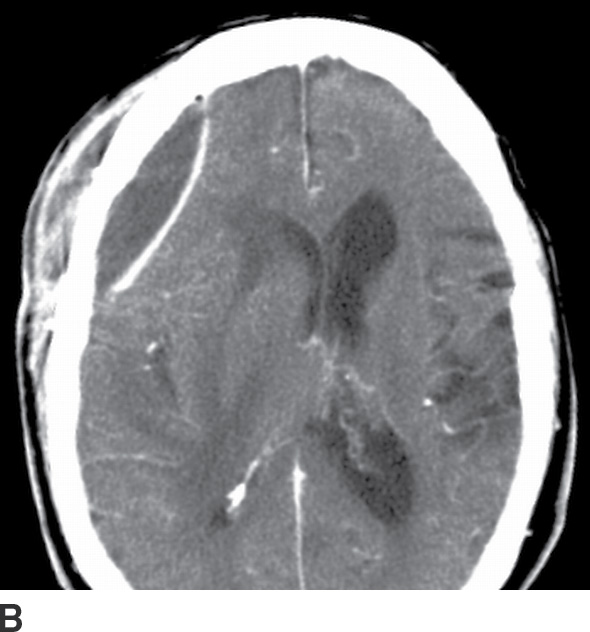
FIG. 6.9 CT of postoperative epidural abscess. This patient presented with a wound infection at the site of prior meningioma resection. A: Unenhanced CT shows an epidural fluid collection with a small focus of air and mass effect on the brain. B: Enhanced CT shows prominent smooth rim enhancement. Also note the rim-enhancing abscess in the extracranial scalp.
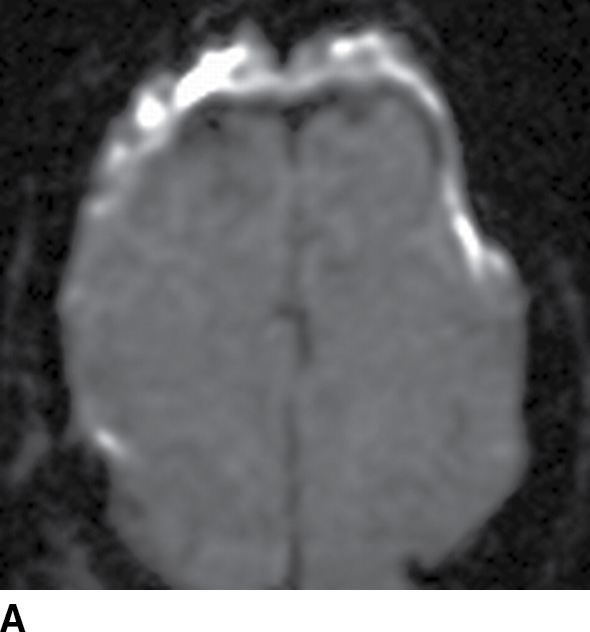
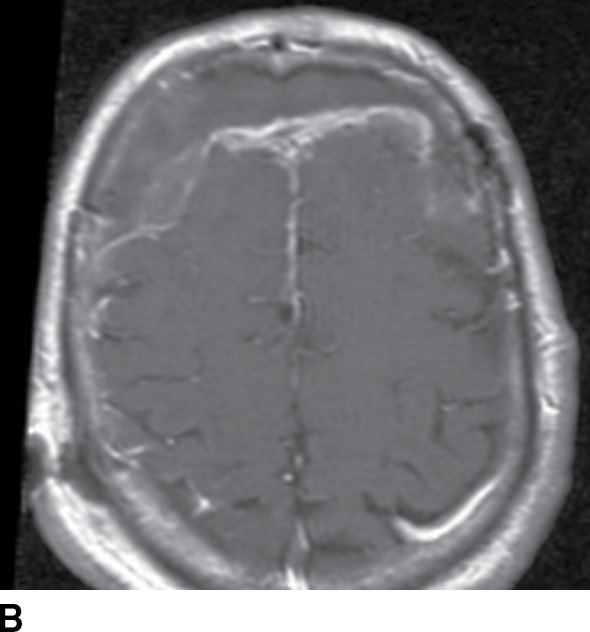
FIG. 6.10 MRI of postoperative epidural abscess. A: DWI shows hyperintensity due to restricted diffusion in a bifrontal epidural collection. B: Gadolinium-enhanced T1-weighted MRI image shows thick irregular rim enhancement. Prior craniotomy changes are also visible.
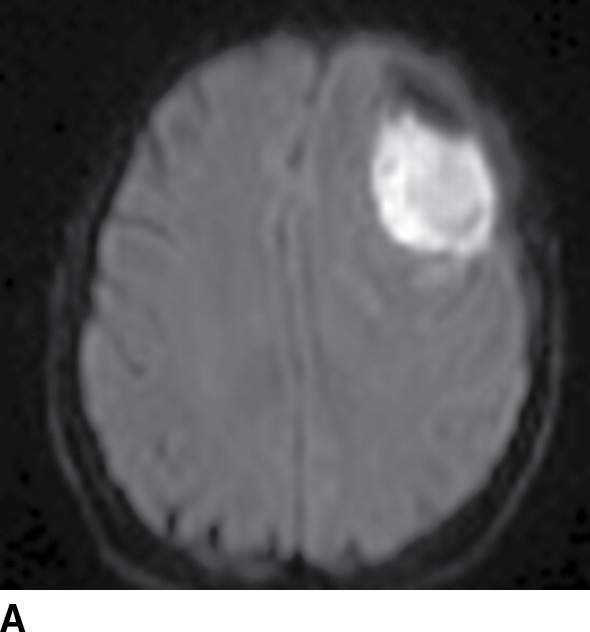
FIG. 6.11 MRI of subdural empyema. A: A focal subdural fluid collection over the left frontal convexity shows DWI hyperintensity. B: Gadolinium-enhanced axial T1-weighted MRI image shows thin rim enhancement medially of the arachnoid, with thicker enhancement laterally of the dura.
Herpes (HSV1) Encephalitis
Clinical findings
Herpes encephalitis presents as a rapidly progressing illness, with fever, headache, encephalopathy (confusion, altered level of consciousness), focal neurologic deficits, abnormal behavior, and seizures (1).
Role of the radiologist
Given the efficacy of early treatment with acyclovir, it is essential for the radiologist to contact the ordering provider whenever neuroimaging suggests herpes encephalitis, in case acyclovir treatment hasn’t already been initiated based on clinical suspicion.
Imaging findings (Table 6.7)
Table 6.7 IMAGING SUMMARY OF HERPES ENCEPHALITIS
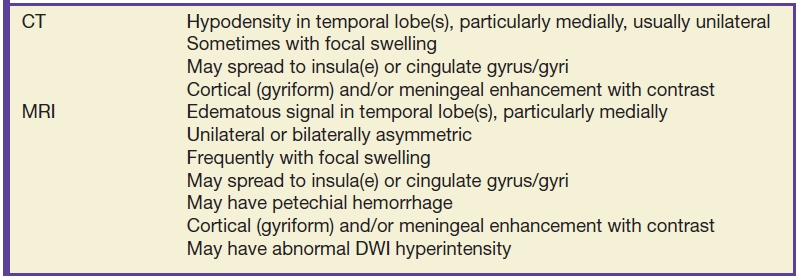
Herpes encephalitis can present with a normal CT, but sometimes, subtle hypodensity is visible in one or both of the medial temporal lobes, sometimes with focal swelling and sometimes with edema spreading to the ipsilateral cingulate gyrus and insula (Fig. 6.12) (17). Postcontrast images can show ill-defined enhancement, and follow-up imaging may show hemorrhage.
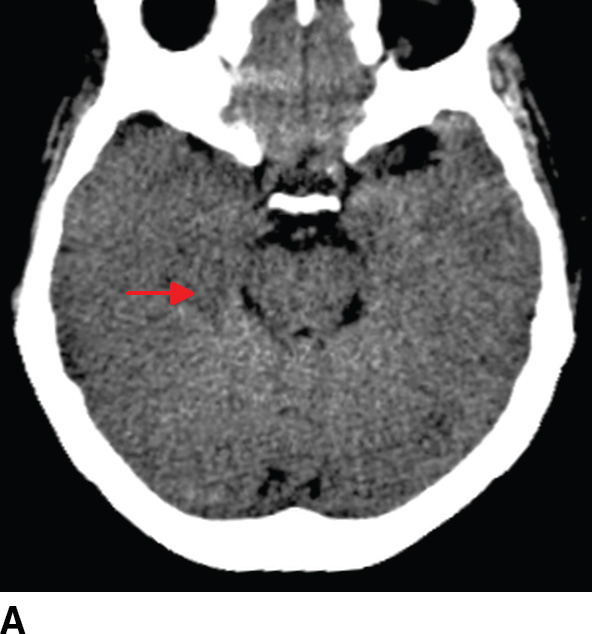
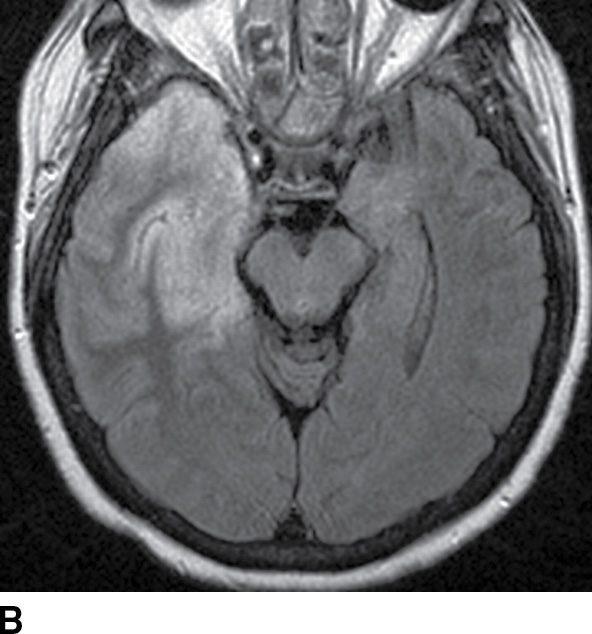
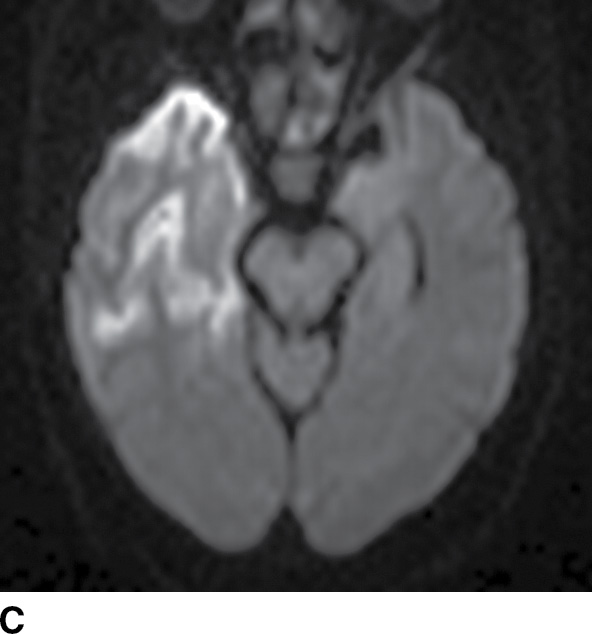
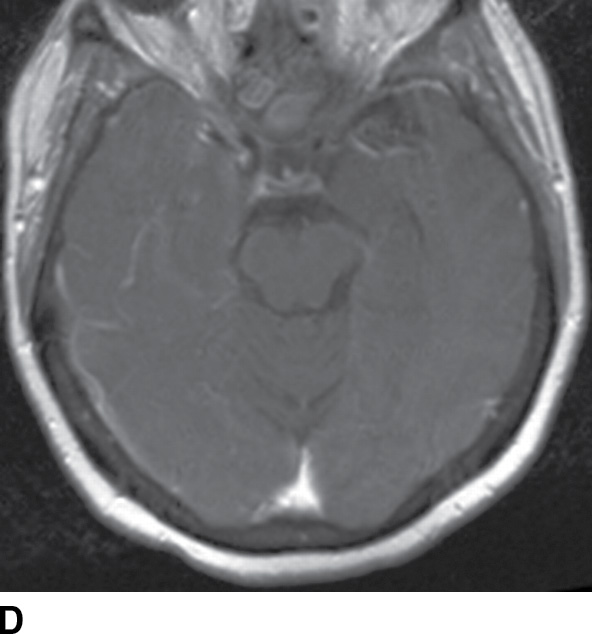
FIG. 6.12 Herpes encephalitis. A: Axial noncontrast CT shows subtle hypodensity in the medial right temporal lobe (arrow). B: FLAIR MR image shows edema in the right temporal lobe and possible subtle edema in the left medial temporal lobe. C: DWI shows hyperintensity, consistent with restricted diffusion, in the right temporal cortex. D: Gadolinium-enhanced axial T1weighted image shows mild cortical (gyriform) enhancement.
MRI is more sensitive and similarly shows edema with FLAIR–T2 hyperintensity in one or both temporal lobes, insulae, and cingulate gyri. When involvement is bilateral, it is usually asymmetric (Fig. 6.13) (17,18). Enhancement is ill-defined but can be cortical or “gyriform” in appearance or sometimes leptomeningeal. Sequences sensitive to susceptibility artifacts (GRE, SWI) can show small hypointense foci of hemorrhage (“petechial”). DWI often shows restriction compared to brain parenchyma (hyperintensity on DWI, hypointensity on ADC maps) (17), which should not be confused with arterial infarction. Because other diseases may involve the temporal lobe, including neoplasm (especially glioma), parenchymal edema from status epilepticus, and paraneoplastic syndromes, prompt discussion with the ordering physician is essential for appropriate patient management.
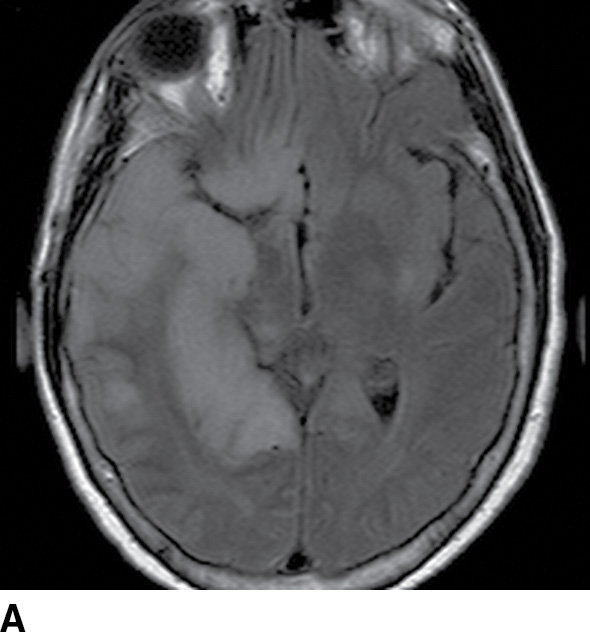
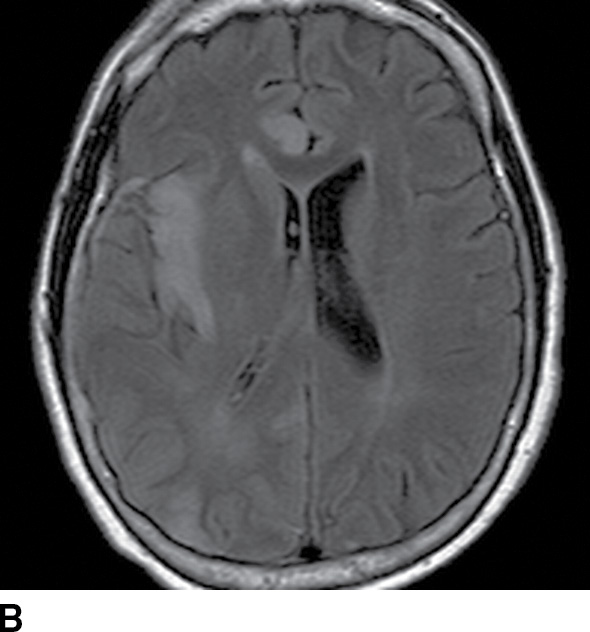
FIG. 6.13 Herpes encephalitis spreading through the limbic system. A: Axial FLAIR MR image at the level of the third ventricle shows hyperintensity consistent with edema in the right temporal and inferior frontal lobes. B: Axial FLAIR MR image at a higher level shows that there is also involvement of the right insula and right cingulate gyrus. The right parietal lobe is also involved.
Flavivirus Encephalitides
These are a group of encephalitides transmitted by mosquitoes, including West Nile virus, eastern equine virus, Japanese encephalitis virus, La Crosse virus, St. Louis encephalitis virus, and western equine encephalitis virus.
Clinical findings
Patients present with fever, headache, altered level of consciousness, and seizures, often preceded by flulike illness (1). The disease incidence varies greatly with geographic location and seasonality; for example, La Crosse encephalitis is primarily found in the Midwestern Unites States, Japanese encephalitis in East Asia, and eastern equine encephalitis along the East Coast of the United States. In 2012, West Nile virus was the leading cause of arboviral disease in the United States (19).
Role of the radiologist
Neuroimaging is generally used to help suggest these diagnoses and/or to evaluate for alternative diagnoses such as abscess, HSV1 encephalitis, or acute disseminated encephalomyelitis (ADEM). If MRI findings suggest viral encephalitis, communication to the referring physician should help narrow the differential diagnosis (see below).
Imaging findings (Table 6.8)
Table 6.8 IMAGING SUMMARY OF FLAVIVIRUS ENCEPHALITIS
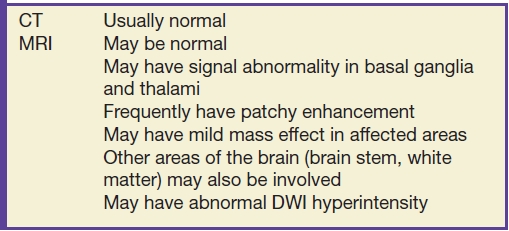
The imaging patterns of these viral encephalitides are varied but do share some similarities (8). CT is usually normal. MRI may show hyperintense foci on T2-weighted and FLAIR images, most often in the bilateral deep gray nuclei (thalami, caudate nuclei, and/or lentiform nuclei [Fig. 6.14]). Other areas of the brain may also be involved, including the brainstem and supratentorial white matter, and there may be mild associated mass effect. The differential diagnosis of diseases that affect the deep gray nuclei is broad and includes toxic and metabolic disease, vascular disease, degenerative disease, and status epilepticus (20).
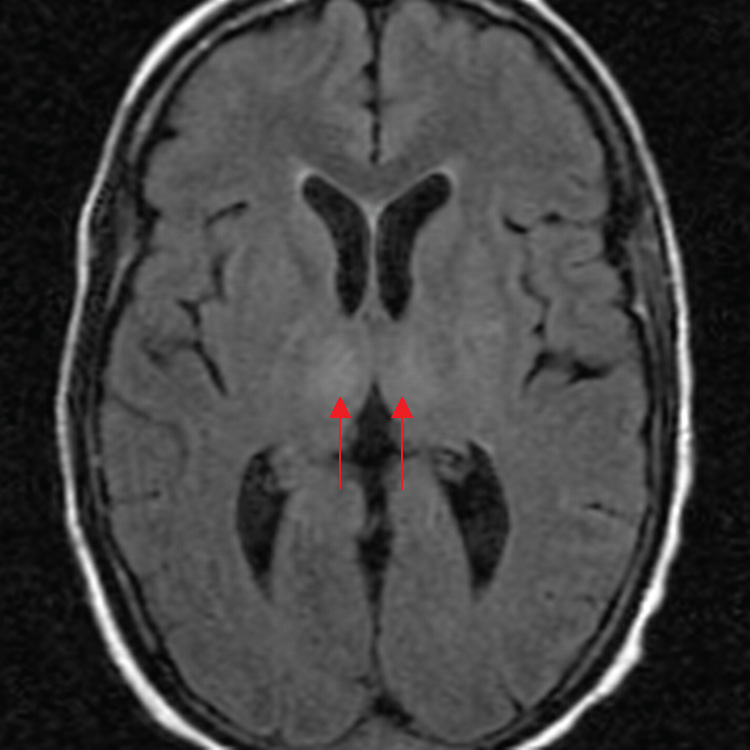
FIG. 6.14 West Nile virus encephalitis. An axial FLAIR MR image shows relatively symmetric hyperintensity in the bilateral thalami (arrows).
Creutzfeldt-Jakob Disease
Clinical findings
The classic presentation for sporadic Creutzfeldt-Jakob disease (sCJD), caused by the prion agent, PrPSc, is a rapidly progressive dementia, ataxia, and myoclonus in an older adult (approximately 60 years old). The time course is usually over several weeks, although occasionally more acute. Other clinical manifestations include extrapyramidal features, upper motor neuron disease, akinetic mutism, and visual deficits (1,21). Variant Creutzfeldt-Jakob disease (CJD) is a newer form with a different presentation, often affecting younger individuals, and with a slower progression of disease (22). Early symptoms include psychiatric disturbances and dysesthesias, which are followed by ataxia, dementia, and myoclonus. There is strong evidence linking the disease with bovine spongiform encephalopathy.
Role of the radiologist
Brain biopsy remains the definitive test for diagnosis; however, the imaging findings of CJD on MRI are an important component in the noninvasive diagnostic criteria for “probable” CJD, as published by the Centers for Disease Control and Prevention (21,22), along with EEG findings and CSF analysis for 14-3-3 protein.
Imaging findings (Table 6.9)
Table 6.9 IMAGING SUMMARY OF CREUTZFELDT-JAKOB ENCEPHALITIS
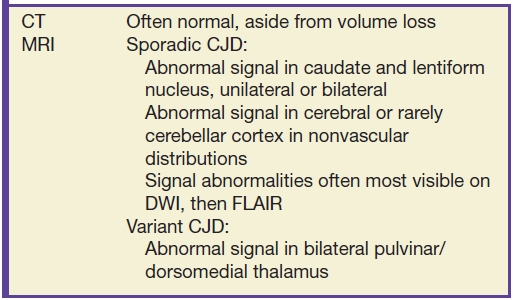
In sporadic CJD, the most common finding is DWI and FLAIR signal abnormality in the corpus striatum (caudate and putamen) (23). The thalamus and the cortex of the cerebrum and much less commonly the cerebellum may also be involved. These signal alterations are generally best visualized on DWI, followed by FLAIR images (Fig. 6.15). While the cortical DWI hyperintensity at first may be confused with arterial infarction, the distribution does not respect vascular territories and does not involve subcortical white matter, allowing for distinction. In variant CJD, abnormal signal in the bilateral pulvinar and/or dorsomedial thalamus (“hockey-stick sign”) suggests the diagnosis (24). While suggestive, these MRI findings are not, in isolation, completely specific for CJD—metabolic disease, vascular disease, status epilepticus, and other encephalitides may share similar features. Therefore, consultation with the referring physician is warranted.
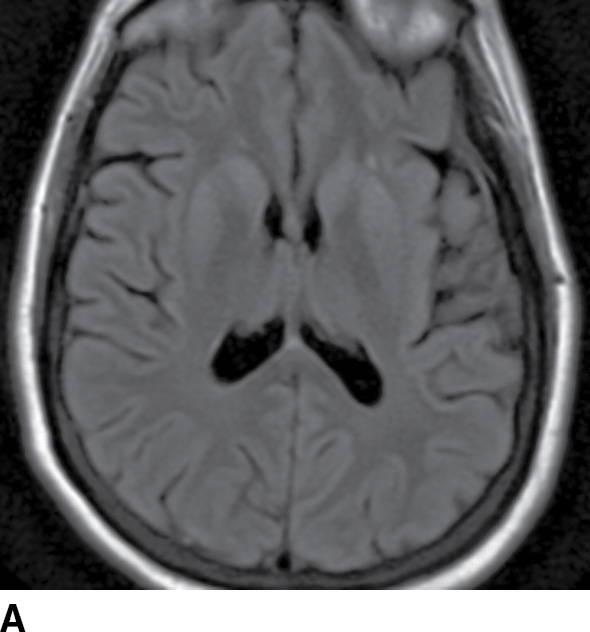
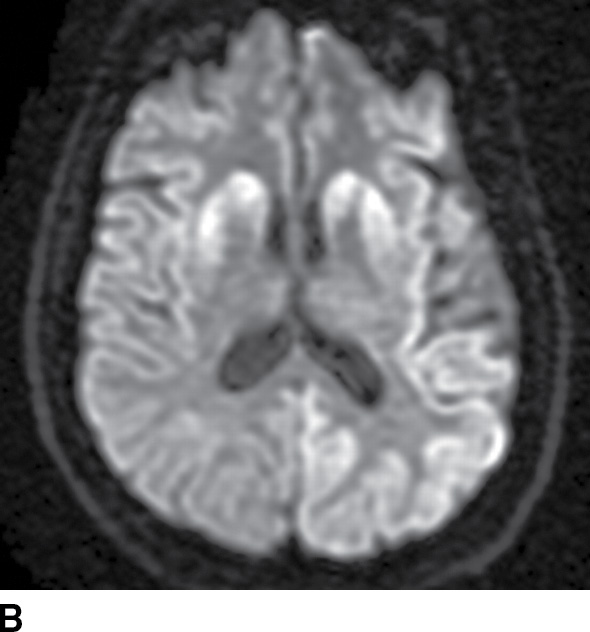
FIG. 6.15 Creutzfeldt-Jakob disease. A: FLAIR MR image shows subtle hyperintensity of the caudate and putamen bilaterally. There is also subtle hyperintensity of the posterior left cerebral cortex. B: The striatal and cerebral cortical abnormalities are much more visible on DWI.
HIV-Associated Viral Disease: HIV Encephalopathy, Cytomegalovirus Encephalitis, Progressive Multifocal Leukoencephalopathy
These diseases constitute a common imaging differential of nonmass lesions in HIV patients.
Clinical findings
HIV encephalopathy presents with a progressive subcortical dementia (1,25). Cytomegalovirus (CMV) encephalitis primarily occurs in immunocompromised patients, particularly those with AIDS and CD4 counts below 100/μL, and presents with acute encephalopathy, delirium, and confusion. Progressive multifocal leukoencephalopathy (PML) (caused by the JC virus) is similarly a disease of immunosuppressed patients, most importantly AIDS (again with CD4 count less than 100/μL), but has a myriad of presentations, including changes in level of consciousness, cognition, vision, gait, motor function, and/or sensation. Although many PML patients have AIDS, some do not; indeed, one recently described cohort at risk for developing PML comprises patients with multiple sclerosis (MS) who are treated with the immunomodulatory agent natalizumab (see IRIS later) (26).
Role of the radiologist
Neuroimaging is the key diagnostic test in the evaluation of HIV patients who present with encephalopathy (25), and the radiologist’s primary job is to exclude a mass lesion. The diagnosis of PML should also be considered in any patient with characteristic imaging findings and significant immunocompromise or history of natalizumab treatment.
Imaging findings (Table 6.10)
Table 6.10 IMAGING SUMMARY OF HIV ENCEPHALITIS, CMV ENCEPHALITIS, AND PML ENCEPHALITIS
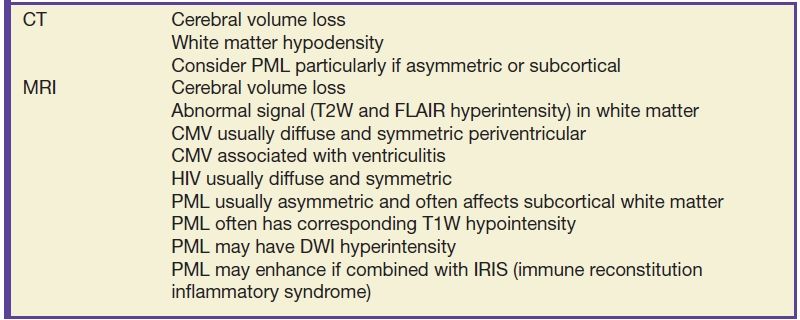
In all of these viral entities, neuroimaging can show volume loss and white matter signal abnormalities, including hypodensity on CT and hyperintensity on FLAIR and T2-weighted MRI (25). In HIV encephalopathy or CMV encephalitis, the white matter abnormalities tend to be symmetric (Fig. 6.16) (27). In CMV encephalitis, postcontrast images may also show nodular ependymal and/or meningeal enhancement; less commonly, there may be hydrocephalus or mass lesions (28). On the other hand, white matter lesions in PML are asymmetric and show hypointensity on T1-weighted images, features that help distinguish them from the lesions of HIV encephalopathy (Fig. 6.17) (29). PML may involve the posterior fossa and deep gray matter nuclei as well. Classically, the lesions of PML do not enhance; however, faint enhancement can be seen, which may be related to superimposed immune reconstitution inflammatory syndrome (IRIS) (see separate section on IRIS).
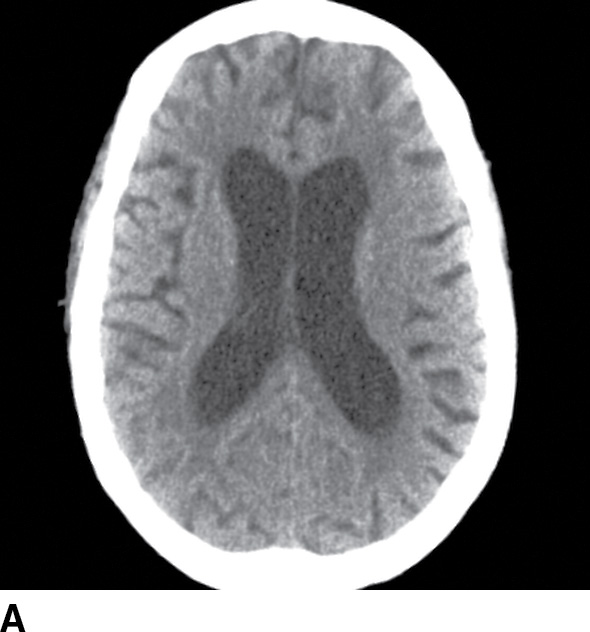
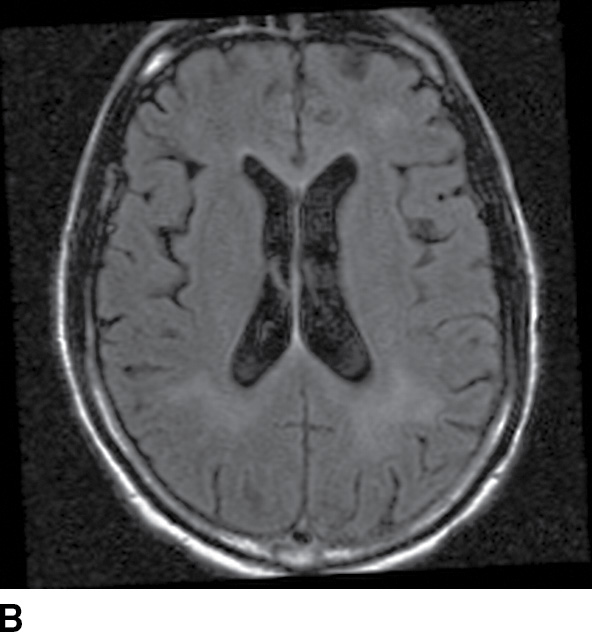
FIG. 6.16 HIV encephalopathy. A: Axial noncontrast CT in a 42-year-old woman with HIV shows volume loss greater than expected for age, and bilaterally symmetric hypodensities in the cerebral white matter. B: Axial FLAIR MRI image in another young HIV patient shows similar findings, with bilateral hyperintense signal abnormality in the periventricular white matter.
Related posts:
Stay updated, free articles. Join our Telegram channel

Full access? Get Clinical Tree


