Magnetic Resonance Imaging Tissue Parameters
Objectives
At the completion of this chapter, the student will be able to do the following:
Key Terms
It is essential to understand the following three principal parameters that are inherent properties of biological tissues and which make possible the soft tissue image contrast, for which MRI is known. These three inherent parameters of magnetic resonance imaging (MRI) are proton density (PD), T1 relaxation time, and T2 relaxation time. Each is fundamentally different from and independent of the others.
Images of each of these parameters can only be produced indirectly, using image processing methods to calculate these parameters from the data from several acquired images. However, images weighted by each of these parameters are routinely produced by carefully selecting the type of radiofrequency (RF) pulse sequence and the RF pulse times, which include repetition time (TR), time-to-echo (TE), and inversion-delay time (TI). Such images are identified as proton density weighted (PDW), T1 weighted (T1W), and T2 weighted (T2W) according to which parameter is emphasized.
Proton Density
The amplitude of the net magnetization is related to several parameters, as previously described in Chapter 3. It is reasonable to expect that one of the parameters that affects the amplitude of the magnetic resonance (MR) signal might be the number of hydrogen nuclei within the volume of the sample. If no hydrogen nuclei are present, no signal should be expected. Conversely, if the sample is rich in hydrogen, a strong MR signal may be expected. Voxels with high hydrogen concentration or proton density (PD) appear bright. This reasoning holds true only to a certain extent.
MRI signal amplitude depends on the presence or absence of hydrogen nuclei and is also sensitive to the environment of the hydrogen nuclei. How hydrogen is bound within a molecule also influences the amplitude of the MR signal.
The signal from tightly bound hydrogen dephases and disappears very quickly. Therefore the typical MR signal received originates from loosely bound hydrogen nuclei, which are called mobile hydrogen. Hydrogen nuclei found in liquids are mobile.
An example of this effect is bone. Cortical bone appears black on an MR image because its MR signal is totally dephased before the receiver is turned on. This is not due to the absence of hydrogen; rather, the hydrogen nuclei are tightly bound to the molecule. As a result, bone typically looks like air, which has a low hydrogen concentration. However, medullary bone is visible because of the fat located in the spaces between the trabeculae and in the marrow cavities.
PD is the measure of the concentration of mobile hydrogen nuclei available to produce an MR signal. The higher the concentration of mobile hydrogen nuclei, the stronger the net magnetization at equilibrium (M0) and the more intense the MR signal. A strong MR signal results in a better MR image.
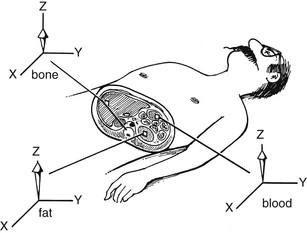
Figure 6-1 shows three pixels highlighted in the cross section of the patient. Each represents a voxel containing different tissue with different concentrations of mobile hydrogen nuclei. The tissue with the highest proton density (PD) also has the largest value of M0. Table 6-1 shows averages of relative values of PD for several tissues.
TABLE 6-1
Approximate Values of Mobile Hydrogen Nuclei Spin Density for Various Tissues
| Tissue | Relative Spin Density |
| Muscle | 90 |
| White matter | 60 |
| Fat | 95 |
| Cerebrospinal fluid | 100 |
| Kidney | 95 |
| Gray matter | 70 |
| Spleen | 90 |
| Liver | 90 |
| Blood | 85 |
| Cortical bone | 1-10 |
| Lung | 1-5 |
| Air | <1 |
Although a large M0 is necessary for a strong MR signal, the MZ is undetectable. In an MRI system, the receiver detects only the XY component of net magnetization—MXY. Because MXY is zero at equilibrium, no MR signal is received. Patients whose nuclei are at equilibrium do not emit an MR signal. The net magnetization must have a component in the XY plane to produce an MR signal.
T1 Relaxation Time
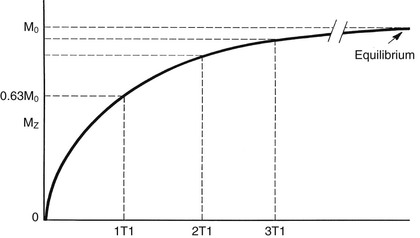
When a patient is positioned in the magnetic field of an MRI system, the net magnetization of the patient does not change instantly. In fact, the MZ changes rapidly at first and then relatively slowly (Figure 6-2; see also Appendix A). The longitudinal magnetization, MZ, reaches equilibrium after approximately five T1 relaxation times.
Once equilibrium is reached and MZ equals M0, this condition of net magnetization continues indefinitely unless the spins are disturbed. If the magnet is turned off or the patient is removed from the magnetic field, the individual nuclear magnetic moments reposition randomly. This causes the net magnetization along the Z-axis to disappear, so MZ returns to zero (Figure 6-3).
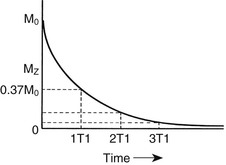
The time constant that describes the rate at which MZ returns to M0 is the T1 relaxation time. For tap water, T1 is about 2500 ms. For tissue in vivo, T1 can be as short as 100 ms for fatty tissues and as long as 2000 ms for bodily fluids such as cerebrospinal fluid (Table 6-2).
TABLE 6-2
Approximate T1 Relaxation Times (in ms) at Three B0 Field Strengths for Various Tissues
| Tissue | 0.35 Tesla | 1.5 Tesla | 3.0 Tesla |
| Adipose | 200 | 260 | 290 |
| Liver | 285 | 495 | 640 |
| Renal cortex | — | 1000 | 1150 |
| Renal medulla | — | 1300 | 1550 |
| Spleen | 485 | 780 | 985 |
| White matter | 500 | 650 | 800 |
| Gray matter | 800 | 1200 | 1500 |
| Muscle | 500 | 1000 | 1400 |
| Heart muscle | 525 | 870 | 1100 |
| Oxygenated blood* | 900 | 1350 | 1650 |
| Deoxygenated blood* | 900 | 1350 | 1575 |
| Cerebrospinal fluid | 3300 | 3350 | 3400 |
| Water | 3500 | 3500 | 3500 |
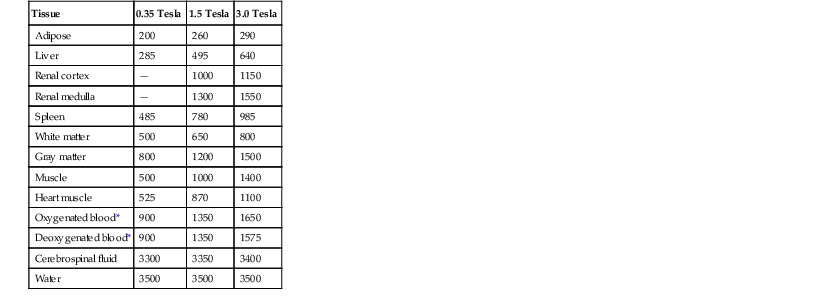
* At typical human hematocrit of 0.42.
An equation describing how MZ relaxes toward equilibrium has an exponential form. The further MZ is from M0, the faster it approaches M0. As the ensemble of nuclear spins gets closer to M0, MZ approaches more slowly.
The ensemble of nuclear spins relaxes to 0.63 M0 in one T1. As a result, it takes approximately five T1 for a spin ensemble to return to M0
Stay updated, free articles. Join our Telegram channel

Full access? Get Clinical Tree


