where SI t is signal intensity at time t, SI0 is prior to contrast arrival, and TE denotes echo time.
ΔR2 * is generally assumed to be linearly proportional to contrast agent concentration, although this relationship has been questioned [18–20]. CBV is proportional to the area under the contrast agent concentration–time curve [21–23].
The most commonly used technique in DSC perfusion MRI employs single-shot echo planar imaging (EPI) because it provides very rapid image acquisition. It is usually performed in conjunction with multislice gradient echo (GRE) sequences. Spin echo (SE)-EPI methods have also been used by some. GRE sequences have a higher signal-to-noise ratio (SNR) than SE and therefore allow the use of half the amount of GBCA. GRE also appears to be sensitive to both capillaries and larger vessels while SE is more sensitive to capillaries within a voxel [24]. SE tends to result in fewer susceptibility artifacts compared with GRE sequences and is more sensitive to paramagnetic effects within smaller versus larger vessels. While early studies appeared to demonstrate the utility of SE techniques to grade gliomas, it now appears that GRE demonstrates a better correlation with glioma grade. This is likely due to the fact that the angiogenesis associated with these tumors results in enlarged microvessels that do not resemble capillaries [25–28].
A dose of 0.1 mmol/kg of a GBCA is typically used with a standard GRE-EPI technique. 2D sequences are generally preferred compared to 3D sequences because of their ability to achieve better spatial resolution and shorter TRs and provide a more accurate characterization of bolus passage [29, 30]. In cases where increased spatial coverage is desired, 3D sequences can be substituted. When drawing regions of interest (ROIs), care must be taken to avoid large vessels as GRE sequences are sensitive to macrovessels [26]. Techniques combining SE/GRE methods have been used to determine relative vessel size during antiangiogenic drug treatment [25, 31, 32].
Because traditional T1 dynamic contrast-enhanced (DCE) MRI methods to measure permeability may require minutes (and sometimes hours), there has been some interest in first-pass methods to derive this parameter [27, 33, 34]. Work by Cha et al. recently showed that K trans derived by first-pass DSC methods was well correlated in gliomas compared with steady-state T1 DCE methods, but not so in meningiomas [35]. Other metrics derived from DSC data such as percent signal recovery (PSR) can also give insight into vascular permeability; however, most permeability imaging is currently performed using T1W DCE [36].
Limitations
Contrast agent leakage: Following bolus intravenous injection, the paramagnetic properties of a GBCA induce shortening of T1 and T2/T2* relaxation times of water [37]. Dipole–dipole interactions between tissue water protons and the paramagnetic ions of the GBCA underlie the decrease in T1 relaxation [38]. Because these dipole–dipole interactions are active at only very short distances and so the spins to be shortened must be in very close proximity to the gadolinium atom, a marked T1 effect and T1-weighted enhancement will be noted in a region with direct access to a uniform distribution of contrast agent. As a result, intravascular GBCA produces T1 shortening and signal enhancement of the blood pool itself. There is not a significant T2* effect because the uniform distribution of contrast agent does not result in susceptibility-induced gradients.
A different principle underlies the shortening of the T2/T2* relaxation time where susceptibility-induced gradients surround the paramagnetic GBCA and result in spin dephasing. Because the GBCA is compartmentalized within the vascular compartment, there will be a minimal T1 effect and a substantial T2* decrease that extends beyond the capillaries [39–41]. This extension of the susceptibility effect into the surrounding tissues results in a more pronounced signal decrease than would be expected relying on only intravascular effects [42].
Preservation of the blood–brain barrier (BBB) allows GBCAs to serve as intravascular tracers during application of the indicator dilution theory in DSC [43]. However, BBB disruption is common in brain tumors as well as other CNS pathologies and this leads to leakage of GBCA into the extravascular extracellular space (EES). This loss of compartmentalization and contrast agent leakage result in competing T1 relaxivity, dipolar T2, and residual T2* effects that interfere with susceptibility signal loss. Without correction algorithms, T1 effects may result in underestimation while T2 and T2* effects may result in overestimation of rCBV [44]. Further complicating matters is that opposing T1 and T2/T2* effects may be present concurrently [45].
There are numerous strategies that have been applied to address leakage correction. These include not correcting for leakage, but mentioning it as a possible confounding variable, only post-processing perfusion data from regions that do not enhance, obtaining dual-echo T2* acquisitions, using low-flip-angle GRE and various mathematical modeling approaches [46–50]. An empirical method that has been proposed involves preloading with GBCA prior to the DSC acquisition in an attempt to saturate the EES tissue T1-weighted signal intensity. This, in theory, should decrease the T1-induced signal intensity increase during the subsequent DSC bolus gadolinium contrast agent administration [44, 45]. A recent preliminary study that combined preload dosing of contrast agent (0.1 mmol/kg) with 6 min of incubation time along with baseline subtraction techniques appeared to improve the diagnostic accuracy of rCBV to differentiate between recurrent glioma and radiation effect [51].
A T1W DCE sequence may be acquired during the preload GBCA administration. At our institution, we administer a 0.05 mmol/kg bolus injection of gadolinium contrast agent during the preload dosing to acquire T1W DCE permeability data. Conventional sequences such as T2-weighted imaging can then be obtained. Then a second 0.05 mmol/kg bolus injection of contrast agent is performed to obtain T2*-w DSC perfusion data.
Alternatives to GBCAs such as macromolecular contrast media (MMCM) or true blood pool agents (molecular weight >50 kDA) are a potential solution to the problem of contrast agent leakage in DSC MRI. These agents remain in the vascular space for a prolonged period of time following injection. However, there are currently no agents that have been approved for routine clinical use. Superparamagnetic iron oxide (SPIO) nanoparticles are a type of MMCM that have been explored as an MRI contrast for brain imaging applications [52]. Recent work involving the use of the iron oxide nanoparticle agent ferumoxytol may provide more accurate estimates of rCBV given its ability to serve as a blood pool agent and not leak out through a damaged BBB in the short term (minutes to hours) [53]. It does appear to slowly leak across a damaged BBB over time, though the mechanism is unclear. Ferumoxytol is unique among iron oxide nanoparticle contrast agents in that it can be safely administered in a rapid bolus fashion and appears to be safe in patients with renal dysfunction where the risk of nephrogenic systemic fibrosis (NSF) is a concern [54].
Other blood pool agents such as albumin, polysaccharide, and polylysine have been explored as alternatives to standard GBCAs; however, they have never reached clinical testing [55–58]. The slow clearance rate of these agents is a potential safety concern [59].
Artifacts: T2*-w DSC imaging is prone to artifact from bone, air, and blood that constitute another source of potential error. Postoperative patients or those harboring tumors at the skull base or postoperative changes may benefit from SE rather than GRE DSC MRI. Reducing slice thickness and applying parallel imaging also limit susceptibility artifact with minimal loss to SNR [24, 60, 61].
T1-Weighted Dynamic Contrast-Enhanced MRI
T1-weighted DCE MR imaging, sometimes referred to as permeability MR imaging, also measures changes in tissue signal intensity over time with administration of a GBCA. However, it typically uses more complex pharmacokinetic models (PKMs) than T2 or T2* DSC perfusion imaging. Resultant analysis of DCE data provides greater tissue detail; however, it incorporates several assumptions that may lead to potential errors. Standard imaging protocols measure T1 relaxation rate before, during, and after the IV administration of a GBCA over several minutes by repeatedly imaging an ROI. A T1-weighted GRE- or spoiled gradient echo (SPGR)-type sequence may be utilized in DCE MRI. The latter is less sensitive to T2 effects that degrade the T1 signal intensity, but with inferior SNR compared to GRE. However, improvement of SNR can be accomplished with the use of 3-dimensional SPGR or equivalent techniques [62]. The techniques used place demands, often conflicting, on high temporal resolution, high spatial resolution, SNR, and anatomical coverage [63].
In general, the acquisition of T1W DCE data involves the use of pre-contrast T1 mapping techniques and dynamic 3D acquisition to create a set of images that give an estimated GBCA concentration at each location and time point. These are then combined with an estimate of the AIF and a PKM to determine metrics such as the volume transfer constant (K trans) and fractional volume of the EES (v e). PKMs which incorporate the contribution of intravascular tracer to the MR signal will also provide the fractional plasma volume (v p). *Note that V e = v e × total tissue volume (V t) and V p = v p × V t [64].
Signal intensity changes with time must be converted into GBCA concentration–time curves to perform PKM. Unlike computed tomography perfusion, the relationship between MR signal intensity and GBCA concentration is not always linear [65]. Accurate determination of GBCA tissue concentration from T1 mapping can be facilitated by numerous techniques such as the variable flip angle approach, in which baseline pre-contrast T1W images with variable flip angles are acquired just prior to the DCE acquisition. Nevertheless, rapid changes in GBCA tissue concentration (C t) following the contrast bolus administration impose challenges for measuring T1 quickly over a wide range of values and under conditions of often poor SNR:
 where T10 is the relaxation rate before contrast agent injection and R 1 is the relaxivity of the contrast agent [64].

DCE MRI acquisition time plays a major role in brain tumor imaging, where pathologic tissue enhances rapidly. Greater temporal resolution allows for more sophisticated PKM that can determine physiologic markers such as K trans with superior specificity [66]. Iron oxide nanoparticles used as blood pool agents may also improve DCE acquisitions, as less demanding temporal resolution would allow for longer acquisition times to measure permeability [67].
Various PKMs have been developed to fit the contrast agent concentration–time curves of brain tissues to estimate vascular permeability. Arterial flow to the ROI, otherwise known as the AIF, can be determined from DCE data, or, if necessary, estimated from published standards [68]. In most PKMs, it is assumed that the GBCA occupies two tissue compartments: the capillary plasma space (v p) and the EES (v e) (Fig. 1.1). The volume transfer constant between the capillary plasma space and EES, K trans, is the most widely utilized vascular permeability metric. It represents a potentially intractable combination of flow, permeability, and surface area [69]. Even with rapid imaging techniques, the temporal resolution may not be able to differentiate the contribution of each factor in the resultant K trans and so the physiologic meaning can differ. Added to this are variations in DCE technique which can make comparison of literature values of K trans problematic [66, 70, 71]. Following IV bolus administration, GBCA initially diffuses within plasma alone, referred to as the vascular or first-pass phase. Regions of BBB disruption then allow GBCA extravasation into v e. Simpler PKMs ignore the contribution of intravascular GBCA (v p = 0) since the vascular volume in normal brain tissues is small, about 5 %, and the GBCA in the EES is assumed to represent the total GBCA in the tissue of interest [64].
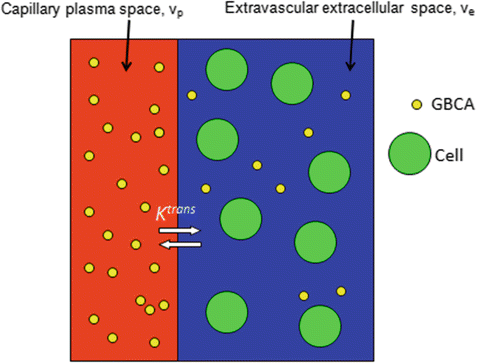

Fig. 1.1
Schematic depicting the two-compartment PKM for contrast agent tracers (GBCA). The GBCA passes from the capillary plasma space (v p) into the extravascular extracellular space [EES] (v e). Ktrans represents the volume transfer constant between the capillary plasma volume and the EES. All GBCAs in clinical use are excluded from the intracellular space
Under conditions of abundant flow and limited permeability, K trans is then equal to the permeability endothelial surface area product (PS) per unit mass of tissue and tissue density (ρ):


However, flow-limited tissues such as the necrotic core of a GBM affect K trans differently:
 where F denotes blood flow and Hct is hematocrit.

K trans derived from simple PKMs are not as robust as from more complex models incorporating v p. Highly vascular tumors possess larger intravascular compartments compared with healthy tissues, and require knowledge of the vascular contribution (v p) into the overall tissue contrast agent concentration. Isolating v p may also prove useful as a comparison to rCBV derived from DSC, especially in cases where artifacts from bone, air, or blood produce undesirable susceptibility.
More complex modeling such as the adiabatic tissue homogeneity model allows the effects of flow to be differentiated from surface area and capillary permeability [72]. In this model, the intravascular contrast agent concentration is defined in terms of both time and distance within the capillary. However, this complex model requires very high temporal resolution in the range of 1 s [65, 72].
Limitations
Although the prospect of microscopic tissue examination with DCE is enticing, K trans, v p, and v e require histopathologic correlation in order to be validated. Animal studies have demonstrated a correlation between these DCE-driven metrics and tissue features such as microvascular density, although the relationship is highly dependent on the spatial resolution [73]. Further studies involving human biopsy and autopsy samples are needed.
Differences in image acquisition methods and PKMs across institutions create challenges when comparing DCE metrics. Quantitation enables description of vascular permeability, but numerical values for metrics such as K trans can vary with scanner model, sequence choice, temporal and spatial resolution, AIF, and PKM used. Standardized imaging protocols attempt to minimize variation, although hardware variations, patient-dependent factors such as cardiac output, and the site of IV injection can confound results. Methodological variation has so far limited comparison of K trans and other metrics, limiting the value of quantification.
Arterial Spin Labeling
Arterial spin labeling (ASL) is an MR perfusion technique capable of estimating absolute CBF without the use of an exogenous contrast agent, instead relying on magnetically labeled water protons as an endogenous tracer [19]. While there are many more perfusion imaging studies that employ exogenous GBCAs, ASL methods do offer some advantages. Because it does not require the injection of a GBCA, it can be considered completely noninvasive, thereby allowing easier repeated measurements, which is particularly notable given the possibility of nephrogenic systemic fibrosis in some patients [74]. Also, because ASL relies on a diffusible tracer (labeled arterial water) it appears to be relatively insensitive to permeability, a major confounder in rCBV [75]. Interestingly, a recent report of a CASL method with a twice-refocused spin-echo diffusion sequence appears to be able to quantify [76]. In addition, there is potential for ASL to be completely operator independent [77].
Some disadvantages of ASL compared with DSC MRI include intrinsically low SNR, longer acquisition times, and a relatively complex acquisition procedure, which may, in part, explain its lower utilization compared with DSC [77–79]. Furthermore, a well-known pitfall of ASL involves cases of severe ischemia where prolonged arterial transit times can result in relaxation of the spin label and produce underestimation of CBF [80].
DSC MRI-derived CBV has been the primary metric used in brain tumor perfusion imaging though CBF, particularly from ASL, has been an emerging focus. It should be noted, however, that CBV and MTT can, in theory, be obtained using ASL following technical modifications but are not yet widely available [81–85].
In an ASL acquisition, a radio-frequency (RF) pulse is used to magnetically “label” arterial blood water. This “label” decays with T1 relaxation, which is on the order of 1-2 [80]. Therefore, only a small amount of arterial spin-labeled water accumulates in the brain. A post-labeling delay is necessary to allow flow of magnetically labeled blood water into the microvasculature and tissue [86]. “Control” images are also obtained where there is no magnetic labeling of arterial blood water but where magnetization transfer effects are accounted for. Pairs of interleaved labeled and control images are produced where the static tissue signals are identical except for where the magnetization of the inflowing blood is different [87]. Labeled acquisitions are subtracted from control experiments without magnetization to determine CBF in ml/100 g/min [80]. The signal difference between inverted and control spins ranges between 0.5 and 1.5 % and experiments must be repeated several times to improve this poor SNR [77].
In practice there are about 30 different techniques of arterial blood labeling schemes and at least 6 different techniques to encode the labeled information during the inflow time and as many readout schemes, potentially leading to a great number of ASL technique variations [77, 78]. There are also multiple methods to quantify ASL-derived CBF without a clear optimal approach [19]. Furthermore, little is known regarding the validation, reproducibility, and sensitivity/specificity of these various methods [79, 88, 89].
While there are a multitude of acronyms in the ASL literature, the two main types of ASL techniques are continuous ASL (CASL) and pulsed ASL (PASL) [90–92]. CASL is the older technique where there is a prolonged RF pulse that continuously labels arterial blood water below the imaging slab until a steady state of tissue magnetization is reached [77]. One consequence of the prolonged RF pulse in CASL is that it leads to magnetization transfer (MT) effects [93]. If the MT effects are present only during the labeling scheme, overestimation of perfusion may result because the saturation effect of the macromolecular pool will result in reduced signal of the free water pool from the tissue of interest [94]. The lack of wide availability of continuous RF transmit hardware and the possibility for large deposition of RF energy into the patient, which can exceed FDA limits for specific absorption rate (SAR), are further issues that have limited the popularity of CASL [79].
While CASL does provide greater perfusion contrast, PASL is comparatively less technically demanding [95, 96]. In PASL, a short RF pulse is used to label a thick slab of arterial blood at a single point in time and imaging is performed following a period of time to allow distribution in the tissue of interest [87]. PASL techniques are divided into two categories depending on whether the labeling is applied in a symmetric or an asymmetric fashion relative to the imaging volume [95]. Compared to CASL, PASL techniques have lower RF power deposition and higher inversion efficiency [79]. A systematic bias in CBF calculation due to PASL’s poorly defined distal edge of the labeling plane can be overcome with techniques that employ a saturation pulse following the inversion pulse to sharply define distal edge of the labeling plane [19, 97]. Pseudo-CASL is a relatively newer technique that is a compromise between PASL and CASL that may provide improved balance between labeling efficiency and SNR than conventional ASL methods [98].
Other technical modifications to improve SNR and image quality of ASL include the use of higher field strengths (i.e., 3 T or higher), background suppression of static tissue signal, and the use of a phased array coil as the receiver and introduction of fast 3D sequences as an alternative to traditional EPI approaches [96, 99–102]. Because absolute CBF must be corrected for age- and patient-dependent mean perfusion, relative rather than absolute CBF appears to be sufficient in brain tumor evaluation [103]. However, absolute values can allow comparison of values in a given individual patient throughout the course of treatment.
Clinical Applications of MR Perfusion Imaging
Primary Glial Neoplasms
Diagnosis, Grading, and Outcome: Determination of tumor grade is the most commonly published application of microvascular imaging biomarkers, and while histopathologic diagnosis remains the gold standard and in practice most suspicious tumors are biopsied, these studies can potentially validate these biomarkers [87]. Conventional contrast-enhanced MR imaging is not always accurate in predicting low-grade glioma (LGG) versus high-grade glioma (HGG) because while HGGs more commonly display contrast enhancement, it is not uncommon to be seen in LGG [104].
rCBV has been significantly correlated with histologic features of tumor aggressiveness including vascularity and mitotic activity [105, 106]. rCBV is directly related to elevated microvascular density, a histopathologic marker of malignancy [107]. A strong correlation between glioma grade and rCBV derived from DSC MRI has been well known [104, 108–111] (Figs. 1.2 and 1.3). Peak height, which is calculated as the difference between the pre-contrast T2*-weighted signal intensity and the minimum signal intensity, is an alternative DSC MRI metric that is strongly correlated with rCBV [107].
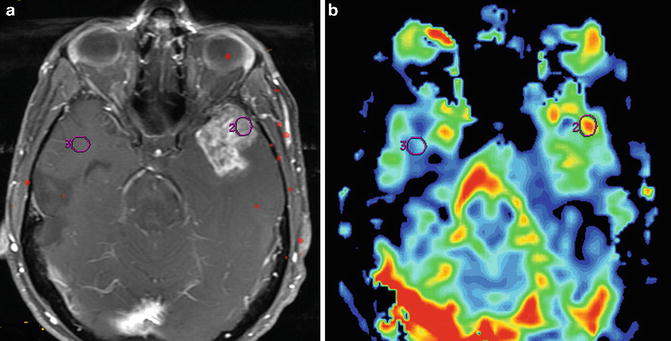
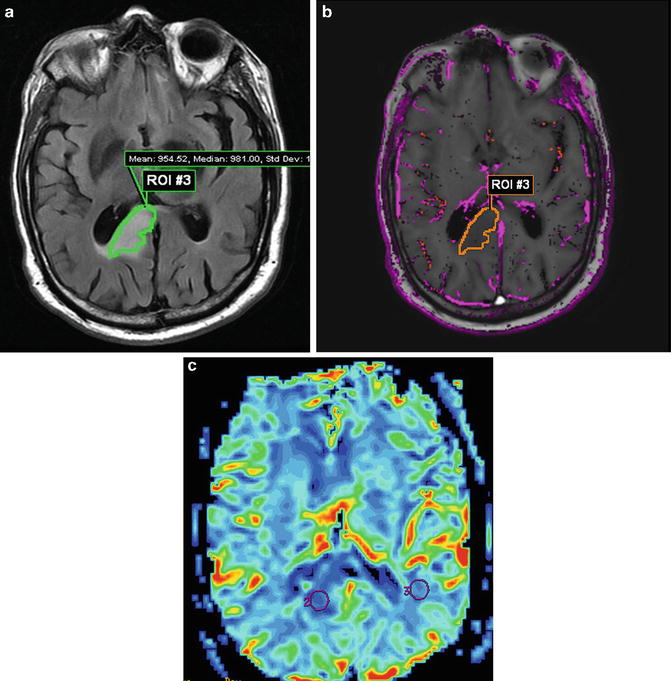

Fig. 1.2
MR perfusion for glioma grading is exemplified by this initial MRI of a 48-year-old man with headaches that revealed an enhancing left temporal lobe mass. Axial T1W post-contrast image (a) and accompanying rCBV colormap (b) demonstrates increased perfusion within the enhancing mass. A maximum rCBV of 3.04 is consistent with the pathologic diagnosis of GBM

Fig. 1.3
Low-grade glioma in the right corpus callosum/periventricular white matter demonstrates FLAIR hyperintensity (a) without contrast enhancement. A volumetric ROI based on the FLAIR abnormality is transferred to K trans colormap (b), where only sparse permeability is visualized. DSC MR data also support the diagnosis of LGG; rCBV colormap (c) shows low perfusion with a maximum rCBV of 0.5
Excluding tumors with oligodendroglial components, an rCBVmax > 4.2 was predictive of recurrence and rCBVmax ≤ 3.8 was predictive of 1-year survival in astrocytomas [112]. A retrospective study of 189 patients with LGG and HGG demonstrated that an rCBV threshold of 1.75 was able to predict median time to progression independent of histopathological findings [113]. In LGGs undergoing malignant transformation, an increase in rCBV has also been demonstrated up to 12 months prior to the appearance of contrast enhancement on conventional MRI [114].
To address the paucity of multicenter perfusion MRI data in brain tumors, Caseiras et al. sought to examine the value of rCBV to predict clinical outcome in two institutions [115]. Using a standardized imaging and post-processing protocol, their study of 69 patients with LGG found that patients with an adverse event exhibited a significantly higher baseline rCBV than those without. Patients with an rCBV below 1.75 demonstrated a much longer time to progression compared to those above 1.75, implying that LGGs with higher rCBV are more likely to behave like HGGs.
As stated previously, in addition to being the primary agent involved in angiogenesis, VEGF is also a potent promoter of vascular permeability. K trans has also been independently correlated with glioma grade; however the relationship appears to be less strong compared to rCBV [116, 117] (Figs. 1.3 and 1.4). A recent study of 28 patients using individual arterial input functions (iAIFs) and five flip angle T1 mapping at 1.5 T found that K trans was not only able to distinguish LGGs (grade I and II) from HGGs (grade III and IV) but also grade II from grade III [118]. To address the effect of poor estimation of the vascular input function (VIP) on permeability metrics derived from DCE MRI, a recent study by Nguyen et al. employed a phase-derived VIP with the bookend T1 measurement to show that both K trans and V p derived from DCE MRI could differentiate LGG from HGGs [119]. The use of a phase-derived VIP may be helpful because changes in GBCA contrast agent concentration are known to vary in a linear fashion with phase changes in vessels that are more or less parallel to the magnetic field [120, 121]. A study using discriminant functional analysis to distinguish LGGs from HGGs using a combination of immunohistochemical parameters associated with tumor development (VEGF, MMPs, HIF -1α, PRL3 (phosphatase of regenerating liver 3)) and DCE metrics appeared to classify 92.1 % of cases correctly overall [122]. HIF-1α expression was significantly correlated with rCBV and VEGF expression, rCBV and rCBF correlated with VEGF expression, and MMP-9 expression correlated with k ep (rate constant between EES and plasma).
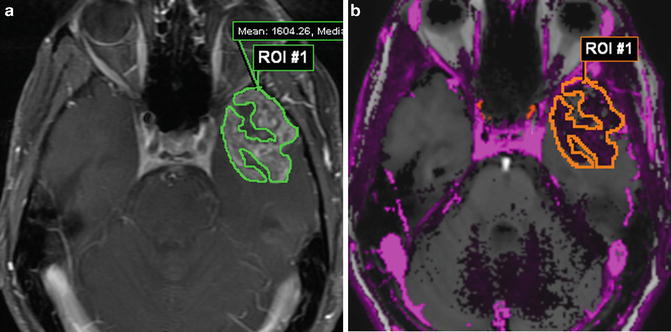

Fig. 1.4
DCE MR of the same patient as in Fig. 1.2. A volumetric ROI through multiple axial T1W post-contrast slices (a) with accompanying K trans colormap (b) showing regions of high permeability mean K trans = 0.32 min−1
Most DCE MRI studies of brain tumors have focused on K trans while v e has been traditionally overlooked. Increased cellularity and grade have been correlated with decreased ADC in gliomas [123–125]. By logical extension, it would seem that since v e is an estimate of the fractional volume of the EES, both ADC and v e should be positively correlated. Mills et al. performed the first examination of this hypothesis in glioblastomas and, interestingly, they were not able to demonstrate a correlation between these two measures [126]. This could be a reflection of the current incomplete understanding of these metrics and how they describe the EES; however, the heterogeneous nature of GBMs as well as modeling limitations in the calculation of v e were also thought to be factors that could have affected the results.
The first report of ASL MR imaging of human brain tumors was in 1996 by Gaa et al. [2]. This study used the PASL technique EPISTAR (echo-planar imaging and signal targeting with alternating radio frequency) in 17 patients with a variety of tumors including LGGs, HGGs, lymphomas, and meningiomas. They found that HGGs demonstrated elevated EPISTAR tumor/white matter contrast with prominent heterogeneity, while LGGs and lymphomas had the lowest EPISTAR tumor/white matter contrast; meningiomas demonstrated the highest values overall. Warmuth et al. reported the first comparison of ASL versus DSC MRI CBF in brain tumors in 2003 [103]. They used PASL (Q2TIPS—quantitative imaging of perfusion by using a single subtraction with addition of thin-section period saturation after inversion and a time delay) in 36 brain tumor patients. This study found that both techniques were able to distinguish between LGGs and HGGs and a good correlation was found between tumor CBF derived by both methods. More recent studies have confirmed that ASL-derived CBF is higher in HGG compared with LGG [75, 127–129]. Recent work using QUASAR (quantitative STAR labeling of arterial regions) ASL at 3 T, a dynamic model-free ASL technique, in 24 glioma patients demonstrated excellent intermodality agreement and reproducibility of tumoral rCBF compared to DSC MRI [130]. In 2011, the first report of an ASL-based CBV (termed arterial blood volume (aBV)) as a marker of CBV in brain tumor patients was reported by van Westen et al. [131]. Using QUASAR ASL at 3 T, they compared aBV and CBV derived from DSC MRI in ten brain tumor patients with HGGs and meningiomas. This study demonstrated good correlation between the two measures; however, further validation is needed and current limitations such as long acquisition times, low SNR, and limited spatial coverage are technical factors that remain to be overcome.
While lower grade neoplasms frequently demonstrate low CBF using ASL, artifactual reasons of why a higher grade lesion may demonstrate artificially low CBF need to be considered such as the presence of calcification, hemorrhage, prominent cystic/necrotic components, or metallic craniotomy clip artifacts [79]. Tumors with elevated ASL-derived CBF are usually thought of as high-grade neoplasms, but low-grade neoplasms such as meningioma and hemangioblastomas characteristically demonstrated elevated CBF as well.
Other Neoplasms
Solitary Metastasis Versus Glioma: MR perfusion characteristics of the peritumoral region may allow one to distinguish between gliomas and solitary metastases, as the former demonstrate elevated rCBV due to infiltration of brain parenchyma whereas the latter do not [127]. Mean peritumoral rCBV has been reported at 1.31 ± 0.97 for gliomas and 0.39 ± 0.19 for metastases [132]. A recent retrospective study reported the first ever examination of the ability of SE DSC to exploit the predominant microvascularity of gliomas compared to metastases, which contain a higher proportion of intermediate-sized vessels. A sensitivity of 88 % and specificity of 72 % were reported using this technique to distinguish a solitary metastasis from a glioma, which appeared to demonstrate significantly higher rCBV [133].
Lymphoma Versus Glioma: Primary central nervous system lymphoma (PCNL) presents another diagnostic dilemma amenable to MR perfusion. PCNL features such as enhancement within deep brain structures including the corpus callosum mimic GBM. rCBV of biopsy-proven PCNL ranges from.42 to 3.41, with mean rCBV significantly below that of glioblastoma yet higher than pyogenic or fungal abscess [24, 134]. Studies of ASL have found similar results [127]. However, given that experience with these disease entities is limited by small subject populations and overlap between rCBV values, MR perfusion should be considered in the context of additional clinical and imaging findings.
