Fig. 23.1
Stages during the definition of a new biomarker
23.2.2 Biomarkers in Oncology
Cancer is a complex entity that affects several systems including metabolism, gene expression, functional proteins, vascular recruitment and cell growth [9]. The role of quantitative imaging signal biomarkers and sample biomarkers in cancer involves many fields (Fig. 23.2), including mainly cancer diagnosis, prognosis, therapeutic response and oncological drug development.
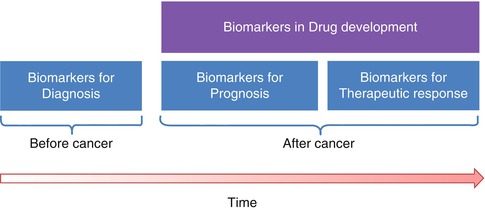
Diagnosis. The use of biomarkers can help in the diagnosis of cancer by determining, for example, whether a tumour located in the brain is primary or not. This aspect can be tested by evaluating the chromosomal alterations in the affected area, which are different in primary tumours and metastases [10] or by the in vivo MR spectroscopy of the lesion [11].
Prognosis. Biomarkers can also predict the course of cancer. This helps in estimating the outcome of the illness in order to establish the most effective (more or less aggressive) patient-specific treatment. For example, some studies have demonstrated that an increased level of TIMP-1 (tissue inhibitor of metalloproteinases) has a good correlation and predicts for poor survival in patients with advanced myeloma [12] and that quantitative pharmacokinetic assessment of dynamic contrast-enhanced MR parametric images of hepatocellular carcinoma can separate lesions with different microvascular properties and biological evolution [8].
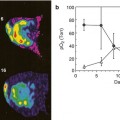
Therapeutic response. Biomarkers may help to predict response to treatments, analysing the effects that a particular therapy has in a specific patient. For instance, the oncogene HER2/Neu (human epidermal growth factor receptor) has been validated as a predictor of response to HER2-targeting therapy [13], as the HER2 over-expression is detected when there is a significant increment in the cellular growth and division, showing a more aggressive cancer. It is also known that functional imaging techniques such as diffusion-weighted (DW) and dynamic contrast-enhanced (DCE) MR imaging have the ability to depict important tumoural biological features and are able to predict therapy response based on assessments of cellularity and tumour vascularity, which often precede morphologic alterations [14].
Drug development. The use of biomarkers may decrease the duration of the clinical trials by earlier showing the relevant changes to the tumour and the evaluated drug effect. Many oncological treatments have promising results in phase 1 and phase 2 trials but nevertheless do not achieve the desired success level in phase 3 trials. For example, PET imaging with Carbon11 radiotracers is useful to study the pharmacokinetics in new anticancer drugs obtaining information about the metabolic processes and active molecules [15], which can be potentially useful to improve the development times. Also emerging evidence indicates that multiparametric analysis of DCE-MRI data offers greater insight into the mechanism of drug action in early-phase trial design than studies measuring a single parameter, such as the blood vessel permeability K trans value [16].

Fig. 23.2
Use of biomarkers in the oncological workflow
23.3 Parametric Imaging
One of the key factors in the clinical acceptability and success of an imaging biomarker is the way it is represented and the amount of information provided to the specialist interpreting the results and integrating them into the patient-specific status. Images are treated as raw data by post-processing techniques and computational models. Imaging biomarkers are calculated from specific mathematical models applied to the signal obtained in the acquisition modality. In this sense, the extraction of the biomarker can be performed either from the application of the model to the averaged intensities contained in a certain region of interest (ROI) or from a voxel-by-voxel basis. The first method ignores any information regarding the spatial distribution of the signal variations, obviating the heterogeneous distribution of the biomarker (e.g. as it occurs in cancerous tissue, where different physiologic and biological scenarios coexist). Therefore, the voxel-by-voxel parametric approach is preferable.
Parametric imaging consists in the generation of synthetic maps representing the spatial distribution of imaging biomarkers and is the most suitable tool to analyse the heterogeneity of the distribution of the biomarker at the examined lesions, organ or tissue. This quantitative approach tends to be as automated as possible, reducing user interaction to maximise reproducibility. The output is a series of colour parametric images and, as these biomarkers often show functional information, they are superimposed on anatomical images to help user interpretation.
The main advantage of multiparametric imaging is that images do not represent arbitrary intensity units but quantitative biological-related data obtained by the analysis of a model and usually represented in a colour scale (compared to the greyscale of the original source images) [17]. These parametric images are also widely considered as univariate maps, since they represent a certain variable or parameter that has been extracted from a model and has, usually, a specific measurement unit (e.g. the apparent diffusion coefficient obtained from DW MR images; parameter: ADC; units: mm2/s).
23.3.1 From Source Data and Redundancy to Parameters
The generation of parametric images can be understood not only as the process to obtained hidden tissue properties by signal modelling but also as a process of data reduction, passing from a huge amount of acquired data in the obtained images to the spatial parametric representation of the imaging biomarker that is relevant to the disease (Fig. 23.3). As an example, several temporal acquisitions are performed in perfusion studies ending up with a high number (typically hundreds) of images containing information that is not directly relevant to the radiologists, while the application of the proper pharmacokinetic model to the enhancement curves allows the extraction of the relevant parametric distribution of the vascular permeability coefficient (Ktrans) in all the slices of the acquired volume (tens of images).
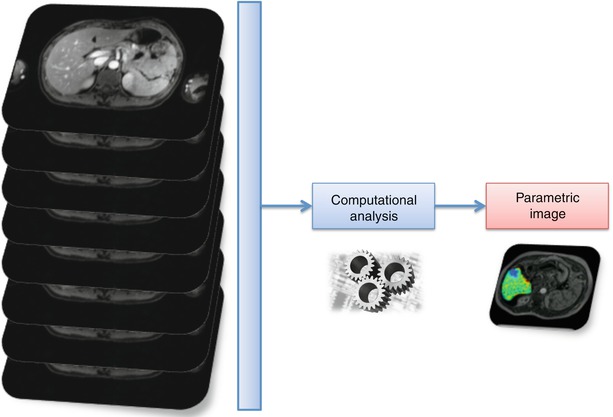

Fig. 23.3
Data reduction for the parametric image generation in the extraction of an imaging biomarker of perfusion from a dynamic study
23.3.2 Synthesizing Matrices and Volumes
In the data reduction process, in order to synthesize parametric images, a mathematical function included in a computational algorithm processes the image intensities in each voxel to produce the measurable values of the imaging biomarker, P im (Eq. 23.1)
![$$ {P}_{im}\left(i,j\right)={f}_{\mathrm{b}}\left[{I}_{\mathrm{k}}\left(i,j\right)\right] $$](/wp-content/uploads/2016/04/A272994_1_En_23_Chapter_Equ1.gif)
where I k represent the intensities of different images, k is the type of image and i, j are the positions of the pixel in the planar image matrices.
![$$ {P}_{im}\left(i,j\right)={f}_{\mathrm{b}}\left[{I}_{\mathrm{k}}\left(i,j\right)\right] $$](/wp-content/uploads/2016/04/A272994_1_En_23_Chapter_Equ1.gif)
(23.1)
Although parametric images obtained from the processing of medical images can be directly related to the 2D dimension due to the concept ‘image’, the reasoning in Eq. 23.1 can be perfectly extrapolated to 3D information data sets in order to generate parametric volumes.
There are different types of parametric imaging extraction techniques, depending on the type of functions applied for the extraction of the imaging biomarker. The main ones are the following:
Voxel-wise curve fitting: A mathematical model is applied to signals built from images of an anatomical region acquired repeated times with the variation of a certain parameter (e.g. temporal variation in dynamic perfusion studies or b-value changes in MR DW imaging studies).
Static morphology-texture analysis: Direct morphology or texture characteristics are extracted from the images acquired in a specific anatomical region (e.g. cortical thickness from high spatial resolution MR).
3D model simulation: Generation and simulation of 3D models of organs or tissues from a set of images acquired in a specific anatomical region (e.g. computational fluid dynamics analysis in a model of the aorta extracted from CT images).
23.3.3 The 2D and 3D Spatial Localisation of Biomarkers
It is important not only to generate parametric images containing the spatial distribution of a biomarker but also to identify the exact spatial position of its major alterations and pathological changes. As tumours are highly heterogeneous tissues, it is desirable that the generated parametric images are spatially registered to anatomical images, improving the quality of the quantitative data available for the accurate diagnosis and also guiding the biopsy and/or therapeutic procedures. An example of registration and image fusion of DW parametric maps calculated after the application of the intra-voxel incoherent motions (IVIM) theory [18] can be observed in Fig. 23.4.
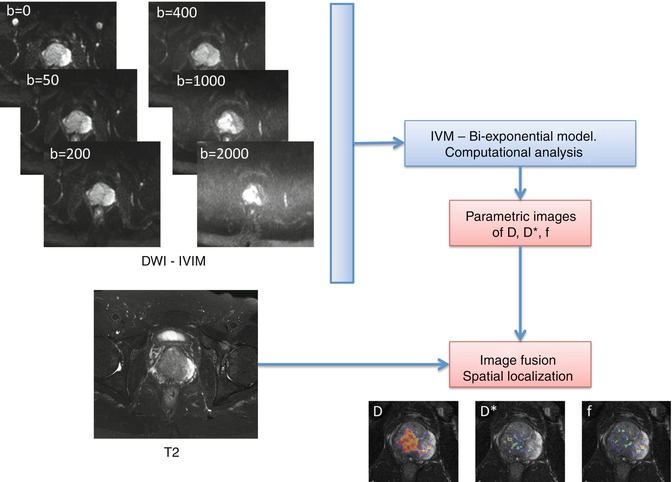

Fig. 23.4
Calculation of diffusion parametric maps and registration to anatomical T2 by the application of a biexponential mathematic model to diffusion images acquired with different b-values
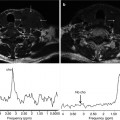
Parametric volume reconstructions can also be generated from the 3D source data set. These images may be obtained, after the proper segmentation of any organ or volume of interest (VOI), from the selected tissue, reducing the computational burden. In this case, the biomarker is also calculated voxel-base and then the ‘cloud’ of values superimposed to the reconstructed VOI. An example of a parametric volume reconstruction of the metabolic profile in a prostate can be appreciated in Fig. 23.5.


Fig. 23.5
Parametric volume reconstruction of the Choline-Creatine to Citrate (Cho + Cr/Cit) ratio in a prostate, extracted from the processing of MR spectroscopy data
23.4 Multiparametric Imaging
Combining multiple imaging quantitative parameters that reflect different aspects of pathophysiological processes will provide new insight over what can be collected from single parametric maps. As noticed, the advances in imaging technology have boosted the availability and specificity of imaging modalities. Following the modern tendencies of medicine to provide tailored diagnosis and treatments, a whole variety of imaging-derived quantitative measures compete to be the gold standard for each piece of the cancer management items and hallmarks’ evaluation. However, it seems that there are not single winning candidates comparing different protocols inside particular modalities. As this race needs to take into account many factors, including clinical and technical aspects, researchers are interested not only in developing advanced imaging tools but also in making the most of what is currently available in conventional clinical centres.
An interesting new approach, currently work in progress, is the multiparametric imaging. Some approaches involve evaluating different imaging data sets that are typically acquired at the same imaging session, while other approaches concentrate on the evaluation of longitudinally acquired single parametric maps [19]. One clear example of the first way is the MR study of the prostate using perfusion, diffusion and spectroscopy. In this case, different sequences from the same imaging modality are used and combined, but there are still several issues that need to be addressed for this approach to be standardised and widely used [20, 21]. The longitudinal multiparametric approach is given by the change in time of the relevant parameters, which typically evaluate the treatment effect in a given disease. The statistical analysis of large image series can also provide secondary images that minimise any redundant data [22].
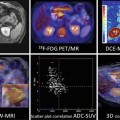
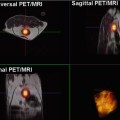
Multiparametric imaging biomarkers extracted by post-processing manipulation can also be considered secondary images to be further analysed and included in the multidimensional imaging workflow. Figure 23.6 shows a theoretical framework in which several imaging modalities, protocols and biomarkers can be used and where multiparametric imaging can be applied at different levels.
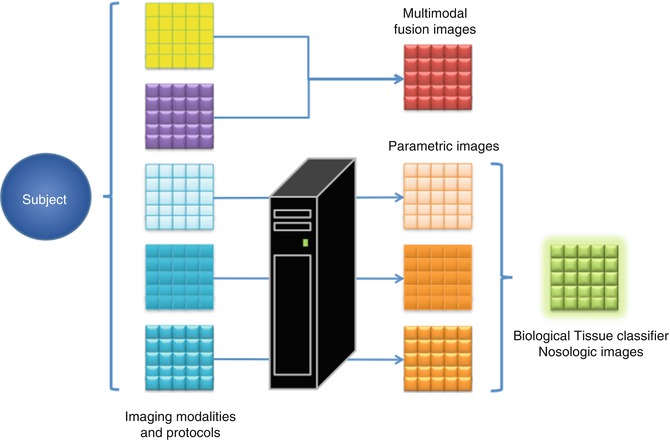

Fig. 23.6
Diagram showing the different levels of multiparametric imaging. Multimodal images are acquired from the subject and they can be directly combined to obtain descriptive fusion multiparametric images. If post-processing algorithms are applied on the original images, imaging biomarkers can be extracted and combined in new multiparametric images. Finally, if there is enough data and proof, statistic models can be built to generate multiparametric nosological images
Stay updated, free articles. Join our Telegram channel

Full access? Get Clinical Tree


