Fig. 8.1
Schematic representation of interactions between MM cells and bone microenvironment (right panel ) as compared to the physiological balance (left panel ). Dickkopf 1, a potent inhibitor of osteoblast precursor cells (DKK1), over-inhibited in normal condition via wingless gene (Wnt) is activated by MM cells promoting osteoblasts activity and decreasing osteoprogenitor (OPG) circulating levels. Furthermore, cytokines (IL-1, IL,6 and MIP-1α) and RANK promoting osteoclasts tip the balance toward bone resorption resulting in the typical lytic bone appearance of MM lesions
The local proliferation of myeloma cells may lead to the appearance of a solid lesion which involves the soft tissue primarily arising outside the bone or extending from a preexistent bone lesion. In the absence of systemic spread, this lesion is named plasmacytoma [13].
Excess protein produced by myeloma can increase the viscosity of plasma. Hyperviscosity is associated with impairment of the microcirculation particularly in the eye and central nervous system causing visual impairment, dizziness, headache, and hearing loss. Rarely, there is spontaneous bleeding [14] due to platelet dysfunction. Patients with myeloma are at increased risk of infection due to reduction of normal plasma cell function. Infections are potentially fatal complications that can occur during chemotherapy, at relapse or following bone marrow transplantation, and are most frequently caused by Streptococcus pneumoniae, Haemophilus influenzae, or Herpes zoster virus [15]. Other complications include myocardial ischemia or congestive heart failure due to deposition of light chain protein (amyloid) in the myocardium causing dilated or restrictive cardiomyopathy, as well as a hypersensitivity syndrome and/or anemia [16].
Neuropathy in patients with myeloma is usually symmetric, distal sensory, or sensorimotor with axonal degeneration, often associated with amyloid deposits or antibodies against peripheral myelinated fibers [17]. In 1% of the cases, myeloma occurs in a rare syndrome characterized by polyneuropathy, organomegaly, endocrinopathy, monoclonal gammopathy, and skin changes (POEMS syndrome) [8].
Although the presence of lytic bone lesions is highly suggestive for MM, it is not by itself sufficient to establish the diagnosis. The minimum criteria for MM diagnosis are either the detection of at least 10% abnormal plasma cells within a bone marrow biopsy or of M-protein levels >30 g/L in serum or >1 g excreted in the 24-h urine [7].
Standard workup of MM is based on a number of laboratory tests that are utilized for risk stratification (Table 8.1). Such assessments include complete blood count, routine biochemistry and urine analysis, serum and urine protein electrophoresis (preferably on an aliquot of the 24-h collection), lactate dehydrogenase and β2-microglobulin levels, immunofixation of serum or urine sample for the detection of M component, nephelometry (for measuring the free light chains employed to monitor patients with oligo- or nonsecretory myeloma), and cytogenetics or FISH analysis. The fraction of plasma cells infiltrating the bone marrow is evaluated based on May-Grünwald Giemsa stained smears. MM plasma cells typically stain positive for CD38, CD56, and CD138 and are usually negative for surface immunoglobulin and CD19. The number of plasma cells in the bone marrow is an important criterion for distinguishing MM from MGUS and from solitary plasmacytoma. MM is usually characterized by more than 10% plasma cells in the bone marrow, although, due to the heterogeneous distribution of plasma cells in the bone marrow, this fraction may vary substantially depending on the site of sample aspiration; this parameter is therefore not a consistent prognostic factor. Nevertheless, cytology of bone marrow aspirates remains the standard method for quantitating plasma cells infiltration. The bone marrow plasma cell labeling index (PCLI), a parameter of the DNA synthesis rate derived from in vitro incubation with tritiated thymidine, represents an additional predictor of survival [8]. This index is usually low at diagnosis (<1%) in MGUS and SMM, but it raises at relapse since it correlates with neoangiogenesis, therefore with active disease as well as (in an inverse manner) with survival regardless of the tumor mass. However, 40% of patients with symptomatic MM have normal PCLI [18].
Table 8.1
Mayo risk stratification for high-risk myeloma
High-risk characteristic |
|---|
Conventional cytogenetics Deletion of chromosome 13 (monosomy) Hypodiploidy Either hypodiploidy or deletion of chromosome 13 |
Fluorescent in situ hybridization (FISH) t(4;14) t(14:16) 17p– |
Plasma cell labeling index (PCLI) studies: PCLI ≥3% |
Imaging studies demonstrate the extent and severity of bone involvement (intramedullary/extramedullary, site and number of lesions) at baseline, including disease-related complications, such as pathologic fractures; they also serve to assess response to therapy and provide follow-up surveillance [6]. The standard skeletal survey reveals punched out lytic lesions, osteopenia, or fractures in approximately 80% of patients at the time of diagnosis. Due to the lack of osteoblastic response, the bone scan is insensitive for the detection of many bone lesions in myeloma patients.
The clinical staging system for MM (International Staging System, ISS, Table 8.2), introduced over 25 years ago, is mainly based on serum β2-microglobulin and albumin levels, without any reference to the presence of bone lesions nor to the methodology employed for their evaluation. Although the ISS serves as prognostic indicator rather than as an accurate scoring system, it has proven to adequately estimate tumor burden and risk stratification, also enabling to distinguish MGUS and SMM from MM [7]. The CRAB criteria are preferred to establish MM-related organ dysfunction [19]. In 1975, Durie and Salmon introduced a clinical staging system based on the presence of bone lesions to grade the severity of the disease: a normal bone structure or plasmacytoma characterized stage 1 and advanced lytic bone lesions characterized stage 3, while stage 2 corresponded to patients who did not fit neither stage 1 nor stage 3 features (Table 8.3) [20]. While the original Durie and Salmon system was essentially based on the use of planar X-ray for evaluating bones, a newer version, the PLUS system, was released in 2005 (Table 8.3) with the aim of improving the accuracy of staging by the use of advanced imaging modalities such as [18F]FDG-PET, [18F]FDG-PET/CT, and MRI (Table 8.3) [21]. These techniques enable to evaluate the total number of bone lesions, to distinguish MGUS or SMM from active myeloma, as well as to better discriminate between stage II and III disease. Nevertheless, the original system based on conventional X-ray only is still employed in areas where access to advanced imaging modalities is limited.
Table 8.2
International staging system (ISS) for MM
Stage | Criteria |
|---|---|
Stage I | Serum β2-microglobulin <3.5 mg/dl and albumin ≥3.5 g/dL |
Stage II | No stage I or III There are two categories: Serum β2-microglobulin < 3.5 mg/L but serum albumin < 3.5 g/dL Serum β2-microglobulin ranging from 3.5 to <5.5 mg/L irrespective of the serum albumin level |
Stage III | Serum β2-microglobulin ≥5.5 mg/L |
Table 8.3
Overview of Durie and Salmon staging system (A) and the Durie and Salmon PLUS staging system (B)
A: Durie and Salmon staging system | B: Durie and Salmon PLUS staging system | |||
|---|---|---|---|---|
Disease | Criteria | Measured myeloma cell mass in whole body (myeloma cells in billions/m2) | Classification | MRI and/or [18F]FDG-PET |
MGUS | Stage I (low cell mass) All of the following: Hemoglobin value >10 g/dL Serum calcium value normal or <10.5 mg/dL Normal bone structure (scale 0) or solitary bone plasmacytoma only at bone X-ray Low M-protein production rates: IgG value <5.0 g/dL IgA value <3.0 g/dL Urine light chain M-protein on electrophoresis <4 g/24 h | 600 billion | All negative | |
Smoldering or indolent myeloma | Stage II (intermediate cell mass) No stage I or stage III | 600–1200 billion | Stage I A | Can have single plasmacytoma and/or limited disease on imaging |
MM | Stage III (high cell mass) One or more of the following: Hemoglobin value < 8.5 g/dL Serum calcium value >12 mg/dL Advanced lytic bone lesions at bone X-ray (scale 3) High M-protein production rates IgG value >7.0 g/dL IgA value >5.0 g/dL Urine light chain M-protein on electrophoresis >12 g/24 h | 1200 billion | Stage I B Stage II A/B Stage III A/B | <5 focal lesions Mild diffuse disease 5–20 focal lesions Moderate diffuse disease 20 focal lesions Severe diffuse disease |
A detailed staging system is crucial, since MM has extremely heterogeneous outcomes and treatment is strongly dependent on the disease onset. Based on the stage and risk factors, risk-adapted therapeutic strategies can therefore be defined. While MGUS does not require any treatment (except long-term observation), there is no evidence that early treatment of patients with SMM prolongs their survival. The diagnosis of active symptomatic MM requiring therapy is based on end-organ effects of the disease.
Despite all treatment options, MM is still considered an incurable disorder with a median survival of about 2–3 years in high-risk patients, compared to 5–7 years with high-dose therapy followed by autologous stem-cell bone marrow transplantation (ASCT) in standard-risk patients [10]. Cytogenetic and FISH studies reveal chromosome abnormalities of prognostic significance in 33% and in 90%, respectively, of the patients with MM [8]. Translocations such as t(4;14), t(14;16), or 17p are associated with poor prognosis (median survival 25 months), as also is the presence of hypodiploidy 21 or the deletion of chromosome 13. The concomitant presence of monosomy and/or deletion of chromosome 13 and serum β2-microglobulin levels greater than 2.5 mg/L is linked to reduced survival. An elevated PCLI also confers a negative prognosis [7].
Treatment of Multiple Myeloma
High-risk patients can be treated with high-dose chemotherapy regimens plus either autologous stem-cell transplantation (ASCT) or allogeneic bone marrow transplantation. Recommendations for the treatment of symptomatic MM are reported in Fig. 8.2. Historically, the initial treatment for newly diagnosed MM (induction therapy) was high-dose melphalan. This therapy limits the ability to collect stem cells. In transplant eligible patients, it is preferable to use thalidomide/lenalidomide and bortezomib-based regimens. ASCT improves complete response and prolongs median overall survival by approximately 24 months, though with an intrinsic mortality rate ranging from 1% to 2%. The conventional approach to consolidation therapy has been high-dose melphalan. Induction regimens with a higher response rate before transplant result in longer time to progression after transplant. Thus, the introduction of thalidomide/lenalidomide and bortezomib increased progression-free survival after high-dose melphalan and ASCT and also increases their use as a consolidation regimen after initial response. Continued initial therapy as well as the use of combinations of bortezomib–thalidomide–dexamethasone, bortezomib–lenalidomide–dexamethasone, or cyclophosphamide–lenalidomide–bortezomib–dexamethasone have been proposed because they may increase the overall response rate >90%. Conditioning regimens based on total body irradiation are inferior to high-dose melphalan. Dose intensification reduces the possibility of recurrence, but it increases the risk of treatment-related toxicity and mortality (64%). On the other hand, intensity-reduced conditioning may result in high relapse rates (54% 5-year mortality rate). Myeloablation as part of radioimmunotherapy (RIT, see above) can be used 10–14 days before transplantation to reduce the dose of the conditioning treatment. Ongoing studies aim at assessing whether the conditioning regimen can be improved by the addition of bone-seeking radiopharmaceuticals such as 166Ho-DOTMP or 153Sm-EDTMP. A second sequential ASCT has been investigated as additional consolidation therapy to further reduce disease burden. Such tandem ASCT seems to be beneficial for patients who have failed to achieve good partial response after the first ASCT. Allogeneic transplant may be an option only for few patients, because of selective inclusion criteria (age, availability of an HLA-matched sibling donor, and adequate organ function) as well as high treatment-related mortality associated with graft-versus-host disease. Maintenance therapy with thalidomide is currently recommended for standard-risk patients treated with single high-dose melphalan in case of failure to achieve a very good partial response or with lenalidomide in all high-risk patients until progression of disease. In patients not eligible for transplantation, treatment with melphalan–prednisone–thalidomide, melphalan–prednisone–bortezomib, or melphalan–prednisone–lenalidomide is preferred. Maintenance therapy for standard-risk patients is melphalan, prednisone, and thalidomide or melphalan and prednisone for elderly patients, to reduce the risk of toxicity. For high-risk patients, treatment with melphalan, prednisone, and bortezomib is the current recommendation, limiting therapy to 54 weeks. At relapse, patients can be treated with either single agents or melphalan and prednisone or with different drug combinations in case of more aggressive disease. The standard protocol consists of a single drug/regimen until new progression of the disease or toxicity. At this time, a new drug/regimen is introduced. When recurrences occur within 6 months after completion of first-line treatment, chemotherapy consists of the same drug/regimen previously administered. In case cryopreserved stem cells are available, ASCT as salvage therapy is possible. Thalidomide, lenalidomide, and bortezomib, steroids, melphalan, VAD, and other alkylating agents can be effective in relapsed and refractory myeloma [9, 12, 22].
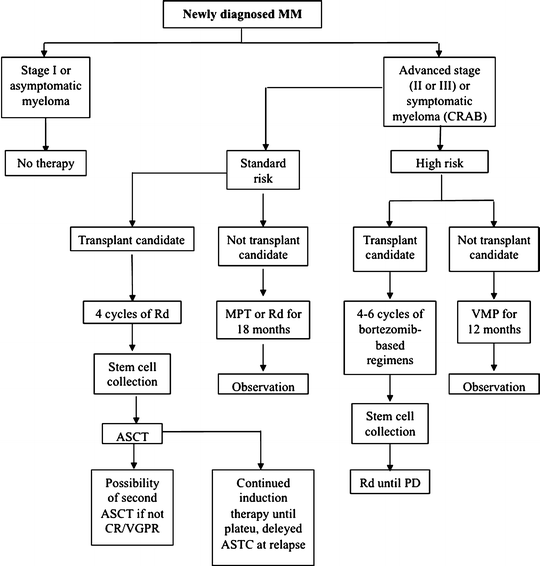
Fig. 8.2
Schematic representation of the recommendations for treatment of newly diagnosed multiple myeloma MM = multiple myeloma CR = complete response VGPR = very good partial response PD = progressive disease CRAB = syndrome with hypercalcemia, renal failure, anemia bone lesions Rd = lenalidomide plus dexamethasone ASCT = autologous stem cell transplantation VMP = bortezomib, melphalan, prednisone MPT = melphalan, prednisone, thalidomide
Supportive care with bisphosphonates can decrease bone pain as wells as reduce the progression of osteolytic lesions and prevent pathologic fractures. The exact time of start and optimal duration of treatment are still under investigation. However, according to ASCO recommendations, such therapy should be started in the presence of significant bone loss or of pathological spine fractures (lower bone density leads to weaker bones) and should continue for no longer than 2 years [12, 23].
A fully humanized mAb to RANKL (denosumab, that binds and inhibits the RANK ligand thus reducing bone resorption markers) is still under clinical investigation. Erythropoietin or darbepoetin is useful in patients with persistent symptomatic anemia. Indication for prophylactic antibiotic therapy in patients undergoing chemotherapy is still debated, while it should be considered in all patients receiving high-dose steroid therapy [12]. Gammaglobulin administration is indicated if patients have recurrent severe infections associated with severe hypogammaglobulinemia. Plasmapheresis is useful in patients with the hyperviscosity syndrome. Vertebroplasty and kyphoplasty generally result in rapid and long-lasting reduction of bone pain and improvement in functional activity in patients with vertebral compression fractures. The standard treatments for cord or cauda equina compression are steroids and radiation therapy, whereas surgical decompression is rarely necessary. Radiotherapy is generally used for the treatment of painful bone lesions or to prevent complications and is performed at least once in about 70% of patients with MM. Typically, doses <30 Gy are preferred, to avoid permanent side effects which could jeopardize subsequent chemotherapy or ASCT [12, 24].
Evaluation of Disease Burden with Imaging Modalities
Appropriate use of imaging techniques is essential both for determining the severity of bone involvement and for identifying and characterizing the skeletal complications. Imaging is also critical for detecting extramedullary foci, for diagnosing infection and other complications, and for evaluating progression of the disease. However, there is still no consensus on a standardized imaging protocol for either newly diagnosed myeloma patients or for evaluating patients in the course of treatment and for disease progression.
For staging purpose, the detection of osteolytic lesions is generally based on conventional planar X-ray (Fig. 8.3). Lytic lesions on plain X-ray are typically holes, punched-out lesions with absent reactive sclerosis of the surrounding bone, typically localized in the flat bones of the skull and pelvis. In the long bones, lesions may appear as endosteal scalloping, small lytic lesions (<1 cm), mottled areas of multiple small lesions, or large destructive lesions [25]. These lesions are the consequence of nodular replacement of marrow by plasma cells with destruction of the entire bone [24]. Conventional X-ray may also reveal diffuse osteoporosis, which is best recognized in the spine [26]. Radiological and clinical findings (presence of pain) are used in the score system (Table 8.4) to predict the risk of fracture of long bones and to identify optimal treatment (Table 8.4): patients with a high score benefit from internal fixation, whereas patients with a low score can be treated with radiotherapy alone. Asymptomatic patients with X-ray evidence of disease (at least one lytic lesion) have a high risk of progression, with a median time to progression of 8 months.
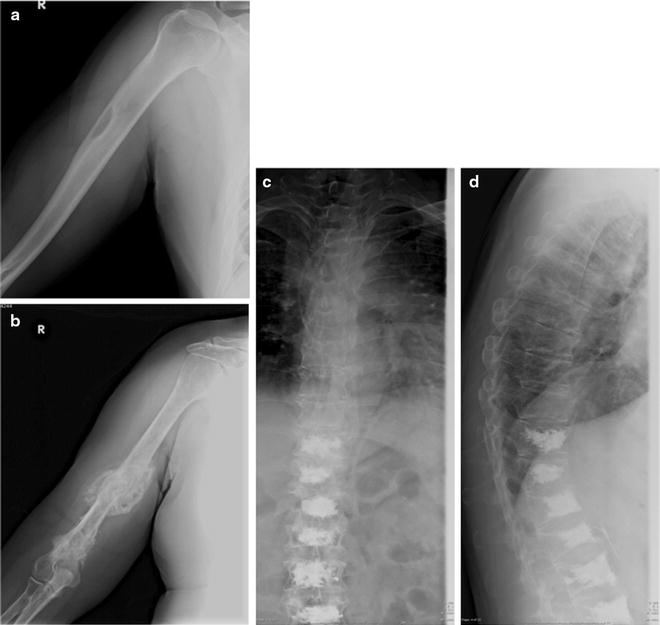
Fig. 8.3
X-ray appearance of lytic lesions in MM localized at the right homerus and vertebral bodies. Single lytic lesion (a) and two lytic lesions of the medial part and the distal third of the right humeral diaphysis with important osteoblastic reaction (b). Multiple lytic lesions of the dorsal spine (D6–D9) in patient treated with D10-L5 vertebroplasty (c anteroposterior view, d latero-lateral view)
Table 8.4
Scoring systems for diagnosing impending pathological fractures
Variable | Score | ||
|---|---|---|---|
1 | 2 | 3 | |
Site | Upper limb | Lower limb | Peritrochanteric |
Pain | Mild | Moderate | Functional |
Lesion | Blastic | Mixed | Lytic |
Size | <1/3 diameter | 1/3–1/2 diameter | >2/3 diameter |
Tot score | Risk of impending fracture | Management |
|---|---|---|
≤7 | Low (5%) | Conservative (chemo-/radiotherapy) |
8 | Suggestive (15%) | Conservative or surgery (to be evaluated case by case) |
≥9 | Diagnostic (33%) | Prophylactic bone fixation |
Whole-body skeletal survey, traditionally used in the Durie and Salmon staging system, is burdened with a relatively high rate of false negatives (30–70%), thus resulting in a significant underestimation of the severity of disease. In fact, conventional X-ray cannot always identify the presence of bone lesions, especially in the early stages of the disease, since lytic lesions become apparent when as much as 30–50% of the bone mineral density is lost. Furthermore, in plain X-ray, some areas are not well visualized (i.e., lateral and anteroposterior views of the spine are needed for better visualizing the vertebral bodies), and it is not possible to distinguish myeloma-related osteoporosis from osteoporosis due to other causes (i.e., steroid-induced or postmenopausal osteoporosis) [27]. Conventional X-ray examinations are also somewhat operator- and technology-dependent, thus increasing the risk of underdiagnosing lytic disease. A major disadvantage of conventional X-ray is the relatively long imaging time and the necessity of maintaining different positions that not all patients (often elderly and suffering pain for previous pathological fractures) are able to maintain. To overcome this latter limitation, the potential of low-dose whole-body radiographic system (Statscan, that enables to obtain high-quality imaging of the bones in shorter time) for detecting focal myeloma lesions has been explored; preliminary results are very promising, but clinical experience with this technique (which was originally developed for trauma and emergency patients) is still limited.
If skeletal X-ray survey is negative and clinical symptoms are present, CT or MRI has been used to increase the sensitivity and specificity of early detection of myeloma-associated bone destruction. CT can be considered as the ideal diagnostic investigation for identifying early bone destruction and extramedullary lesions. CT sensitivity is superior to that of conventional X-ray (between 70% and 89% for CT, depending on stage of the disease) [28–31] as it can detect more lesions, with an extremely high resolution (very small lesions can be detected, even <5 mm) and better performance when evaluating areas that are critical for planar X-ray. However, specificity of CT for assessing certain skeletal changes often associated with myeloma, such as osteopenia, is low. CT is especially useful for guiding biopsy and for planning surgical and radiation therapy, while it can also identify long bones (femora and humeri) at risk of fracture; furthermore, it can be employed in cases of suspected spinal cord compression when MRI is contraindicated.
However, actual bone destruction must occur for CT imaging to become positive, since focal tumor infiltration confined to the bone marrow remains undetectable. In fact, diffuse interstitial infiltration of the bone marrow is not invariably associated with trabecular/cortical bone destruction, so that the rate of false-negative CT scans is relatively high [32]. To reduce the radiation burden, low-dose whole-body CT (LDCT) may be used [15, 19]. Since the administration of iodinated contrast agent is not required for evaluating the skeleton with CT, this option is possible even in patients with Bence-Jones proteinuria, who are at risk of cast nephropathy and renal failure. Figure 8.4 represents typical CT examples of lytic lesions of the spine and of a solitary plasmacytoma.
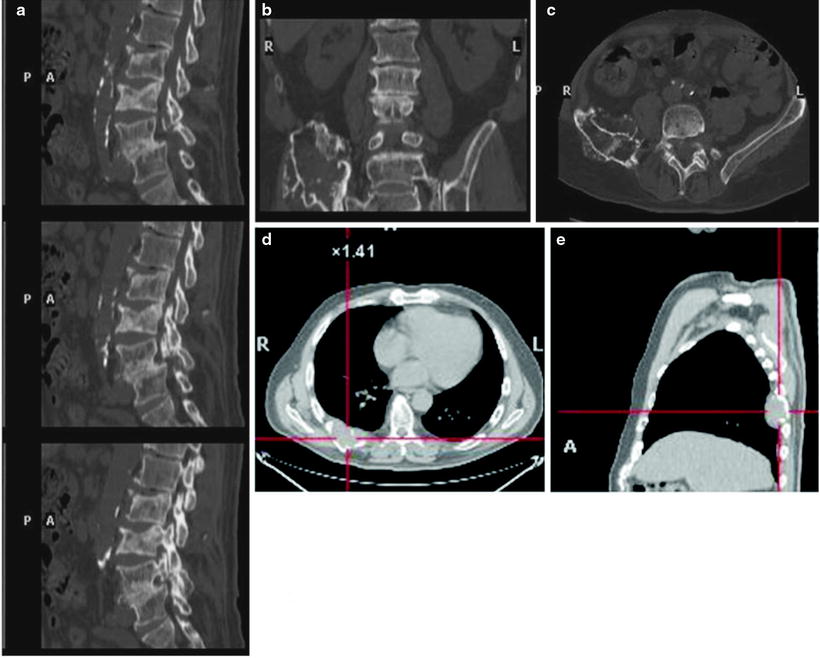
Fig. 8.4
Typical CT example of lytic lesions of the spine (a, sagittal view) and iliac bone (b and c in coronal and transaxial view, respectively) with the bone window. Panel on the bottom shows the transaxial (d) and sagittal (e) views of a posterior tract of right rib plasmacytoma
MRI is the method of choice for evaluating bone marrow involvement, based on the loss of the fatty bone marrow component consequent to replacement by plasma cells. MRI has high sensitivity in distinguishing focal or diffuse infiltration of the bone (especially in the spine), as well as detecting destruction of the mineral bone. Myeloma lesions in the marrow appear typically hypointense in T1-weighted sequences and hyperintense in T2-weighted and STIR sequences (Fig. 8.5). MRI findings reflect pathophysiological processes such as iron overload, amyloid deposition, or reactive marrow hyperplasia. Patients with MM may exhibit normal MRI appearance when the tumor burden is low, while focal or diffuse bone marrow infiltration exhibits variable patterns. At diagnosis, bone marrow infiltration is detected by MRI in 29–50% of the patients with Durie–Salmon stage I disease and negative plain radiographs. Furthermore, MRI has a certain prognostic significance, as the number of lesions detected correlates with response to treatment and with overall survival. Patients with advanced disease and normal MRI respond better to conventional chemotherapy and have better survival than patients with focal/diffuse bone marrow infiltration. Nevertheless, patients with positive MRI do not always require immediate treatment. In fact, in stage I treatment is not indicated until symptoms appear (Fig. 8.2). The detection of ≥10 spine lesions in patients with advanced stage is associated with an increased risk (6–11-fold) of fracture than patients with normal MRI or with less than 10 lesions have. MRI also enables to distinguish osteoporotic from malignant fractures and is the technique of choice when cord compression is suspected on clinical ground; in fact, it provides accurate information about the epidural space, the level and extension of cord or nerve root compression, and size of the lesion. The main disadvantages of MRI are represented by relatively low availability/access, high cost, and long scan duration (about 45 min). Moreover, claustrophobic patients or patients with metallic implant/device cannot undergo the exam. The typical MRI protocol for evaluating MM patients does not include some skeletal segments (i.e., the sternum, clavicles, and ribs) and therefore may underestimate the disease burden. Whole-body MRI (WB-MRI, Fig. 8.6) may overcome those limitations; in fact WB-MRI is more sensitive than WB-CT for assessing bone marrow infiltration (both focal and diffuse) and is recommended immediately after the X-ray survey. It allows to identify lesions early in their course (before osteolysis occurs) as well as to identify nonsecretory and macrofocal myeloma (especially in the spine and pelvis), which is characterized by lesions with low metabolism and activity. MRI may also be improved with the use of dynamic contrast-enhanced sequences (DCE-MRI) that evaluate the bone marrow microcirculation caused by myeloma-induced angiogenesis. The DCE-MRI-derived “A” variable describes intensity of the signal (therefore angiogenesis) and is found to be significantly increased in MM patients, in whom it correlates with the presence of osteolytic lesions, with the degree of bone destruction, and with the presence of local complications. The amplitude of “A” is a negative prognostic factor for event-free survival and for overall survival in MM [15, 19, 33].
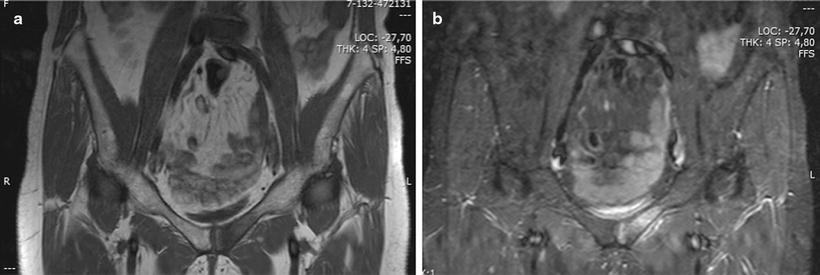
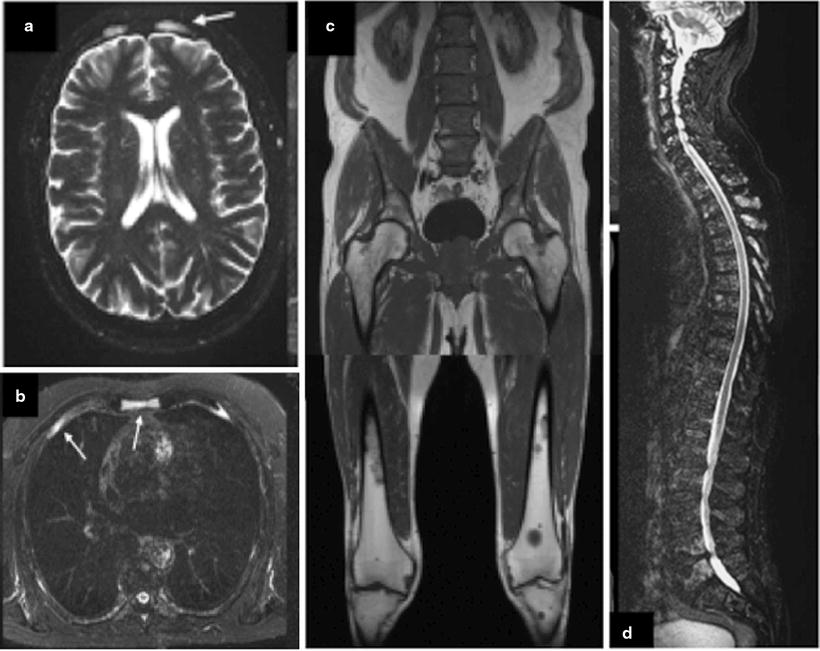
Fig. 8.5
STIR (a) and T2 (b) images of a lytic bone lesion of the left pubis. Hyperintense in T2-weighted and STIR sequences
Fig. 8.6
A 65-year-old patient with multiple myeloma WB-MRI demonstrates multifocal osteolyses in the cranial vault, sternum, and ribs (a and b) and in the lower extremities (d). Diffuse infiltration of the lumbar spine and pelvis is shown by the homogeneous signal decrease in bone marrow and demonstrated spinal involvement, particularly in the superior segment
Bone scintigraphy with 99mTc-labeled disphosphonate is not useful for diagnosis nor for staging of MM, as the detection of bone lesions is about 35–60% [15, 33], with sensitivities generally lower than that of conventional X-ray. In a comparison of the X-ray skeletal survey versus bone scintigraphy [34], increased uptake of the radiopharmaceutical in radiographically abnormal regions occurred in only 44% of the cases, while normal uptake was seen in 48% and reduced uptake in 8% of the cases. Lesions that are well defined on the bone scan are the result of complications in MM, mainly osteoblastic response to a compression fracture of a vertebral body or pelvic insufficiency fracture, soft-tissue calcifications within a plasmacytoma [35], or tumor-associated amyloidosis [36]. This pattern is consistent with the prevalent loss of bone mass not associated with osteoblastic activation, which is typical of the myeloma bone lesions. Thus, in MM, bone scintigraphy is generally nearly normal, or it may demonstrate areas with decreased radiopharmaceutical accumulation or the typical osteoporotic pattern (see example in Fig. 8.7a). On the other hand, bone scintigraphy may be helpful for evaluating some specific skeletal segments such as the sternum and ribs that can hardly be explored with plain X-ray (Fig. 8.7b).
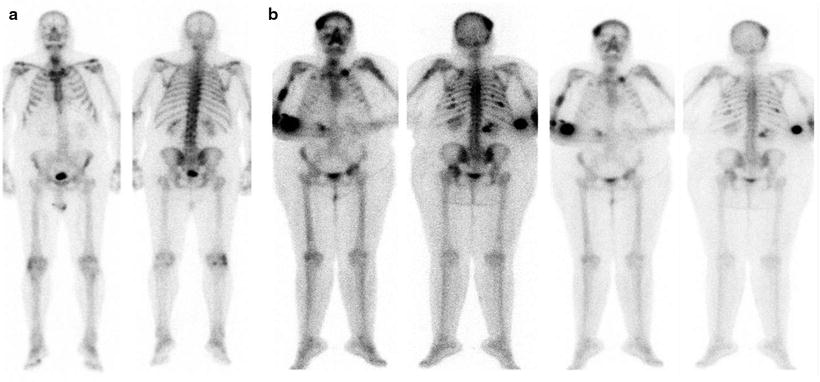
Fig. 8.7
(a) Typical pattern of mild and diffuse 99mTc-MDP uptake in a patients with MM. (b) Atypical appearance of multiple myeloma at bone scan: multiple lesions are evident as area of increased uptake at the skull, left clavicula, homeri, ribs, spine, left iliac bone and left femur
Nuclear medicine imaging with nonspecific oncotropic radiopharmaceuticals, such as 67Ga-citrate, 99mTc(V)-DMSA, 201Tl-chloride, 99mTc-sestamibi, or [18F]FDG, has all met greater success in imaging MM than typical bone scanning agents. 67Ga-citrate localizes in areas of active tumor either through primary localization within the tumor cells or because of the presence of mononuclear cell and lymphocytic infiltrates observed along with the plasma cells and characterizing the tumor-induced secondary “inflammatory response.” Whether these mechanisms act singly or in combination remains unknown [37–40]. 67Ga-citrate is rarely used for tumor detection in MM because increased uptake may be observed in some abnormal soft-tissue sites and in solitary myelomas of bone [41–44], although with variable degrees. Furthermore, the use of this radiopharmaceuticals is hampered by certain disadvantages versus 99mTc-sestamibi or [18F]FDG imaging, such as multiday scanning and low resolution. When infection is suspected in MM patients, 67Ga-citrate may be used if 99mTc-HMPAO-/111In-oxine-labeled autologous WBCs are not available. 99mTc(V)-DMSA has been reported to accumulate in plasmacytoma, irrespective of the presence of amyloidosis [45, 46].
201Tl-chloride has been used for the detection of MM, based on uptake mediated by either increased metabolic demand of the tumor or secondary inflammatory response induced in the marrow [47]. In a study comparing 201Tl-chloride and 99mTc-labeled bone-seeking agents in patients with MM, 201Tl-chloride was shown to be a promising agent for detecting disease [48]; however, in the clinical routine based on single-photon radiopharmaceuticals for characterizing MM patients, this agent is currently replaced by 99mTc-sestamibi, which shows similar localization properties, associated however with images of higher quality and lower cost.
99mTc-Sestamibi accumulates in cells with high metabolic requirements and can therefore be employed to assess in a semiquantitative manner the degree of bone marrow infiltration by plasma cells; this technique is both highly sensitive (92%) and specific (96%). The patterns of 99mTc-sestamibi uptake typical of MM can be described as normal (N), focal (F), diffuse (D), and mixed (F + D). Another semiquantitative score (similar to that originally described by Pace et al.) is based on extension (E) and intensity (I) of 99mTc-sestamibi uptake, as follows (Fig. 8.8):
Fig. 8.8
99mTc-Sestamibi scintigraphy demonstrating different degrees on bone marrow involvement: focal (a, b, and d) and diffuse (c) or I3E3 (A–D)
E0 = no evidence of bone marrow uptake
E1 = uptake confined to the spine and pelvis
E2 = uptake in the spine, pelvis, and ribs or in the proximal humeral and femoral epiphyses
E3 = uptake in the spine, pelvis, and ribs and in distal humeral and femoral epiphyses
I0 = no evidence of bone marrow uptake
I1 = bone marrow uptake < uptake in the myocardium
I2 = bone marrow uptake = uptake in the myocardium
I3 = bone marrow uptake > uptake in the myocardium
The degree of radiopharmaceutical uptake correlates well with the degree of plasma cell infiltration, with the amount of a monoclonal component, with the clinical status, and with stage of the disease. In some studies, good correlation was also found between 99mTc-sestamibi uptake and other parameters of disease activity, such as the serum levels of lactate dehydrogenase, C-reactive protein, and β2-microglobulin. Diffuse moderate or intense 99mTc-sestamibi uptake or focal uptake correlates with poor prognosis. Furthermore, statistically significant correlation between the baseline 99mTc-sestamibi uptake patterns and overall survival was found in patients with newly diagnosed symptomatic MM, with focal or combined focal and diffuse patterns associated with worst prognosis with shorten overall survival (of 50 and 9 months versus 68 months of patients with normal pattern) [49]. However, 99mTc-sestamibi imaging is less sensitive than MRI (50.5% vs. 100%) [50] for evaluating focal lesions localized in the spine (especially in patients with early disease stage), because scintigraphic assessment of such segment is hampered by the high physiologic uptake in the liver and bowel. SPECT imaging has been shown to overcome the relatively poor spatial resolution of planar 99mTc-sestamibi scintigraphy. It is important to emphasize that the 99mTc-sestamibi scan is always negative in case of MGUS, while false-negative results have been described in case of overexpression of P-glycoprotein, associated with multidrug-resistant myeloma [15, 19, 51–53].
Agool et al. [54] have recently proposed the use of somatostatin receptor (SSTR) imaging as an alternative method to visualize malignant plasma cells. In fact, in vitro studies have demonstrated that MM cell lines express functional SSTR2, SSTR3, and SSTR5, the latter being the most represented. Additionally, in vitro growth of myeloma cells can be inhibited by somatostatin and octreotide. Preliminary data in patients with relapsing MM indicate that SSTR imaging is very sensitive, demonstrating abnormal accumulation in 82% of patients compared to a 33% detection rate with whole-body X-ray. Partial or total normalization of the scintigraphic pattern has also been observed in patients responding to treatment. The expression of SSTR could be related to aggressiveness of the disease. However, the limitation represented by poor spatial resolution of planar images (used in this trial) can be overcome either by employing SPECT/CT or by using PET/CT with a positron-emitting SSTR analogue (i.e., 68Ga-DOTATOC).
Scintigraphy with the serum amyloid P (SAP) labeled with either 99mTc or 123I has been proposed to confirm the diagnosis [15, 33, 54] and to quantify the extent of the deposits of light chain (AL) amyloidosis. However, additional data is required to define the potential clinical role of this imaging technique.
[18F]FDG is the standard for radionuclide imaging in patients with MM because it identifies early bone marrow infiltration in patients with apparent solitary plasmacytoma and demonstrates that the extent of extramedullary involvement in [18F]FDG-PET shows both high sensitivity (86.3%) and high specificity (92%) [55], with the additional advantage of distinguishing between metabolically active disease ([18F]FDG positive) and clinical conditions characterized by very low burden, such as MGUS or smoldering disease ([18F]FDG negative). [18F]FDG uptake of bone marrow in MM patients is related to the percentage of CD38/CD138 expressing plasma cell infiltration of bone marrow [57]. Therefore, [18F]FDG-PET shows focal or diffuse pattern of uptake reflecting the distribution of bone marrow disease. While patients with MGUS generally have a negative [18F]FDG-PET scan (although diffuse low-grade bone marrow uptake can occasionally be observed), the appearance of [18F]FDG focal uptake in a patient with MGUS indicates transformation into an active myeloma. Identification of extramedullary disease on a [18F]FDG-PET scan performed at diagnosis correlates with poor prognosis (see Figs. 8.9 and 8.10 for different representative patterns of [18F]FDG uptake in patients with plasmacytoma and MM, respectively). An early clinical investigation on the performance of [18F]FDG-PET in MM (66 patients followed serially) showed the capability of the technique to identify patients with high-risk disease and to monitor patients either nonsecretory myeloma or in CR without measurable M-component [58]. Such initial observations were subsequently confirmed by other studies, also demonstrating that [18F]FDG-PET could lead to upstaging of the disease in 31–37.5% of patients (depending on the series) and to changes in treatment management in up to 56% of the cases [59]. These results stimulated larger studies with [18F]FDG-PET in patients with myeloma [ 60]. Data derived from the National Oncologic PET Registry (NOPR), a large prospective program aiming at recording changes of the intended clinical management of cancer patients on the basis of the [18F]FDG-PET/CT findings, have further confirmed this trend. The registry has so far included over 1,300 myeloma patients (13.1% scan/incidence in 2007), showing a definite impact on management in about 52% of patients when the scan was requested for staging purpose, 46% in case of restaging, and 51% in presence of suspected recurrence.
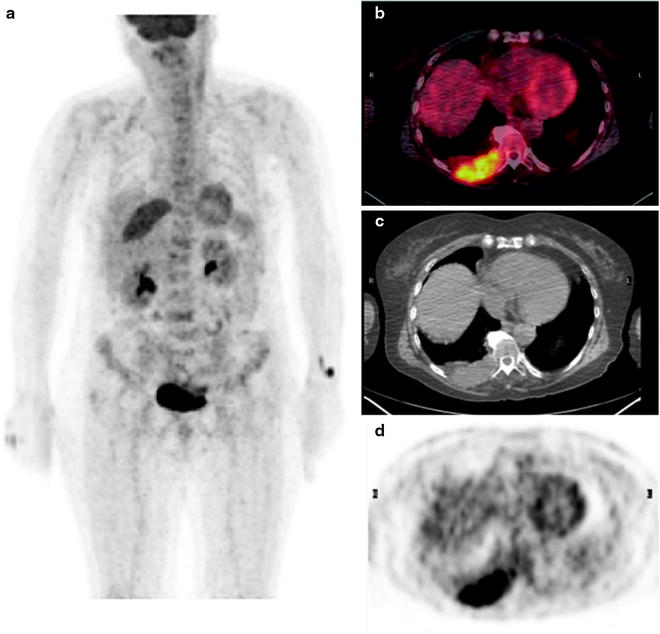
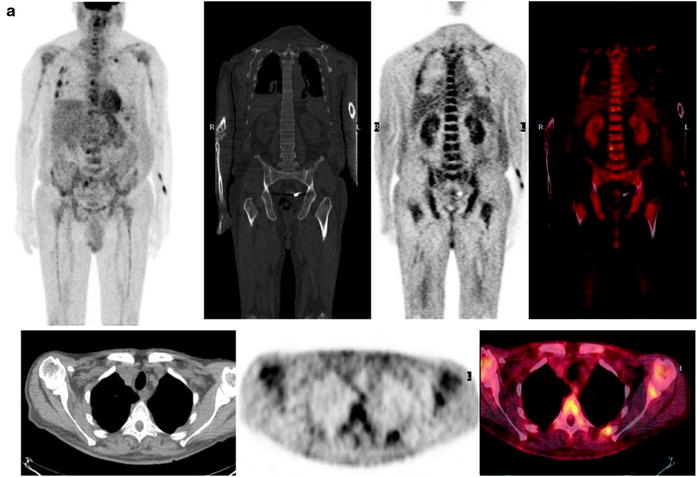
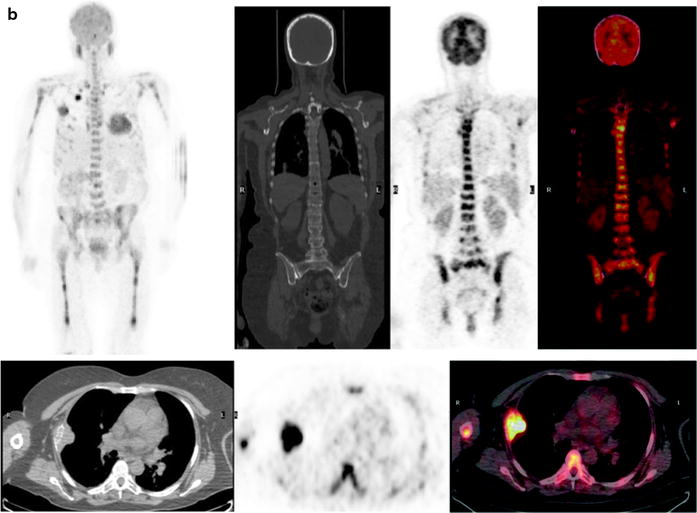
Fig. 8.9
The typical representative patterns of [18F]FDG uptake in patients with solitary plasmacytoma. MIP images (a) and the relative transaxial sections on fused images (b), CT (c), and PET (d) demonstrating an intense area of radiopharmaceutical uptake corresponding to a large lesion developing from the posterior portion of the right rib. No additional lesions are present in any other bone segments
Fig. 8.10
(a and b) Different patterns of [18F]FDG uptake in patients with MM. (a) Diffuse and moderate [18F]FDG uptake in bone (as intense as the liver uptake) with focal area of major accumulation corresponding to multiple bone sites of active myeloma. Top: MIP images and coronal view (CT with bone window, PET and fused images). Bottom: transaxial view showing humeral, scapular, spine, and rib involvement (CT with mediastinal window, PET and fused images). (b) Diffuse and intense [18F]FDG uptake in bone (more intense than the liver) with focal area of major accumulation corresponding to multiple bone and soft-tissue sites disease. Top: MIP images and coronal view (CT with bone window, PET and fused images). Bottom: transaxial view showing humeral, spine, sternum, and rib involvement with a judge lesion of the lateral right rib involving the chest wall (CT with mediastinal window, PET and fused images). Of notice, [18F]FDG reproduces the pattern of homogeneous and diffuses uptake along the homeri and femuri which is typical of 99mTc-sestamibi, but with better spatial resolution
In MM, the 2.5 threshold for the standardized uptake value (SUV, often considered as the cutoff for other forms of cancer) may not be applicable. In fact, many lesions <10 mm (that are obvious on MRI or using dedicated CT) cannot be detected on the [18F]FDG scan using this threshold if one does not take into account the recovery coefficient, whereby SUV decreases along with decreasing lesion size. Therefore, the complementary imaging information provided by the CT component of a [18F]FDG-PET/CT examination is very effective, even if CT is performed in most cases in the low-dose mode. With all these considerations in mind when interpreting [18F]FDG-PET/CT scans, this imaging modality has greater sensitivity than both plain X-ray (89.2% vs. 47.4%) and CT alone (89.2% vs. 70.4%) [61]. In addition to demonstrating persistent or recurrent osseous disease, [18F]FDG-PET/CT is more sensitive than other imaging modalities for localizing extramedullary sites of disease, thus revealing additional lesions in almost 30% of the patients who had been diagnosed with solitary plasmacytoma by MRI [62, 63]; this results in upstaging extent of the disease and has therefore a relevant impact on the choice of therapeutic strategies [64–66]. However, sensitivity of [18F]FDG-PET for assessing diffuse disease in the spine and pelvis remains almost half than that of MRI [53].
Thus, while [18F]FDG-PET/CT performs better than either 99mTc-sestamibi scintigraphy or MRI in detecting focal bone and bone marrow lesions, MRI remains the method of choice for evaluating diffuse bone marrow infiltration in the spine, considering that diffusely increased nonspecific [18F]FDG uptake is frequently observed in the bone marrow of young people or in patients with anemia [53, 59, 67]. [18F]FDG-PET/CT is therefore recommended for accurate initial staging of patients with MM, while MRI is to be preferred when assessing the degree of bone marrow infiltration by plasma cells in the early phase of the disease. By combining MRI of the spine/pelvis and whole-body PET/CT, the ability to detect sites of active MM, both medullary and extramedullary, can be as high as 92%. Particularly, the association between a SUVmax value > 3.5 in spine lesion and either diffuse or multifocal vertebral body involvement at MRI seems to indicate an impending fracture [68]. Although rarely, active disease demonstrated with osteo-medullary biopsy may be missed by both [18F]FDG-PET/CT and MRI (false-negative cases); however, when [18F]FDG-PET/CT and MRI are concordantly positive, no false-positive results are generally observed, thus yielding specificity and positive predictive values close to 100%. This consideration is of value in aiding clinicians to either continue with or change chemotherapy regimens on the basis of persistently positive findings on imaging studies. The low negative predictive values of [18F]FDG-PET/CT (50%) and MRI (59%) and also of the combination of the two (64%) suggest that negative results should always be considered with caution and correlated to other markers of disease activity [69].
The prognostic significance of [18F]FDG-PET/CT is not yet well established. Bartel et al. [70] recently evaluated the prognostic value of [18F]FDG-PET/CT in patients with newly diagnosed MM. By applying tertile-derived cut points, several imaging parameters affected overall survival and event-free survival adversely, in particular the presence of extramedullary disease and the number of lytic lesions detected by metastatic bone survey, and the number of focal sites of [18F]FDG uptake. Abnormal MRI findings and high SUV of focal [18F]FDG uptake were associated with shorter event-free survival, while having borderline effects on overall survival. The number of lesions detected by PET/CT was the parameter most closely correlated with other prognostic variables, such as β2-microglobulin, lactate dehydrogenase, and C-reactive protein and gene expression profiling-derived indices: positive correlation with high-risk and two proliferation parameters and inverse correlation with low bone disease subgroup. The PET/CT findings also maintained an independent adverse prognostic value, if combined with positive cytogenetic abnormalities and elevated lactate dehydrogenase levels. [18F]FDG-PET/CT identified 30% of patients who had poorer prognosis despite having low-risk disease as defined by gene expression profiling analysis. Based on logistic regression analysis, the PET findings were independently positively correlated to both MRI and metastatic bone survey. Among the non-imaging parameters, the results of PET correlated positively with C-reactive protein and negatively with gene array-defined low bone disease.
[18F]FDG uptakes of bone marrow and extramedullary lesions on PET/CT scans are significantly correlated with established prognostic factors and a baseline higher SUVmax value of extramedullary lesions significantly predicted inferior OS (). Although 18F-FDG uptake of bone marrow on PET/CT scan significantly predicts the percentage of plasma cell infiltration (SUVmax > 2.05 predicted > 30% plasma cells in bone marrow biopsies with sensitivity 71.9% and specificity 58.2%), in multivariate analysis MRI was the independent predictor of the bone marrow plasma cell counts in MM patients [71]. [18F]FDG-PET also offers the advantage of identifying any superimposed infectious condition (not rarely associated with MM) or possible complications of treatment (such as vascular infections), with resulting changes in patients’ management. On the other hand, such high sensitivity (associated with the intrinsically low specificity of [18F]FDG uptake) can increase the false-positive results when the scan is performed within a short interval after radiotherapy or surgery; it is therefore recommended to perform the scan when about 4 weeks after a surgical procedure or 2–3 months after completion of radiotherapy [59, 72].
The diagnostic potential of non-[18F]FDG positron-emitting radiopharmaceuticals has been investigated also in patients with MM. In particular, [11C]choline (a precursor of phospholipid synthesis whose uptake is increased in proliferating cells) has recently been comparatively evaluated by Nanni et al. versus [18F]FDG [73]. These authors suggest that the superior sensitivity of [11C]choline-PET/CT over [18F]FDG-PET/CT for detecting bone lesions is due to the high phospholipid metabolic rate of myelomatous cells, as these compounds are involved in the modulation of intracellular growth signal transduction pathways. The main clinical disadvantage in the use of [11C]choline is its high physiological liver uptake that prevents detection of hepatic lesions.
Results of in vitro experiments showing that the radiolabeled amino acid [11C]methionine is incorporated into immunoglobulins produced by the malignant plasma cell clones have prompted a clinical study performed with [11C]methionine-PET/CT in MM patients by Dankerl et al. [74]. Consistently with the underlying hypothesis, osteolytic lesions exhibited a high uptake of [11C]methionine, similar to that of [18F]FDG. Furthermore, newly diagnosed osteolytic lesions in untreated patients were strongly [11C]methionine positive, while recurring osteolytic lesions were [11C]methionine negative. Although the series evaluated in this study was relatively small, the substantial mismatch between the number of lesions identified by [11C]methionine-PET and those identified by CT represented an important added value of metabolic imaging for early detection of lesions not yet obvious as macroscopic bone changes; these findings would therefore provide an accurate estimate of tumor burden, particularly for clinically silent and unexpected localizations.
PET/CT with 3′-18F-fluoro-3′-deoxy-l-thymidine 18F-FLT, whose uptake mirrors DNA synthesis via thymidine kinase-1, which is highly expressed in tumor cells during the S-phase of the cell cycle) has been proposed to distinguish hematological malignancies (specifically highly proliferating syndromes such as myelodysplasia and myeloproliferative disorders) from other clinical conditions causing pancytopenia. Although the exact mechanism of 18F-FLT uptake in bone marrow remains unclear, several studies suggest that such event is linked to the cycling activity of hematopoietic cells, thus reflecting the state of the entire bone marrow compartment [19]. Bone marrow uptake of 18F-FLT is intense in patients with myelodysplasia and myeloproliferative disorders, while it is lower to absent in patients with MM, myelofibrosis, or aplastic anemia. Patients with MM may present variable degrees of 18F-FLT uptake in response to bone marrow expansion into the peripheral bones.
Extensive skeletal involvement has also been incidentally detected during PET with [11C]acetate [75]. It is not entirely clear why myelomatous lesions would exhibit such high uptake of [11C]acetate, although this observation is consistent with a much earlier in vitro study with plasma cells obtained from patients with MM, showing enhanced uptake of acetate as a substrate for the Krebs cycle [76]. On the other hand, it is well known that malignant cells (including MM cells) typically have increased glycolysis versus their normal counterparts, as also confirmed by a correspondingly increased [18F]FDG consumption; since the Krebs cycle (whose metabolic substrate is acetate) constitutes a component of overall glycolysis, it is not surprising that uptake of both [18F]FDG and [11C]acetate can be found enhanced in MM.
Despite the considerable amount of favorable results reported so far, the “guideline for the use of imaging in the management of myeloma” does not recommend [18F]FDG-PET nor 99mTc-sestamibi scintigraphy for routine use in the management of MM patients [15, 33]. Instead, the possibility of employing either imaging technique is considered only in selected cases, as follows: (a) to clarify previous indetermined imaging findings, preferably within clinical trials (grade C recommendation, level IV evidence) and (b) when suspecting extramedullary disease in cases where other imaging techniques have failed to define the condition ([18F]FDG-PET preferred, with grade B recommendation, level III evidence, and performing the procedure within 4 weeks of chemotherapy or 3 months of radiotherapy). More recently, [18F]FDG-PET/CT has been included in the National Comprehensive Cancer Network 2010 guidelines, as an option under some selected circumstances in the initial diagnostic workup [77]. SAP scintigraphy is included in the “guideline for the use of imaging in the management of myeloma” with a grade 2 recommendation, level IIB evidence [33].
Assessing Response to Treatment
Many criteria can be employed to assess response to therapy in MM patients, including those set by the European Group for Blood and Bone Marrow Transplant/International Bone Marrow Transplant Registry/American Bone Marrow Transplant Registry, by the Chronic Leukemia-Myeloma Task Force, by the Southwest Oncology Group (SWOG), and by the Eastern Cooperative Oncology Group (ECOG). In 2006, the International Myeloma Working Group (IMWG) recognized the importance of standardizing such criteria and elaborated the so-called uniform response criteria (Table 8.5). While adopting the classical categories of complete response (CR), partial response (PR), stable disease (SD), and progressive disease (PD), the system introduced the new category of “positive response of additional clinical significance” following treatment. Although the IMWG response criteria deleted the category “minor response” (considered to be somewhat vague and therefore unreliable), more recently, this category has been reintroduced by the ASH-FDA in patients with relapsed refractory myeloma, while specific criteria for progression have been defined for SMM (Table 8.6) [7]. Although changes in bone marrow infiltration is not employed as a guiding criterion for assessing response to treatment, finding <5% plasma cells is one of the requisites for complete remission. Furthermore, in patients without measurable disease, it is possible to monitor the disease by the serum-free light chain assay criteria. Irrespective of the specific system employed to classify response to treatment, the main pitfall of these systems is represented by the method used to assess bone marrow and bone lesions. In fact, plain radiography is of limited value for evaluating the response to treatment; in particular, even if the appearance of new bone lesions clearly indicates disease progression, lytic bone lesions rarely show radiologic signs of recovery. Furthermore, new compression vertebral fractures may occur either in case of disease progression or in case of bone loss or in case of reduction of the tumor mass that supports the bone cortex [3 7, 19, 53]. CT is not generally used for assessing response to treatment, since osteolytic lesions rarely recover. In selected cases, mainly those characterized by significant soft-tissue component (i.e., plasmacytoma), response to therapy can instead be demonstrated by reduction in tumor size as assessed with CT. Moreover, CT may be of value in patients with persistent unexplained symptoms despite therapy, or with risk if impending fracture, or when no clinico-biochemical response to treatment is observed. The disappearance of any MRI-detectable bone marrow lesions typically represents complete response, while a partial response to therapy is associated with changes of the MRI pattern from diffuse to focal/variegate or with the reduction of the signal on the T2-weighted spin echo images. Nevertheless, MRI has limited value for the early assessment of response to treatment, since complete resolution of bone marrow lesions may take as long as 9–12 months from the completion of the therapy. DCE-MRI has shown to be superior to standard MRI for this purpose; in particular, favorable response is indicated by the disappearance of gadolinium enhancement or by the absence of contrast-induced rim enhancement in a follow-up study as compared to the baseline scan. However, the real added value of this technique seems to lie in the possibility to predict which patients might benefit from therapy with anti-angiogenetic drugs, i.e., bevacizumab (a monoclonal antibody that inhibits the vascular endothelial growth factor, VEGF). In a recent study comparing post-treatment bone marrow changes at whole-body dynamic contrast-enhanced MRI with clinical response, quantitative MRI analysis demonstrated extensive overlap of results between good and poor responders and a substantial number of outliers, underlining that MRI may be of limited use for the evaluation of treated patients [78]. Therefore, this approach has not yet gained a definite role in the evaluation of the course of the disease and of activity of the myeloma lesions. Given the heterogeneous nature of the disease and inconsistent response to treatment, along with the relatively small number of published studies in this field, MRI currently has a limited role in response assessment.
Table 8.5
International Myeloma Working Group uniform response criteria for MM
Category | Criteria |
|---|---|
Complete response (CR) | Negative immunofixation of serum and urine and disappearance of any soft-tissue plasmacytomas and <5% plasma cells in bone marrow Patients with only measurable disease by serum FLC levels: CR is defined as normal FLC ratio (0.26–1.65) in addition to CR criteria listed above |
Stringent complete response (sCR) | Negative immunofixation of serum and urine and disappearance of any soft-tissue plasmacytomas and <5% plasma cells in bone marrow and normal FLC ratio and absence of clonal cells in bone marrow by immunohistochemistry or immunofluorescence |
Very good partial response (VGPR) | Serum and urine M-protein detectable by immunofixation but not on electrophoresis or ≥90% or greater reduction in serum M-protein plus urine M-protein <100 mg/24 h Note: Patients with only measurable disease by serum FLC levels: VGPR is defined as a >90% decrease in the difference between involved and uninvolved FLC levels |
Partial response (PR) | ≥50% reduction of serum M-protein and reduction in 24 h urinary M-protein by ≥90% or to <200 mg/24 h and ≥50% reduction in the size of soft-tissue plasmacytomas if present at baseline Note: If the serum and urine M-protein are unmeasurable: ≥50% decrease in the difference between involved and uninvolved FLC levels If serum and urine M-protein and serum FLC are unmeasurable: ≥50% reduction in bone marrow plasma cells, provided baseline percentage was ≥30% |
Stable disease (SD) | Not meeting criteria for CR, VGPR, PR or PD |
Progressive disease (PD) | >25% from lowest response value in any one or more of the following: Serum M-protein (absolute increase must be ≥0.5 g/dL)a Urine M- protein (absolute increase must be ≥200 mg/24 h) Only in patients without measurable serum and urine M-protein levels: the difference between involved and uninvolved FLC levels (absolute increase must be >10 mg) Bone marrow plasma cell percentage (absolute % must be ≥10%) Definite development of new bone lesions/soft-tissue plasmacytomas or definite increase in size of existing bone lesions/soft-tissue plasmacytomas Development of hypercalcemia (corrected serum calcium >11.5 mg/dL) ascribable solely to the plasma cell proliferative disorder |
Table 8.6
Additional response criteria for specific disease stages. International Myeloma Working Group uniform response criteria for MM
Category | Criteria |
|---|---|
Relapsed MM | At least one prior regimen and not meeting criteria for relapsed and refractory MM |
Relapsed and refractory MM | Relapse of disease while on salvage therapy or progression within 60 days of most recent therapy |
Minor response (MR) in patients with relapsed refractory MM | ≥25% but <49% reduction of serum M-protein and reduction in 24 h urine M-protein by 50–89%, which still exceeds 200 mg/24 h and reduction in size (25–49%) of any soft-tissue plasmacytoma and no increase in size/number of lytic bone lesions (development of compression fracture does not exclude response) |
Progression to active MM in patients with smoldering MM | Evidence of PD based on the IMWG criteria (Table 9) and any one or more of the following: Development of new lesion (soft-tissue plasmacytoma/bone lesions) Hypercalcemia (>11 mg/dL) Decrease in hemoglobin of ≥2 g/dL Serum creatinine level ≥2 mg/dL |
Table8.7
Rai and Binet staging systems
Rai Stage | High levels of lymphocytes | Swollen lymph nodes | Enlarged spleen or liver | Anemia | Low levels of platelets |
|---|---|---|---|---|---|
0 | Yes | No | No | No | No |
I | Yes | Yes | No | No | No |
II | Yes | Yes or no | Yes | No | No |
III | Yes | Yes/no | Yes or no | Yes | No |
IV | Yes | Yes or no | Yes or no | Yes or no | Yes |
Binet stage | Number of lymph node areas | Anemia | Low levels of platelets |
|---|---|---|---|
A | <3 | No | No |
B | 3 or more | No | No |
C | Any number | Yes (or low platelets) | Yes (or anemia) |
Several studies [53, 79] have found a close correlation between the results of 99mTc-sestamibi scintigraphy (i.e., disappearance of any area of uptake) and the conventional criteria used for defining clinical response to therapy (i.e., measurement of the M-protein component). Overall, these findings support the hypothesis that bone marrow uptake is an indicator of myeloma activity in bone marrow, even in the absence of focal areas of increased uptake. This procedure has shown high specificity (86%) in patients in CR, whereas sensitivity was 45% in presence of PR; these findings emphasize the high performance of 99mTc-sestamibi scintigraphy for identifying absent disease, whereas its sensitivity is lower for the definition of residual disease when response is not complete. Multivariate analysis also showed that the sensitivity of 99mTc-sestamibi scintigraphy was low in presence of bone marrow infiltration <30.
The prognostic value of 99mTc-sestamibi imaging for predicting recurrence of the disease has been extensively investigated by Pace et al. [51]. In a group of patients evaluated both at baseline and after chemotherapy, they demonstrated a significant association between pretreatment scintigraphic pattern and clinical status at follow-up. In particular, none of the patients responding to therapy had a posttreatment 99mTc-sestamibi scan showing focal uptake or diffuse uptake with a summed score higher than 2; by contrast, the nonresponders showed either diffuse bone marrow uptake or areas of focal uptake with summed score higher than 2. A negative baseline 99mTc-sestamibi imaging showed high prognostic value for clinico-biochemical remission, and multivariate analysis demonstrated the added value of the 99mTc-sestamibi uptake pattern with respect to known prognostic variables, such as C-reactive protein. Furthermore, 99mTc-sestamibi imaging patterns at follow-up were significantly associated with the clinical status evaluated after chemotherapy.
In an independent study, a semiquantitative parameter of 99mTc-sestamibi washout derived from dual point scintigraphic acquisitions as the counts/pixel at early imaging (10 min) minus counts/pixel at delayed imaging (60 min) divided by counts/pixel at 10 min (corrected for decay) has been also employed to distinguish patients responding to treatment from nonresponders. A fast clearance of 99mTc-sestamibi from the bone marrow of patients with MM is associated with poor response to subsequent chemotherapy. 99mTc-sestamibi washout reflects the degree of expression of the P-glycoprotein (Pgp), a transmembrane protein which mediates the outward transport of many cytotoxic compounds including a variety of anticancer agents and confers tumor cells the capability to escape the lethal effect of many cytotoxic compounds, thus causing multidrug resistance (MDR). Overexpression of Pgp in resistant cultured tumor cells causes a reduced net uptake of 99mTc-sestamibi as a consequence of an enhanced Pgp-dependent outward transport of the tracer [80]. Thus, since overexpression of Pgp is one of the primary mechanisms of MDR in MM as well as in other malignancies [81, 82], it can be hypothesized that the 99mTc-sestamibi washout rate could serve to predict response to chemotherapy in MM patients.
However, all these studies have included small groups of patients, and none of them evaluated the impact of 99mTc-sestamibi scintigraphy on progression-free survival and overall survival.
The first indications that mid-treatment scans reflected treatment response came from the study of Jadvar et al. [83], in which 3 MM patients were followed before and after therapy. A decline in metabolic activity on [18F]FDG PET scan concordant with clinical improvement was present in 2 patients while in the remaining patient the appearance of new hypermetabolic lesions and higher metabolic activity in the previously known lesions was concordant with disease progression. In case of effective response to therapy, [18F]FDG uptake declines rapidly (within hours). The persistence of a positive [18F]FDG-PET has high prognostic value, as it correlates with early recurrence. Baseline SUV is helpful for the prediction of progression-free survival after first-line anthracycline-based chemotherapy, but the decrease of SUV after 1 chemotherapy cycle lacked of clinical significance [84]. Furthermore, [18F]FDG-PET/CT represents the most sensitive imaging technique to evaluate response of the bone lesions to treatment, particularly for distinguishing treated bone marrow lesions from viable neoplastic tissues [7, 19, 67, 85].
[18F]FDG-PET/CT has recently been employed in patients with newly diagnosed MM as part of the “Total Therapy 3” study, characterized by 4 distinct phases of induction therapy (2 cycles of VDT-PACE with peripheral blood stem cell collection after the first cycle + tandem transplantation with melphalan 200 mg/m2, consolidation with 2 cycles of dose-reduced VDT-PACE, and maintenance therapy for 3 years, with monthly cycles of VTD for the first year and thalidomide plus dexamethasone in years 2 and 3) [70]. The exam was performed at baseline (together with metastatic bone survey and MRI) and within 10 days from starting the first induction cycle of VDT-PACE. The follow-up studies included annual metastatic bone survey, while MRI scans were performed before each of two transplantations, before consolidation and maintenance phases, and semiannually thereafter. All imaging studies were also repeated at relapse, defined by M-protein and bone marrow criteria and by any of the imaging procedures. Similarly as in the case of other malignancies such as lymphoma, disappearance of [18F]FDG uptake before transplantation proved to be an independent favorable prognostic factor, thus demonstrating the importance of complete suppression of tumor metabolism in myeloma. Using the [18F]FDG-PET/CT criteria (absence of [18F]FDG focal uptake in bone segments and extramedullary disease), the authors were able to define CR status in 92% at 18 months, which became obvious earlier than the median onset of clinical n-CR (87%) and CR status (56%) by 4 and 12 months, respectively. The cumulative proportion of patients qualifying for MRI-defined CR was 29% at 18 months and reached 59% at 48 months. In patients without focal lesions, MRI-defined CR (hypointensity on STIR images) was reached in 62% at 18 months, similar to 56% of the patients attaining clinical CR status. While very early [18F]FDG-PET/CT changes (at 10 days) did not affect outcome, complete [18F]FDG suppression and extramedullary disease before transplantation conferred superior overall and event-free survival; in fact, 30 months after the first autotransplantation, 92% and 89% of the patients were alive and event-free compared with 71% and 63% among those with less than 100% disappearance of [18F]FDG uptake. Complete [18F]FDG suppression before the first transplantation correlated with superior outcomes in both low-risk and high-risk gene array-defined risk groups, reaching statistical significance for overall survival in low risk and for event-free survival in high-risk myeloma. Normalization of the PET findings before transplantation was associated with improved outcomes, whereas gene array-defined high-risk designation conferred poor overall and event-free survival. In the absence of molecular genetic data, the favorable implications of pretransplantation [18F]FDG suppression were canceled by elevated serum levels of lactate dehydrogenase and β2-microglobulin. Clinical CR or n-CR status before transplantation did not impact post-transplantation survival outcomes. The prognosis of high-risk patients not achieving complete [18F]FDG suppression was especially poor. In the post-transplant setting (either autologous or allogeneic stem cell transplantation), [18F]FDG PET/CT may contribute to the detection and localization of disease, provide information about the extent of distinct myeloma manifestations and the total disease burden and add information about the metabolic activity of disease. Overall performance of [18F]FDG PET/CT in terms of sensitivity, specificity, positive predictive value and negative predictive value was considerably better in patients who had received only autologous stem cell transplantation (64.7%, 88.9%, 91.7% and 57.1% versus 50.6%, 80%, 78.2% and 53.3%, respectively). However, lower sensitivity for this purpose compared to the pretreatment setting was found since in patients with very good partial response (90% or greater reduction in serum paraprotein) ability of PET to detect myelomatous lesions was low (34.1%), possibly as a consequence of reduced myeloma cell mass [86].
DEXA Scanning
The World Health Organization has identified dual-energy X-ray absorptiometry (DEXA) as the gold standard for measuring the severity of osteoporosis, for defining the risk of fractures, and for assessing changes in bone mineral density over time. This method is fast and noninvasive and implies a low radiation burden to patients (between 0.001 and 0.01 mSv). However, bone mineral density can be affected by pathological conditions such as vertebral collapse and spinal osteophytes that are often concomitant in patients with MM. At present, DEXA scanning cannot distinguish benign osteoporosis from osteoporosis induced by myeloma. Furthermore, the reduction in bone mineral density in patients with MM usually is not diffuse, but is rather confined to the hematopoietically active portion of the skeleton. For these reasons, the use of DEXA scanning in patients with MM is controversial [15, 33].
Leukemia
Leukemia is a cancer of the bone marrow and blood. Over 250,000 people are diagnosed with leukemia each year, accounting for 2.5% of all cancers and 30.4% of all hematologic malignancies. Leukemias are the most common pediatric tumor (about 35% of cancers in children aged 0–14 years), but all age groups can be affected. Approximately 11% were diagnosed < 20 years, 11% between 20 and 44, 10% between 45 and 54, 14% between 55 and 64, 21% between 65 and 74, 23% between 75 and 84, and 10% after 85 years [87].
The leukemia is considered lymphocytic or lymphoblastic if it occurs in a marrow cell that forms lymphocytes while is “myelogenous” or “myeloid” if occurs in a marrow cell that forms red cells, some kinds of white cells, and platelets. Leukemias are usually divided into four major categories:
Acute lymphocytic leukemia (ALL)
Chronic lymphocytic leukemia (CLL)
Acute myelogenous leukemia (AML)
Chronic myelogenous leukemia (CML)
The four main types of leukemia are further classified into subtypes that are based on specific features of cells [88].
Acute Lymphocytic Leukemia (ALL) in Adults
The age-adjusted overall incidence of ALL in the United States is 1.5 per 100,000 population with peaks between ages 2 and 5 years and again after age 50 years [89]. ALL is more frequent among Caucasians, in affluent societies, and in urban areas, giving rise to speculation about socioeconomic factors in its etiology [90]. Associations with environmental, socioeconomic, infectious, and genetic events are being studied extensively. Few causal links have been established, and the etiology of ALL remains obscure in most cases. The strongest associations to date exist with genetic factors and the role of Epstein–Barr virus and human immunodeficiency virus in patients with mature-B-cell ALL.
ALL occurs both in children and in adults. In children and adolescents, ALL accounts for almost 1/3 of all cancers under age 15 and 1/4 of cancers occurring before age 20. The American Cancer Society predicts that about 2,700 children will be diagnosed with leukemia in the United States during the year 2002. ALL is most common in early childhood, peaking between ages 2 and 5 years of age. In adults, the age of appearance is one of the most important prognostic determinants. Although the two forms share some common features, fundamental biologic differences may account for the striking variation in outcome. Younger children (4–10 years old) have a better prognosis than adolescents, with further deterioration as patients get older [91, 92]. In adults, those less than 30 years of age have ∼20% survival advantage compared with older patients, and long-term survival is infrequent in patients greater than the age of 60 years [93]. Approximately 95% of children achieve complete remission with initial therapy while CR rates in adults are maximally 80–90%.
The frequency cytogenetic findings (structural abnormalities or translocations) differ markedly in adults and children with ALL. Some of these translocations were specifically associated with B-cell lineage ALL, while others are associated with T-cell lineage. The most frequent (15–30%) and clinically relevant structural abnormality in adult ALL remains translocation t(9;22)(q34;q11) (Philadelphia chromosome [Ph]) with BCR–ABL1 fusion [94]. Germ-line mutations account for not <5% of childhood leukemia (i.e., TP53, NF1, AT); Down’s syndrome, Klinefelter’s syndrome, as well as several other genetic disorders (neurofibromatosis, ataxia telangiectasia, Wiscott–Aldrich syndrome, and Fanconi’s anemia) increase the risk of ALL.
The WHO classification states that 20% or a greater amount of blasts are sufficient for the diagnosis of ALL. The blasts from the majority of adults and children with ALL derive from the B-cell lineage. Immunophenotyping has contributed to a prognostically relevant view of the leukemic blasts in ALL. Due to the ease of application, accuracy in diagnosis, and quantifiability of results, flow cytometry has become the preferred method for lineage assignment [95]. ALL blasts are divided into precursor-B-cell types, mature-B-cell ALL, and T-lineage ALL. The common ALL phenotype is defined principally by reactivity with antibodies against CD10 (CALLA) and CD19 (B4) and confirmed by the near-uniform presence of immunoglobulin gene rearrangements [96, 97]. The T ALL subtypes are distinguished according to the stage of normal thymocyte development. Cytoplasmic CD3 is the most T-lineage-specific marker. CD4 and CD8 are either double positive or double negative. CD2 is negative. The more mature subtypes of T ALL are positive for both sCD3 and cCD3, CD2, and either CD4 or CD8 but not both. ALL blasts coexpress myeloid markers in 15–50% of adults and in 5–35% of children. The most frequently coexpressed myeloid markers are CD13 and CD33.
Imaging for Diagnosis and Staging
Clinical manifestations at presentation include fever, night sweats, weight loss, easy bruising or bleeding, dyspnea, dizziness, and infections (particularly frequent in childhood). Extremity and joint pain may be the first presenting symptom and occurs up to 1/3 of childhood presentation. Less than 10% of patients have symptomatic central nervous system (CNS) involvement, although the frequency is higher in patients with mature B-cell ALL. These patients may present with cranial nerve deficiencies (especially cranial nerves VI, III, IV, and VII), leading to double vision, abnormal ocular movements, facial dysesthesia, and facial droop [98]. Chin numbness due to mental nerve involvement may be subtle. Patients with T-lineage ALL present with a mediastinal mass on chest X-ray. If the mass is sufficiently large, it results in stridor, wheezing, pericardial effusions, and superior vena cava syndrome [90, 99]. Involvement of skin, testicles, kidneys, joints, and bones is uncommon in adults [100, 101]. Approximately 15–25% of ALL patients of all ages have leukemia with a T-cell phenotype which is associated with higher initial WBC counts, mediastinal masses, male gender, and probably a higher incidence of CNS involvement. In children, the frequency of T-lineage ALL increases with age.
Physical examination may reveal pallor, ecchymoses, or petechiae. Lymphadenopathy and hepatosplenomegaly are infrequent and rarely symptomatic. B-cell ALL is a rapidly proliferating tumor. Patients present with signs and symptoms of metabolic hyperactivity, including profound constitutional symptoms, weight loss, and often large abdominal and (especially in children) testicular masses that can lead to obstructive hydronephrosis with renal insufficiency [102]. Involvement of the gastrointestinal tract is frequent and may cause bleeding or rupture.
Morphology and cytochemical stains are essential in the initial workup. The bone marrow is usually hypercellular and replaced with a homogenous population of leukemic blasts. Bone marrow hypocellularity with increased numbers of lymphoblasts or a necrotic bone marrow at presentation is rare [103]. Leukemia is not staged like most other cancers because leukemia involves the marrow of most bones and leukemic cells circulate throughout the bloodstream to all parts of the body.
In patients with atypical presentations or complications, particularly in the presence of bone pain, osteopathy and hypercalcemia, CNS involvement or infectious complications, or to detect extramedullary disease, imaging may be helpful (Pediatric and Congenital Imaging Guidelines Oncology and PET 2010, MedSolutions, Inc.) (Fig. 8.11). In the American Cancer Society of Childhood Leukemia Report (2002), several radiological (X-ray, ultrasound, CT, and MRI) and nuclear medicine (67Ga-citrate and bone scintigraphy) imaging modalities are employed to assess the disease.
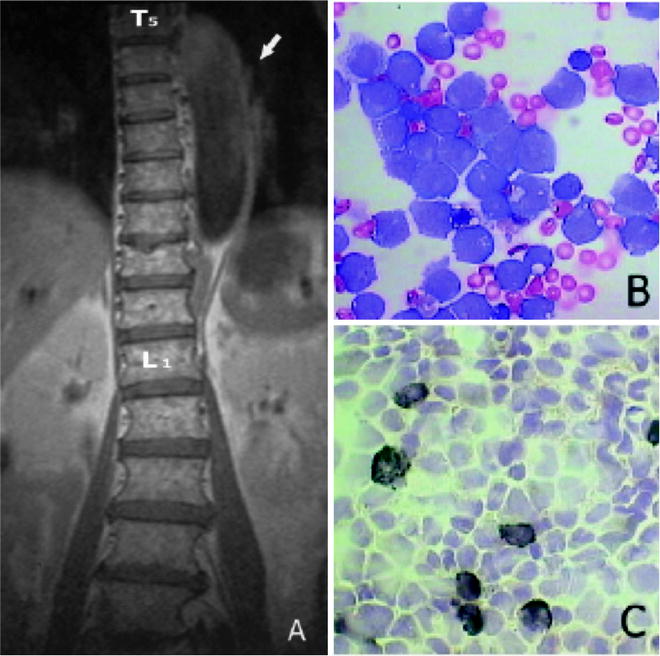
Fig. 8.11
Sagittal T1-weighted MR image (a) showing the spine wrapped by hypointense tissue extending from T5 to T12 (arrow). Cerebral spinal fluid smear showing myeloblasts with a high nucleocytoplasmic ratio, monoblasts with more plentiful cytoplasm, and a folded nucleus with a lacy chromatin pattern (May–Gr¨nwald–Giemsa, original magnification 960, b) Cerebral spinal fluid smear stained with SBB showing few myeloblasts with strong positive granular reaction (black) and monoblasts with weaker or absent granular reaction (original magnification 960, c) (from Potenza L, Isolated extramedullary relapse after autologous bone marrow transplantation for acute myeloid leukemia: case report and review of the literature. Am J Hematol. 2006, 81:45–50, with permission)
Osteopathy, including bone pain and pathologic fracture, is one of the initial symptoms of ALL, with an incidence of ∼20% in childhood ALL [104]. Bone scintigraphy may be helpful to elucidate the etiology of bone pain in children. In fact, pain localized at joints may be the first synthomatic presentation of ALL. The knee is the most frequently affected site, followed by the ankle. Bone scintigraphy is able to demonstrate abnormalities in the majority of leukemic patients with bone lesions occurring even in sites without pain. Focal intense uptake in one or several metaphyses as well as in diaphyses represents the typical scintigraphic findings, and the most common affected sites are metaphysic, diaphysis, epiphysis of long bones, the pelvis, and ribs. Lower limbs are involved more frequently than upper extremities (Fig. 8.12). Diffuse uptake in the pelvis and spine may suggest marrow infiltrative disease [105]. Bone x-ray, may be also used to detect leukemic changes in bone or joint in presence of bone pain [106]. Ultrasound and CT scan are generally used to assess extramedullary involvement in the abdomen, and brain MRI is indicated to assess the CNS abnormalities due to the leukemia itself and/or to treatment.
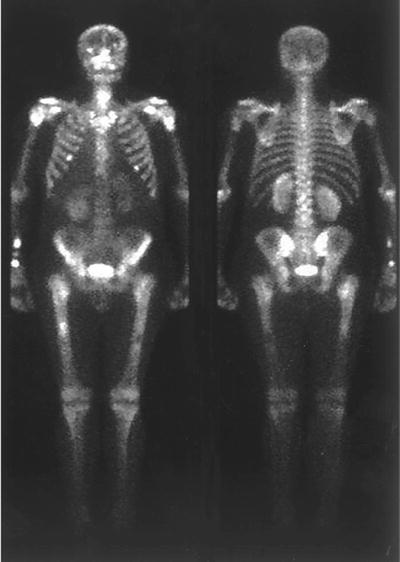
Fig. 8.12
Bone scintigraphy of a 43-year-old men with a ALL showing increased radiopharmaceutical uptake in all long bone diaphysis, as suggestive of bone marrow expansion (from Benítez Velazco A, González García FM, Albalá González MD, Pacheco Capote C, Latre Romero JM. [Bone scintigraphy with 99mTc-MDP in a patient with acute lymphoblastic leukemia initially diagnosed of Still’s disease] Rev Esp Med Nucl. 2005;24:319-21, with permission)
Renal involvement does not necessarily imply a significant organ impairment, because elevated creatinine may occur due to lymphadenopathy compressing renal vessels and/or ureter. Nephromegaly is a common finding in children [107]. Additionally, causes of renal parenchymal abnormalities CT-detectable childhood ALL include infection, lymphoma transformation, nephroblastomatosis, cysts, angiomyolipomas, and metastases. Furthermore, atypical infection with microabscesses in liver, spleen, and kidneys on CT as focal small non-enhancing areas of parenchymal abnormality [108] is often observed in children. In patients with a clinical suspicion of CNS infection and negative cultures, MRI may be helpful in revealing the presence of the disease and in the assessment to response to medical treatment. The early diagnosis of the neurologic complications is essential to insure an effective therapy for treatment-related neurotoxicity, secondary brain tumors, infections, and cerebrovascular disease [109–111]. MRI abnormal enhancement of the meninges and/or nerve roots may result from leptomeningeal or subarachnoid disease/relapse or infection, rarely, both. Other causes of nerve root enhancement on MRI include postsurgical arachnoiditis, mechanical root compression associated with inflammation, cytomegalovirus polyradiculopathy and inflammatory demyelinating polyradiculoneuropathy (Guillain–Barré syndrome), and rarely spontaneous spinal hematomas [110].
Treatment
Vincristine, corticosteroids, anthracyclines, and asparaginase remain the backbone of induction therapy [112]. More recently, higher fractionated doses of cyclophosphamide were added with excellent response rates and overall results similar to that noted with other regimens [113]. Cytarabine, methotrexate, cyclophosphamide, and (less frequently) etoposide, tenoposide, or m-amsacrine are used mainly during early intensification [114]. About 80–90% of adults with ALL should achieve CR with currently available induction therapies. Most patients are in CR by 4 weeks after treatment is begun, although 10–20% of patients require a longer period of therapy to achieve CR. There is no evidence of superiority of any given regimen. In patients older than 60 years of age, problems with supportive care can be limiting, even with the addition of hematopoietic growth factors [115]. Long-term corticosteroid use may be a risk in such patients. Intensification of induction and early consolidation have their greatest impact on remission duration and survival [116, 117]. Postremission therapy includes intensified consolidation and maintenance therapy or HSCT. The “backbone” of such treatment consists of variations of daily oral 6-MP, weekly methotrexate, and intermittent “pulses” of vincristine and prednisone. Long-term disease-free survival rates of this scheme are reported in approximately 30–40% of complete responders [118].
Although less than 5–10% of patients have CNS leukemia at the time of diagnosis, isolated CNS relapse is quite common, and prophylactic treatment of the meninges and brain has become a standard part of the management of children with ALL (intrathecal methotrexate and cranial irradiation or methotrexate, cytarabine, and hydrocortisone) [119]. There is no consensus about the optimal CNS prophylaxis for adults.
No standard approach can be recommended for the treatment of primarily refractory or relapsed ALL. For relapsed patients, the response to further treatment is dependent in part on the duration of the initial CR, whether treatment was being given, and on the type and intensity of this therapy. Conventional treatments mainly mirror variations of drug combinations used in several induction protocols: combinations of vincristine, steroids, and anthracyclines; asparaginase and methotrexate; and high-dose cytarabine. Given the poor results reported in patients with recurrent ALL and the lack of effective agents, several new drugs with different mechanisms of action are being investigated in clinical trials [120]. Among those, nelarabine was able to demonstrate response rates of 33% and 41% that have been achieved in children and adults, respectively [121]. Clofarabine, another new nucleoside analogue, is approved by the FDA for the treatment of pediatric patients with recurrent or refractory ALL who have received at least 2 prior regimens of chemotherapy based on promising results from a phase II trial [122]. Studies of this drug alone and in combination (i.e., with cyclophosphamide) are ongoing in adult ALL.
Allogeneic bone marrow transplantation (BMT) can cure a considerable fraction of patients with ALL in relapse or in second or subsequent remission [123, 124]. ASCT can also be of some benefit in children who have relapsed. To reduce the number of potentially contaminating leukemia cells, incubation with chemotherapeutic agents such as 4-hydroperoxycyclophosphamide or “cocktails” of two or more monoclonal antibodies with reactivity against ALL cells have been used. Although BMT can be recommended for patients who have relapsed, the benefits of transplantation for patients in first remission are controversial [125]. The overall results of both allogeneic and autologous BMT in ALL are inferior to those in comparable patients with AML because of an increased rate of leukemic relapse. A major selection factor is the interval between achieving CR and subsequent transplantation.
Imaging for Evaluation of Treatment Response
The definition of treatment response in ALL does not require any imaging. However, imaging plays an important role for detection, for severity definition, as well as for monitoring treatment complications, including the measurement of bone mineral density.
Imaging has an important role also for detecting complications. Treatment-related CNS complications include white matter lesions, small-vessel calcifications, cerebrovascular disorders, treatment-induced tumors, infections and enlargement of ventricles, and/or widening of sulci (sign of cortical atrophy). The most common imaging manifestation of neurotoxicity due to methotrexate in ALL patients is leukoencephalopathy. It appears as white matter hyperintensities on T2-weighted MRI, and it may be both persistent or transient [126]. Mineralizing microangiopathy is a delayed form of neurotoxicity typically detectable as dystrophic calcifications in the basal ganglia and subcortical white matter.
The detection of iron overload, particularly in myocardium in patients receiving chronic red cell transfusions, is mandatory to prevent ventricular dysfunction. MRI-T2*-weighted images using gradient-echo MRI-T2* allowed the determination of myocardial iron and may be used both for diagnosis and monitoring myocardial iron overload during and after antileukemic treatment with blood transfusions [127].
Chronic Lymphocytic Leukemia
CLL is characterized by a progressive accumulation of monoclonal B lymphocytes. CLL is part of a spectrum of diseases grouped as low-grade lymphoproliferative disorders. CLL is the most common form of all leukemias among adult populations of the western world. Since this disease is characterized by relatively longer survival rate, its prevalence rate is the highest among all leukemias. Analysis of the Surveillance, Epidemiology, and End Results (SEER) [122] database reports the USA incidence as 3–5 per 100,000 per year, constituting about 30.6% of all leukemias with a male to female ratio of 1.7:1. CLL is rare in people younger than 50 years, but after this age, a fairly rapid rise in incidence takes place. The incidence increases rapidly with age after 55 years. Age-specific data for 1987–1991 show in the age groups 65–69 an incidence of 12.8/year/100,000 and 22.0 for age group 75–79 years [128]. The incidence is nearly the same in Caucasian and African-American population [129]. Asian countries have a low incidence of the disease with estimated frequency of only 10% of western world countries [130]. Genetic, rather than environmental, factors are the most likely explanation for these geographic and ethnic differences in incidence because it has been observed that Japanese who settled in Hawaii do not present higher incidence of CLL than native Japanese [131]. First-degree relatives of patients with CLL are three times more likely to develop the disease or another lymphoid neoplasm compared to the general population [132]. There are no clearly identified etiologic factors known for CLL.
CLL results from an acquired mutation to the DNA of a single marrow cell that develops into a lymphocyte. In 95% of cases, the change occurs in a B lymphocyte; in the other 5%, the cell that transforms from normal to leukemic has the features of a T lymphocyte or an NK cell.
Clinical diagnosis of CLL is defined by absolute lymphocytosis of at least 5 × 10⁹/L mature-appearing lymphocytes with appropriate immunophenotype [133]. These characteristics distinguish CLL from mantle-cell lymphoma and splenic marginal-zone lymphoma, the diseases that most frequently mimic CLL [134]. In a few individuals, tumor is confined to lymph nodes or other tissues without blood or bone marrow involvement, named small lymphocytic lymphoma (SLL). CLL and SLL have both histological findings and immunophenotype and same management [135]. Individuals without involvement of lymph nodes or other tissues, who have a population of small lymphocytes immunophenotypically similar to CLL cells in blood or bone marrow below the threshold necessary for diagnosis of chronic lymphocytic leukemia, are designated as having monoclonal B-cell lymphocytosis [136]. Despite the ready availability of tumor cells in CLL up to now very little has been known about the pathophysiology of the disease. CLL is characterized by the presence of clonal B lymphocytes arrested in the B-cell differentiation pathway at some intermediate stage between pre-B cell and mature B cell. Morphologically, B-CLL cells resemble mature lymphocytes in the normal peripheral blood. CLL is characterized by a common gene expression signature that differs from other lymphoid cancers and normal lymphoid subpopulations [137]. However, despite sharing a common signature, CLL expressing mutated and unmutated IGHV genes differentially express more than 100 genes; genes encoding ZAP70, lipoprotein lipase, BCL7A, dystrophin, and gravin are noted in individuals with aggressive unmutated disease [138].
CLL lymphocytes express very low amounts of surface immunoglobulins (sIg), usually IgM or IgM and IgD, either kappa or lambda light chain. Low expression of the B-cell receptor, a multimeric complex formed by the assembly of a surface immunoglobulin homodimer and a non-covalently bound heterodimer Igα/Igβ (CD79A/CD79B), is the hallmark of lymphocytes in CLL [139]. Poor expression of the CD22 molecule in B-cell was also shown in CLL patients, resulting from a folding defect arising in CD79A [140]. CLL cells always express pan-B immunophenotypic markers, such as CD19 and CD20. Most B-cell CLL cells express CD5 and IgM/IgD maintaining the mantle zone-like phenotype of naive cells that, in normal conditions, express unmutated immunoglobulin genes [141]. However, 50–70% of cases of CLL have somatic mutations of IGHV genes [142]. Differently from other B-cell malignant diseases, which typically exhibit balanced chromosomal translocations, in CLL, the most frequent abnormalities are mutations, deletions, or trisomies. The most frequent alterations are a deletion on chromosome 13q, trisomy 12, and a deletion on chromosome 11q. A deletion on chromosome 17p, affecting the TP53 protein, is seen less frequently. Patients with mutated and unmutated CLL differ clearly in terms of prognosis [143].
CLL is the paradigm of malignancies involving inhibition of the normal apoptotic process [144]. Accumulation of mature B cells that have escaped programmed cell death and undergone cell-cycle arrest in the G0/G1 phase is the hallmark of CLL [145]. These cells have a low proliferative activity, and data lend support to the hypothesis that in vivo defective apoptosis accounts for accumulation of B cells.
CLL is generally considered an indolent disease associated with a prolonged chronic course and that the eventual cause of death may be unrelated to CLL. This observation may be considered correct for less than 30% of patients. In fact, the natural history is highly heterogeneous: some patients may die within 2 to 3 years from the diagnosis mainly because of complications or causes directly related to CLL. The majority of cases present an initial course of the disease relatively benign (5–10 years) followed by a terminal phase lasting 1–2 years with considerable morbidity, both from the disease itself and from complications of therapy. The most frequent causes of death are severe systemic infections (especially pneumonia and septicemia), bleeding, and inanition with cachexia. In about 3% of CLL patients, a diffuse large-cell immunoblastic lymphoma supervenes terminally (Richter’s transformation), associated with a rapidly progressive course, refractoriness to all chemotherapy, and death within 6 months [146]. Another possible terminal event is the morphologic transformation of blood lymphocytes from the typical small, mature-appearing cell larger cells with distinct nucleoli and less dense chromatin in the nucleus, called prolymphocytoid transformation. Acute leukemia is observed extremely rarely as a terminal event in CLL, independently by treatment with alkylating agents, and when it does occur, it is myeloid in origin (myelocytic, myelomonocytic, or acute erythroleukemia). There is no widely accepted effective therapy for these terminal transformations in CLL. Patients with CLL are considered to be at a somewhat higher risk than the general population of developing another cancer, usually of lung or gastrointestinal tract. Skin cancers occur with considerably greater frequency among CLL patients than among the general population, but these do not result in higher mortality. Several systems of clinical staging have been proposed by investigators around the world, but just the Rai system [147] and the Binet system [148] (Table 8.7), are in wide use in clinical practice as well as in research.
The Rai staging system is based on the concept that in CLL, there is a gradual and progressive increase in the body burden of leukemic lymphocytes, resulting in sequential clinical manifestations of the disease starting in the blood and bone marrow, then in the lymph nodes, spleen, and liver, and eventually in evidence of a significant degree of compromised bone marrow function. The earliest stage (stage 0) is characterized by no stigmata of disease other than the minimum diagnostic requirements of CLL. About 20–25% of patients at the time of initial diagnosis of CLL are in the earliest clinical stage (stage 0, median survival times from the time of diagnosis = 150 months), about 25% are in the advanced stages (stages III and IV, median survival times = 19 months), and the remaining 50% are in stage I or II, median survival times = 101 and 71 months, respectively). In 1987, however, the system was simplified to consist of three groups: low (Rai stage 0), intermediate (Rai stages I and II combined), and high (Rai stages III and IV combined) [149]. Binet’s method [149] classifies all patients with anemia (defined as hemoglobin below 100 g/L) and/or thrombocytopenia (platelets less than 100 × 109/L) as stage C. All of the remaining patients are divided into two groups. This staging takes into consideration five areas: cervical, axillary, and inguinal lymph nodes (whether unilateral or bilateral, each area is counted as one) and the spleen and liver. This system has been found to be of great value in dividing patients into three types of survival curves, A, B, and C, corresponding, respectively, to Rai low-, intermediate-, and high-risk groups. The IWCLL recommended that, in practice, an integrated system using both methods should be used [150]. According to this recommendation, each Binet stage is to be further identified by the appropriate Rai stage (i.e., A-0, A-I, A-II, B-I, B-II, C-III, C-IV). However, this integrated system has not been widely accepted, and most clinicians today use either the Rai or Binet method for patient management and therapeutic investigation.
Both the Rai or Binet staging systems rely solely on a physical examination and standard laboratory tests, whereas the role of various imaging procedures (ultrasound, computed tomographic scan, or MRI) has not been validated for staging of CCL. The Binet method may require some modification in the future, since CT has become a routine part of initial investigations and may reveal enlargement of retroperitoneal or mediastinal nodes that are currently not included among the five sites of palpably enlarged lymphoid areas.
Related posts:
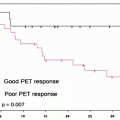
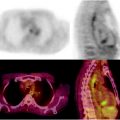
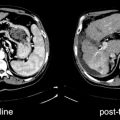
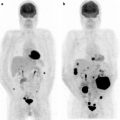
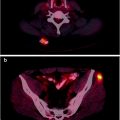
Stay updated, free articles. Join our Telegram channel

Full access? Get Clinical Tree


