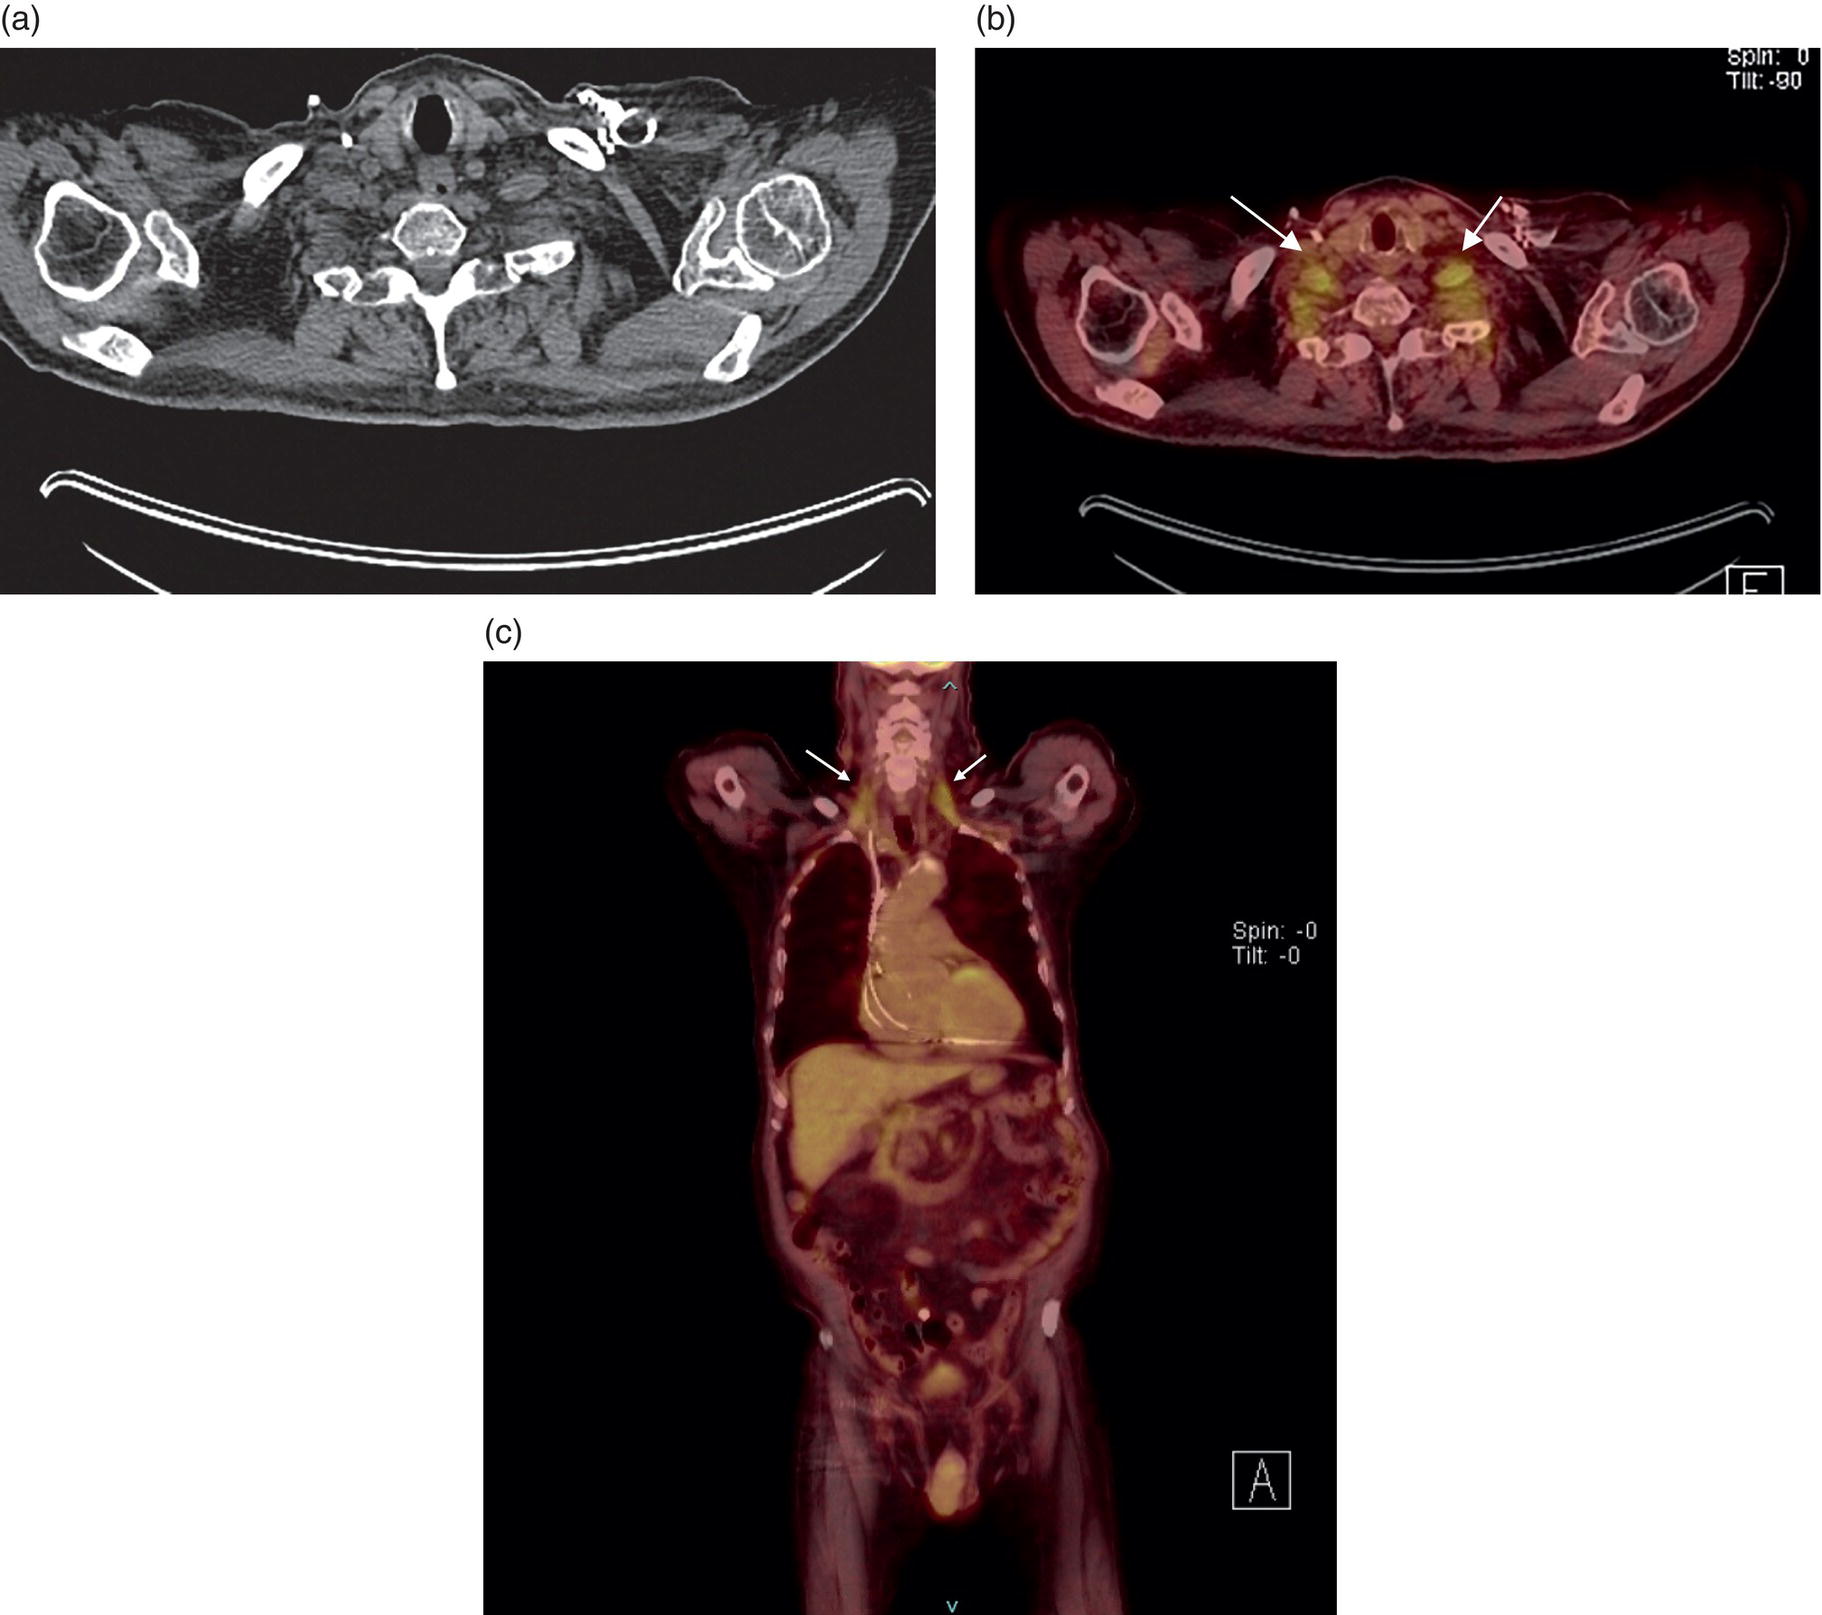
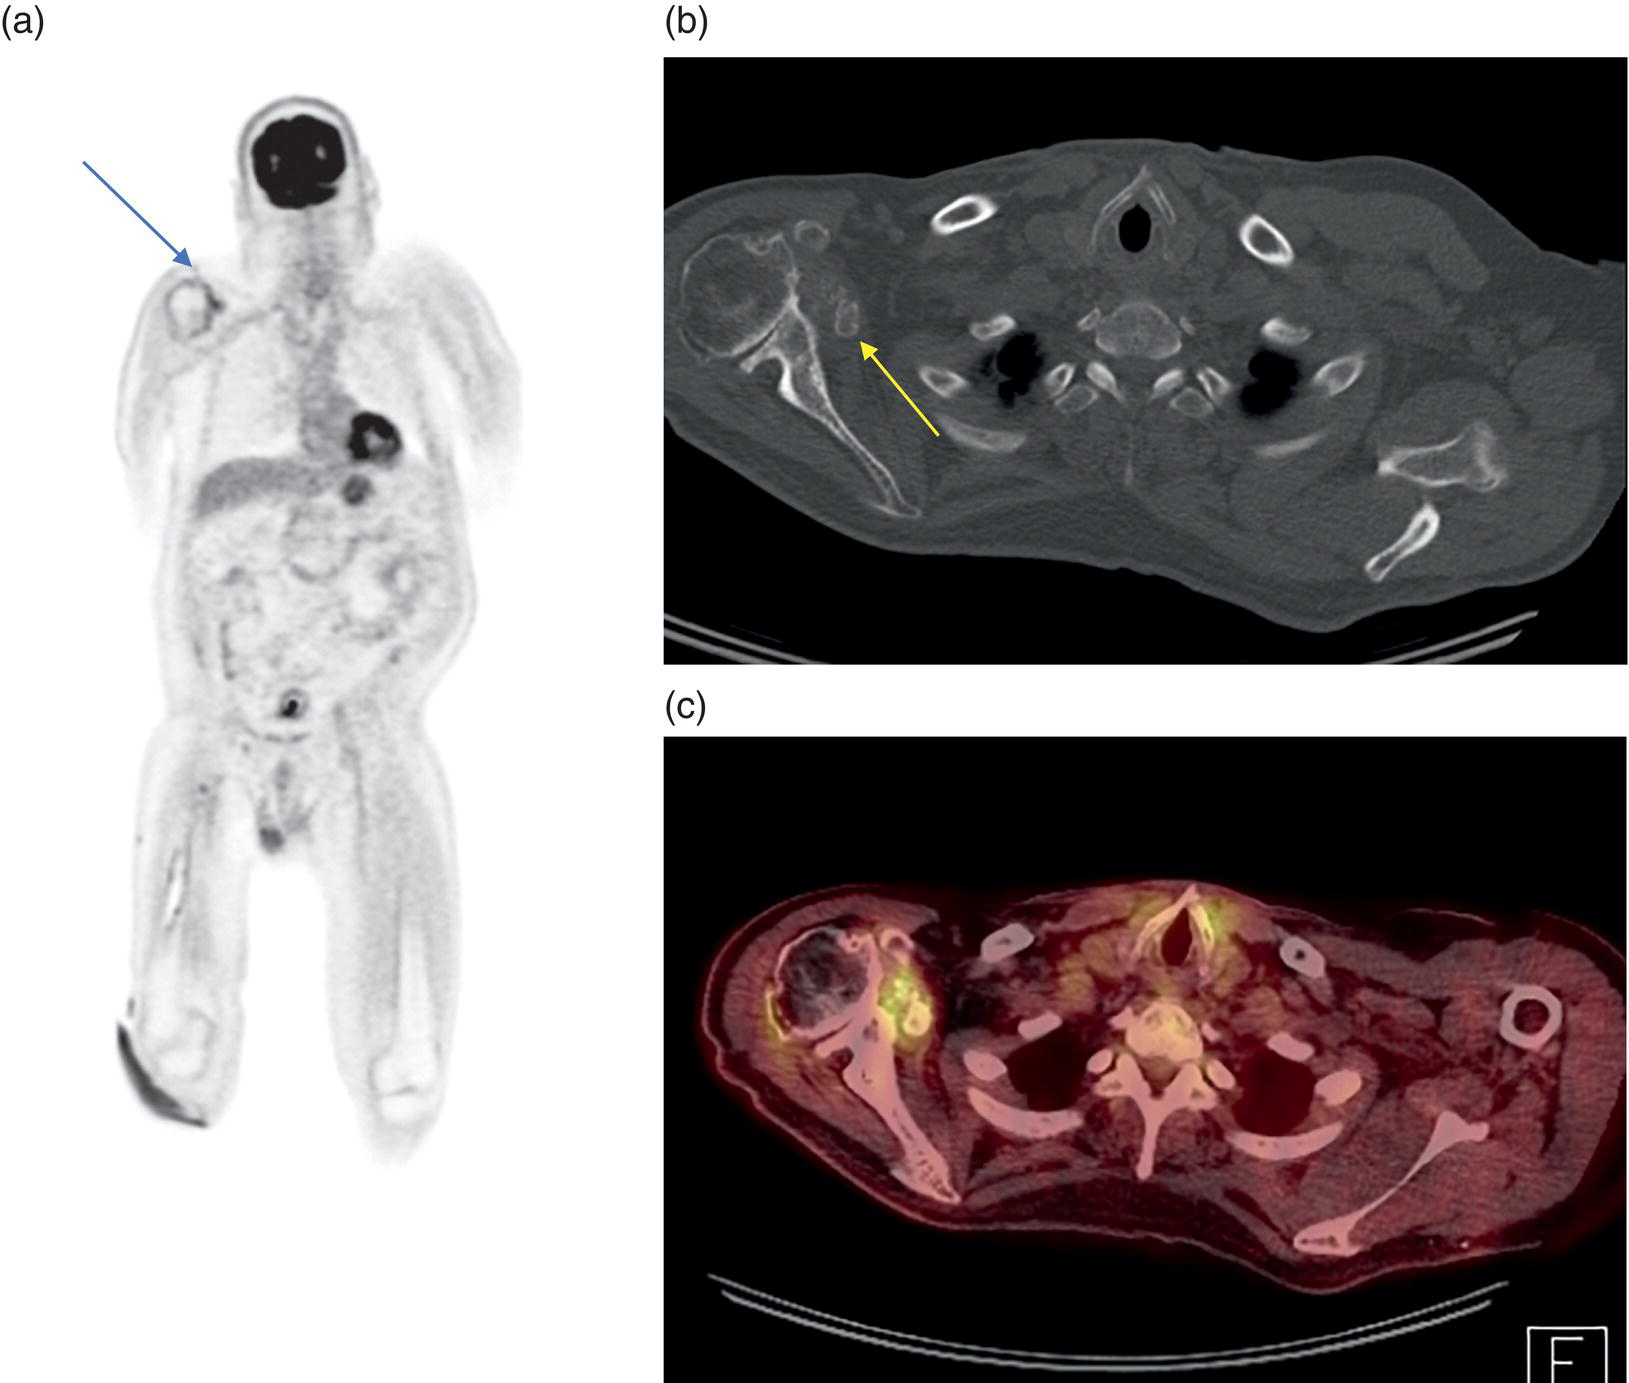
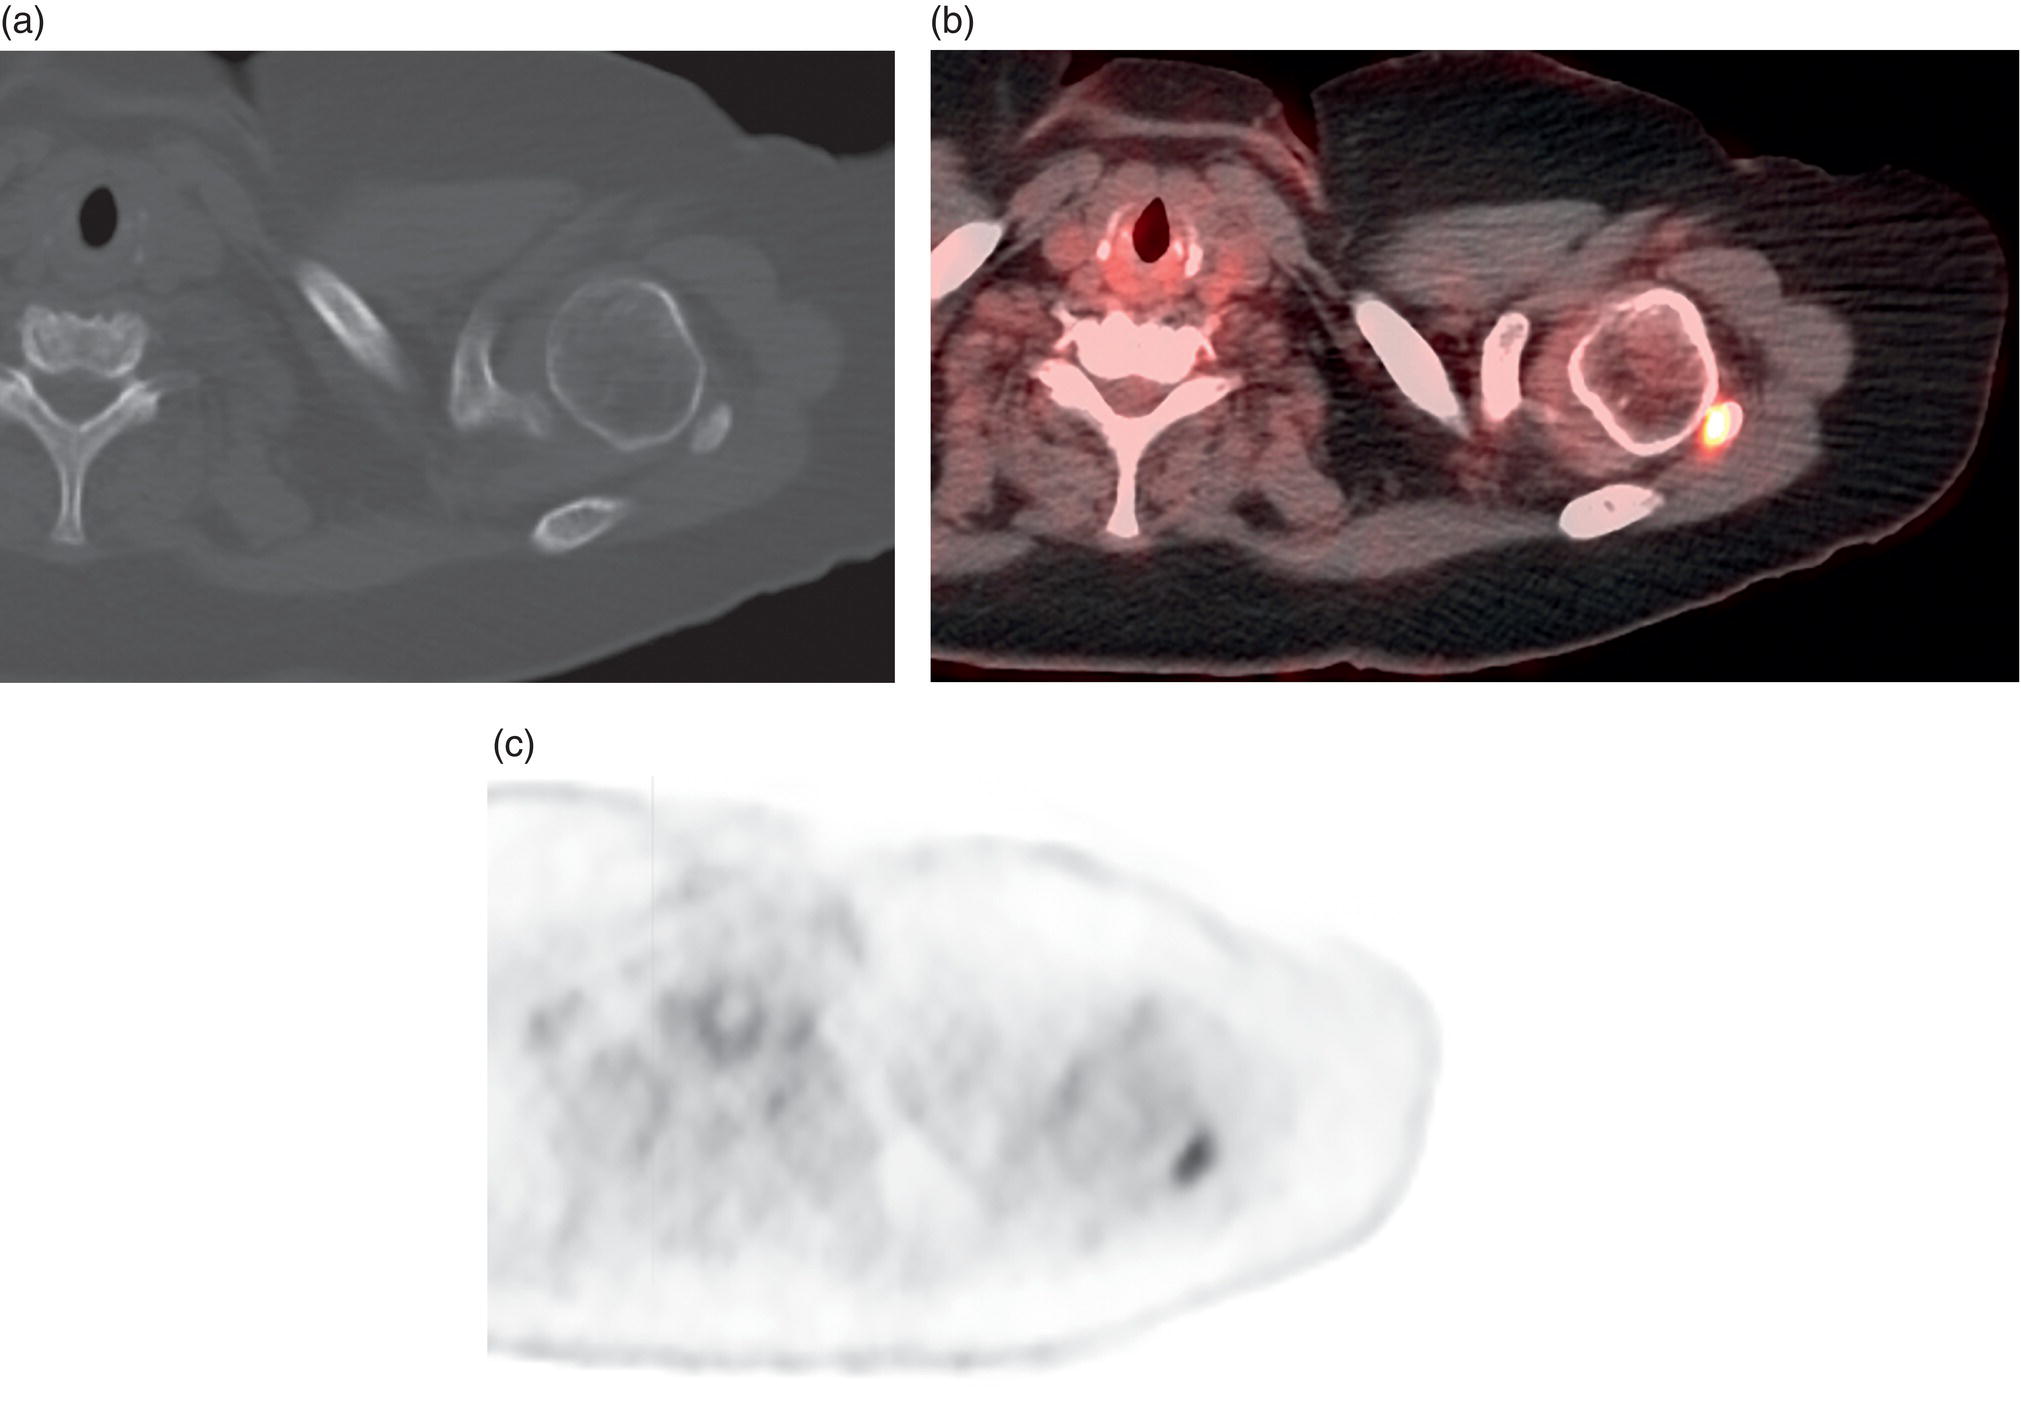
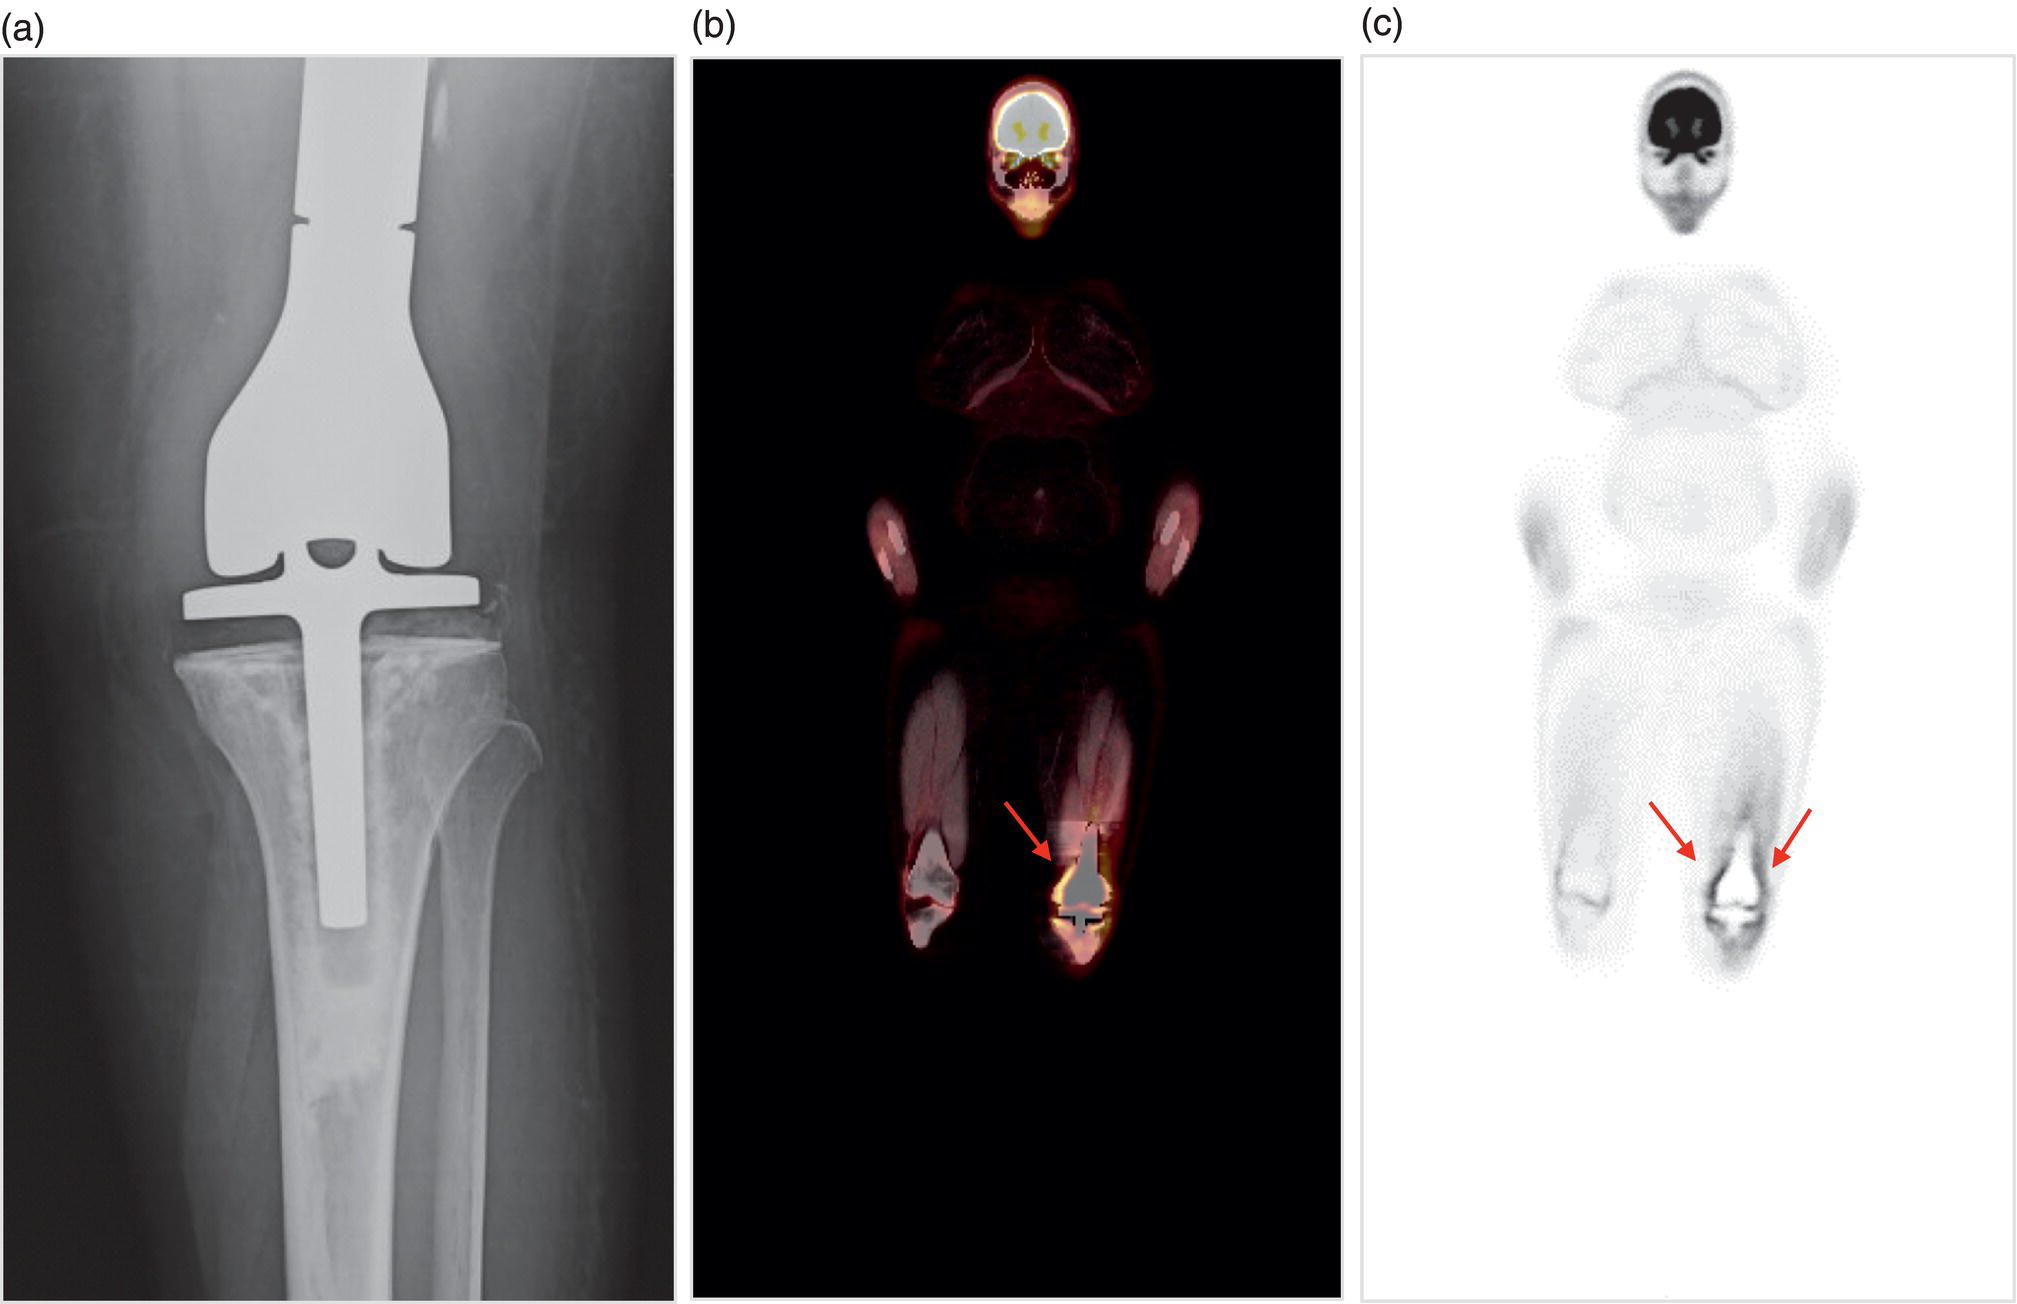
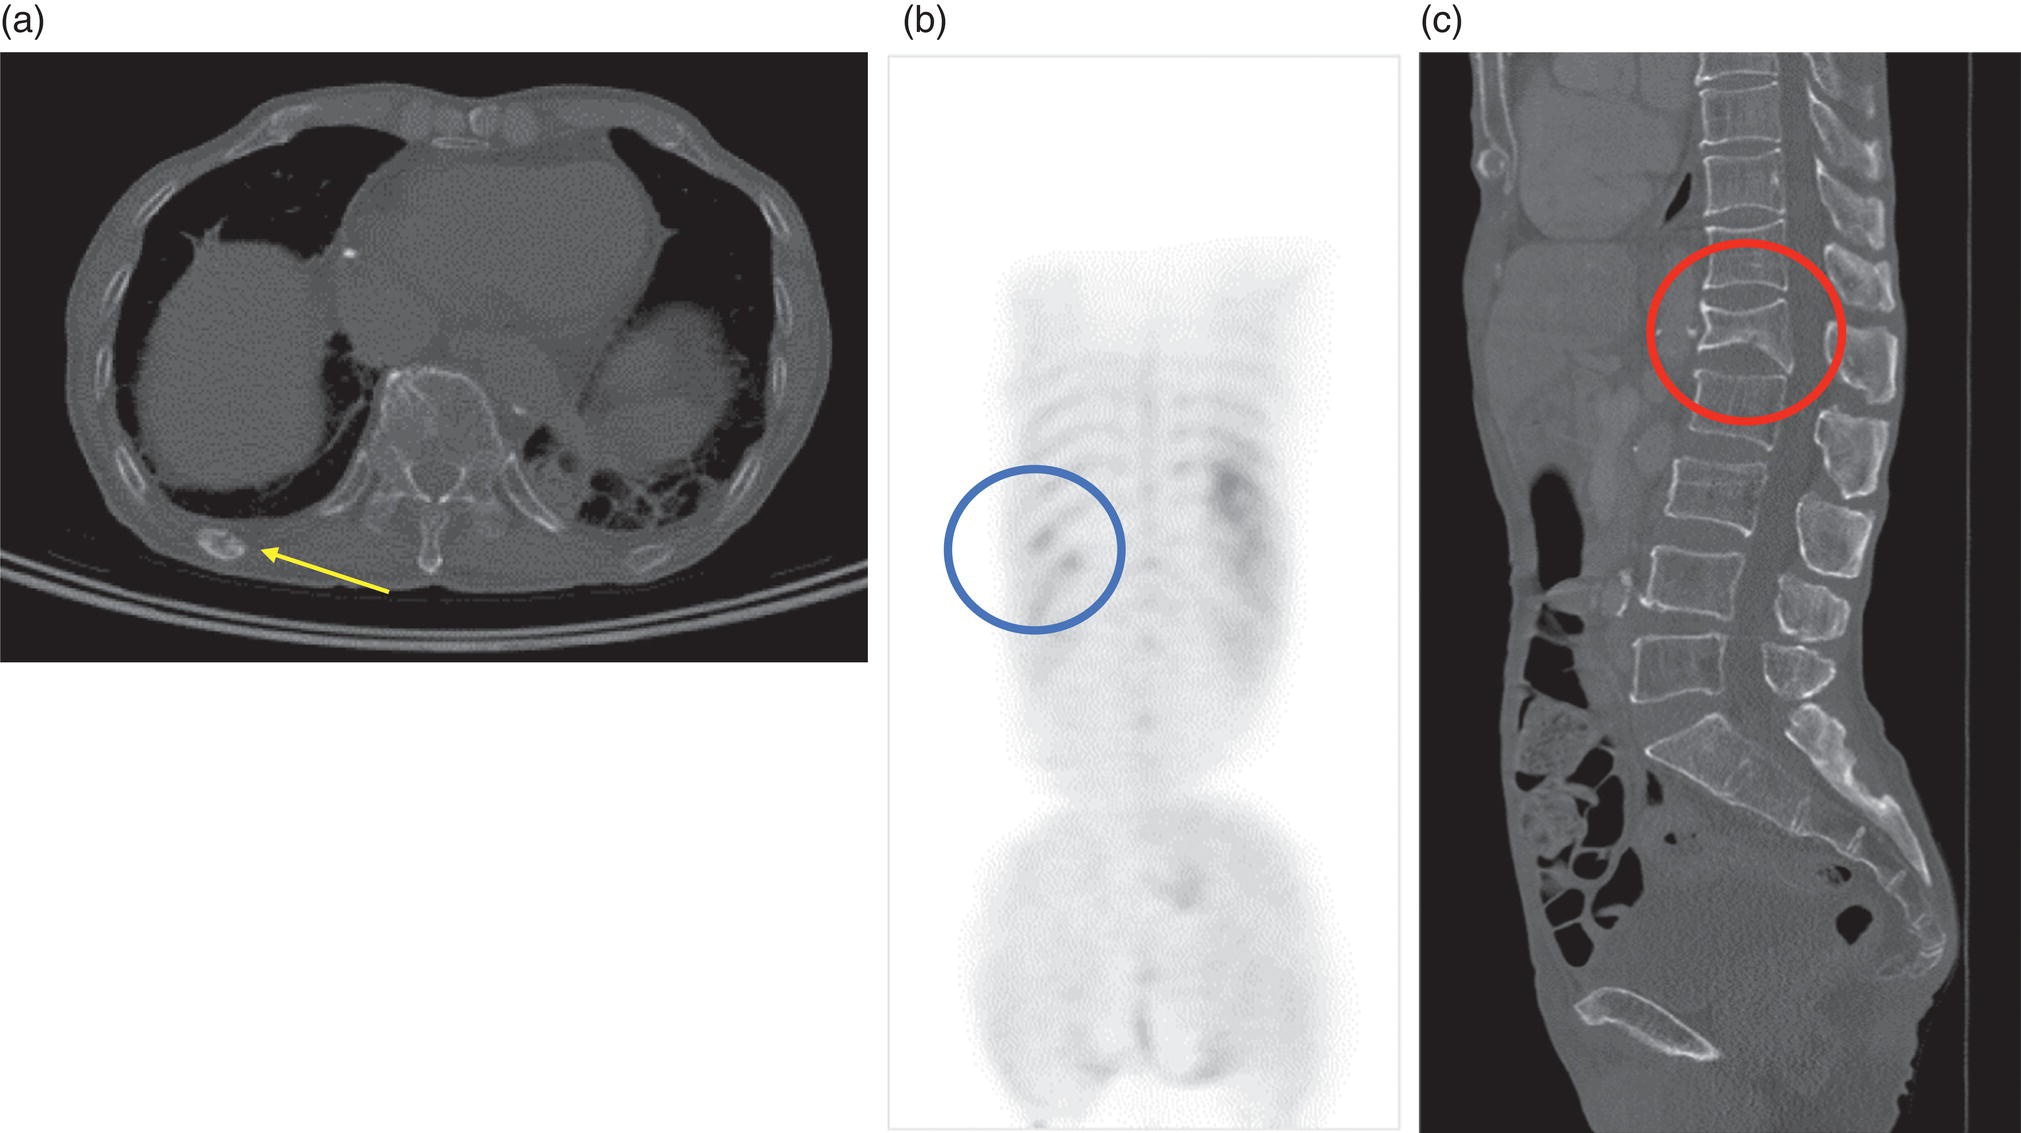
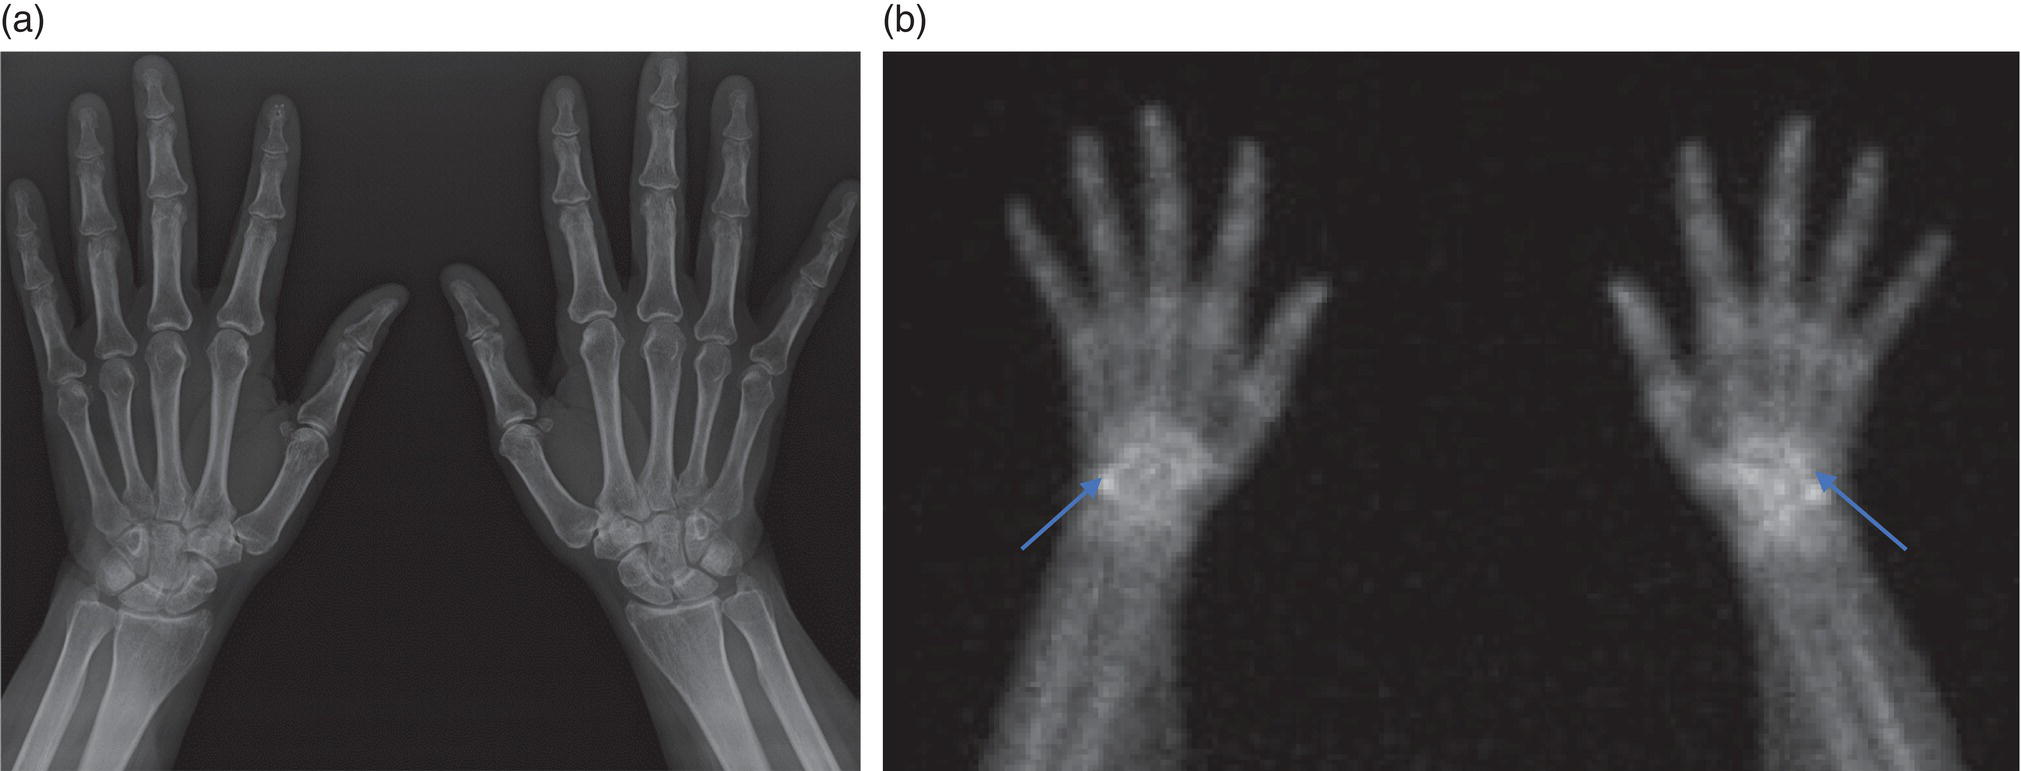
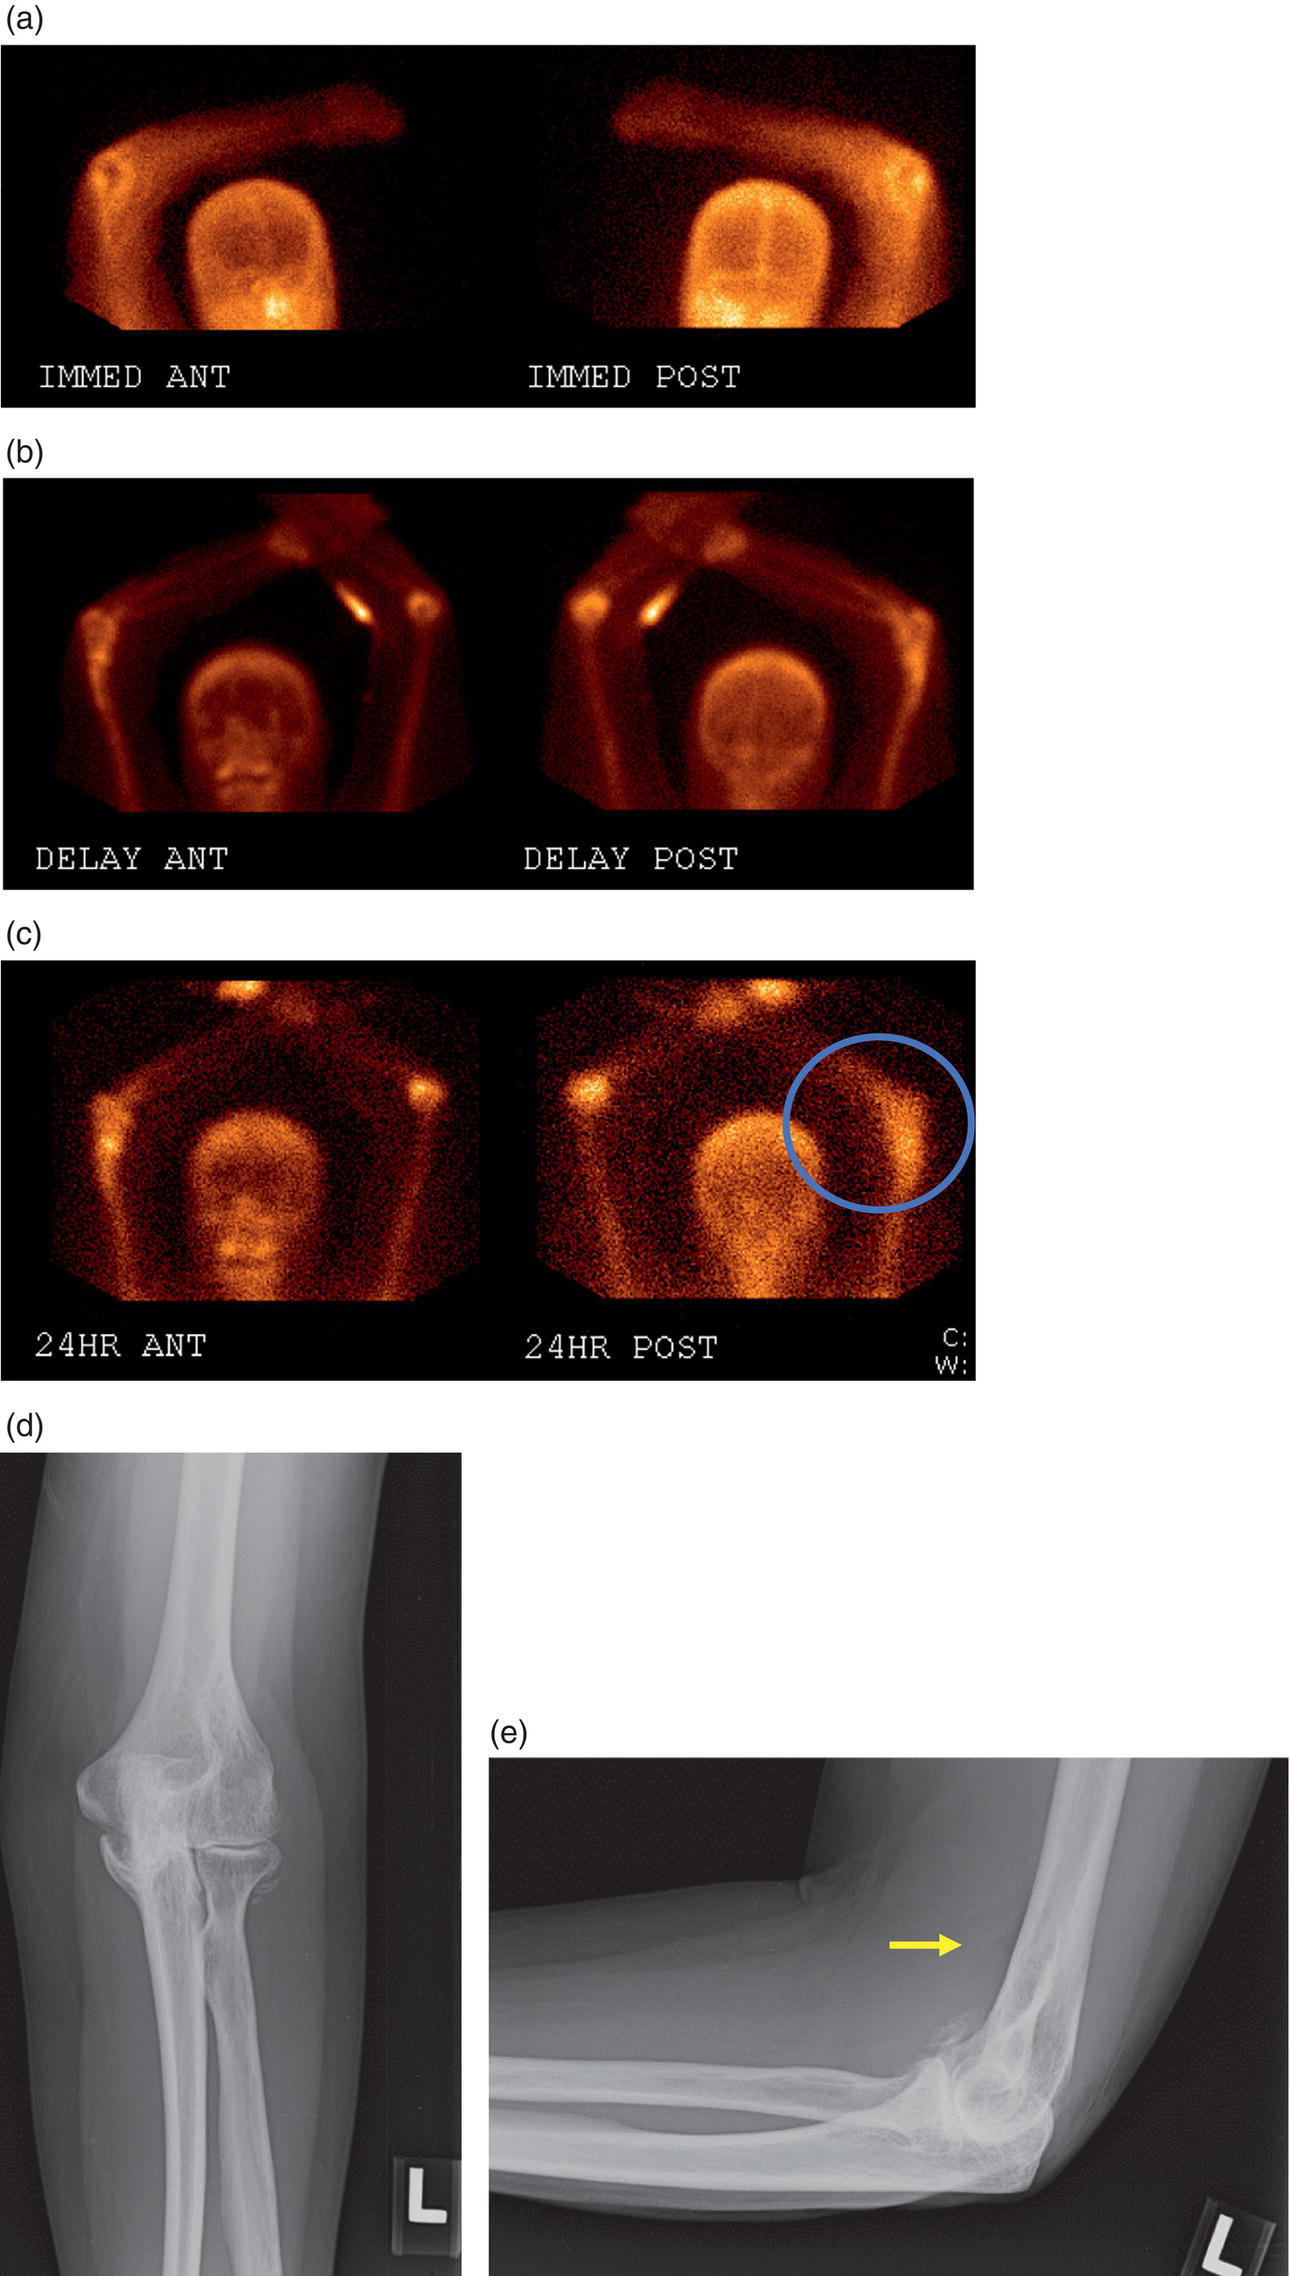
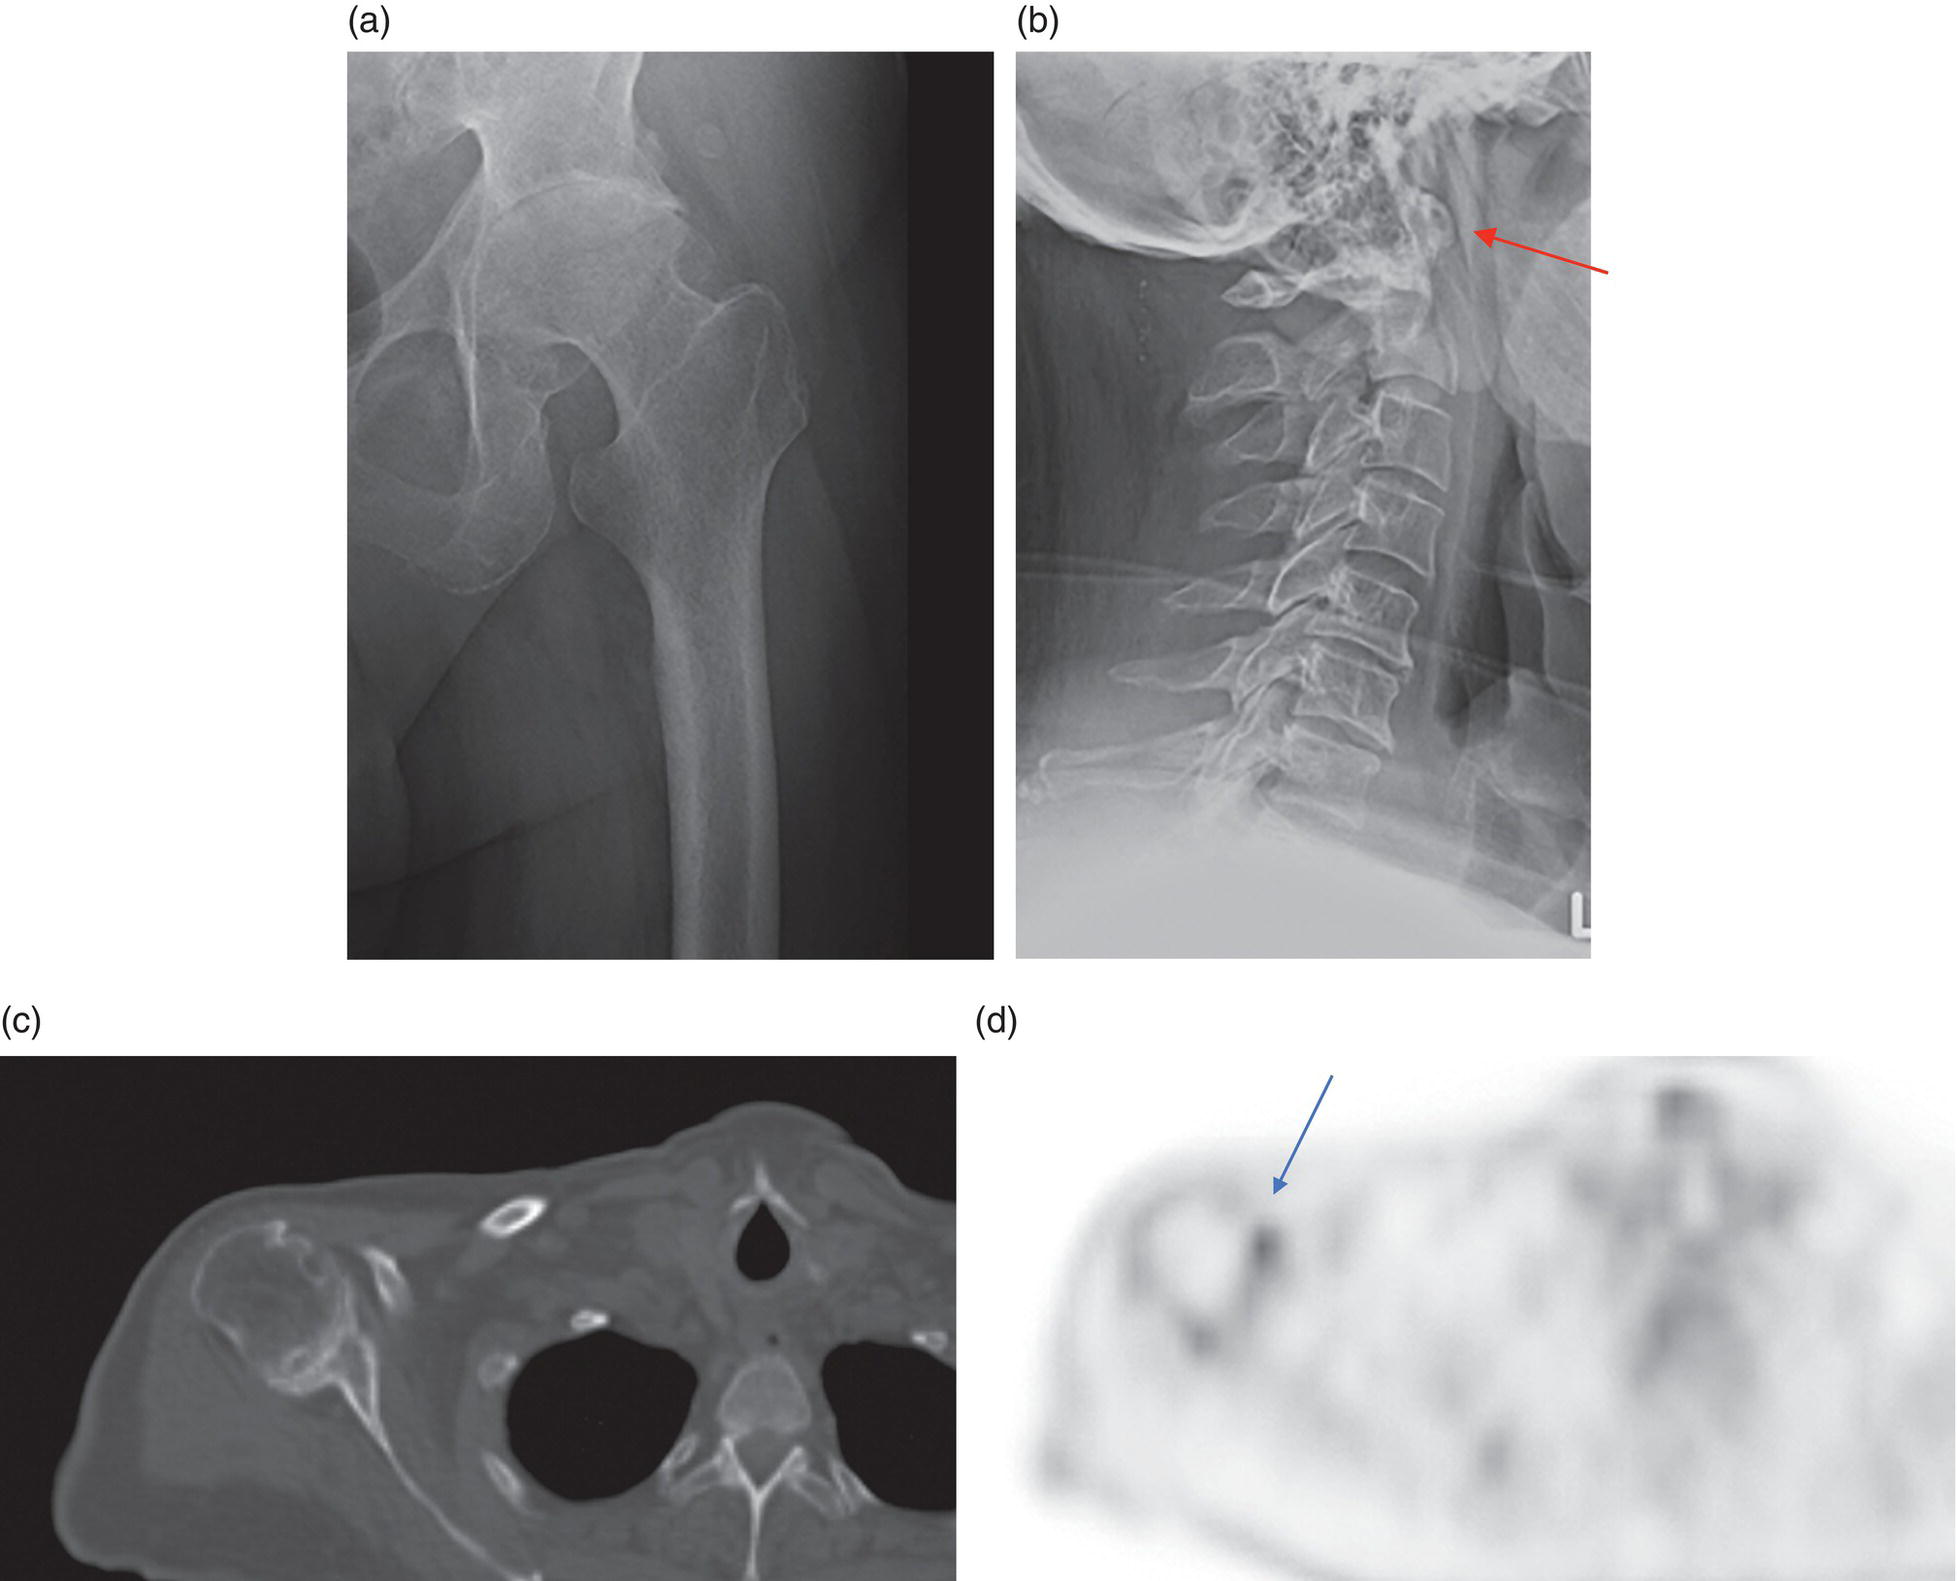
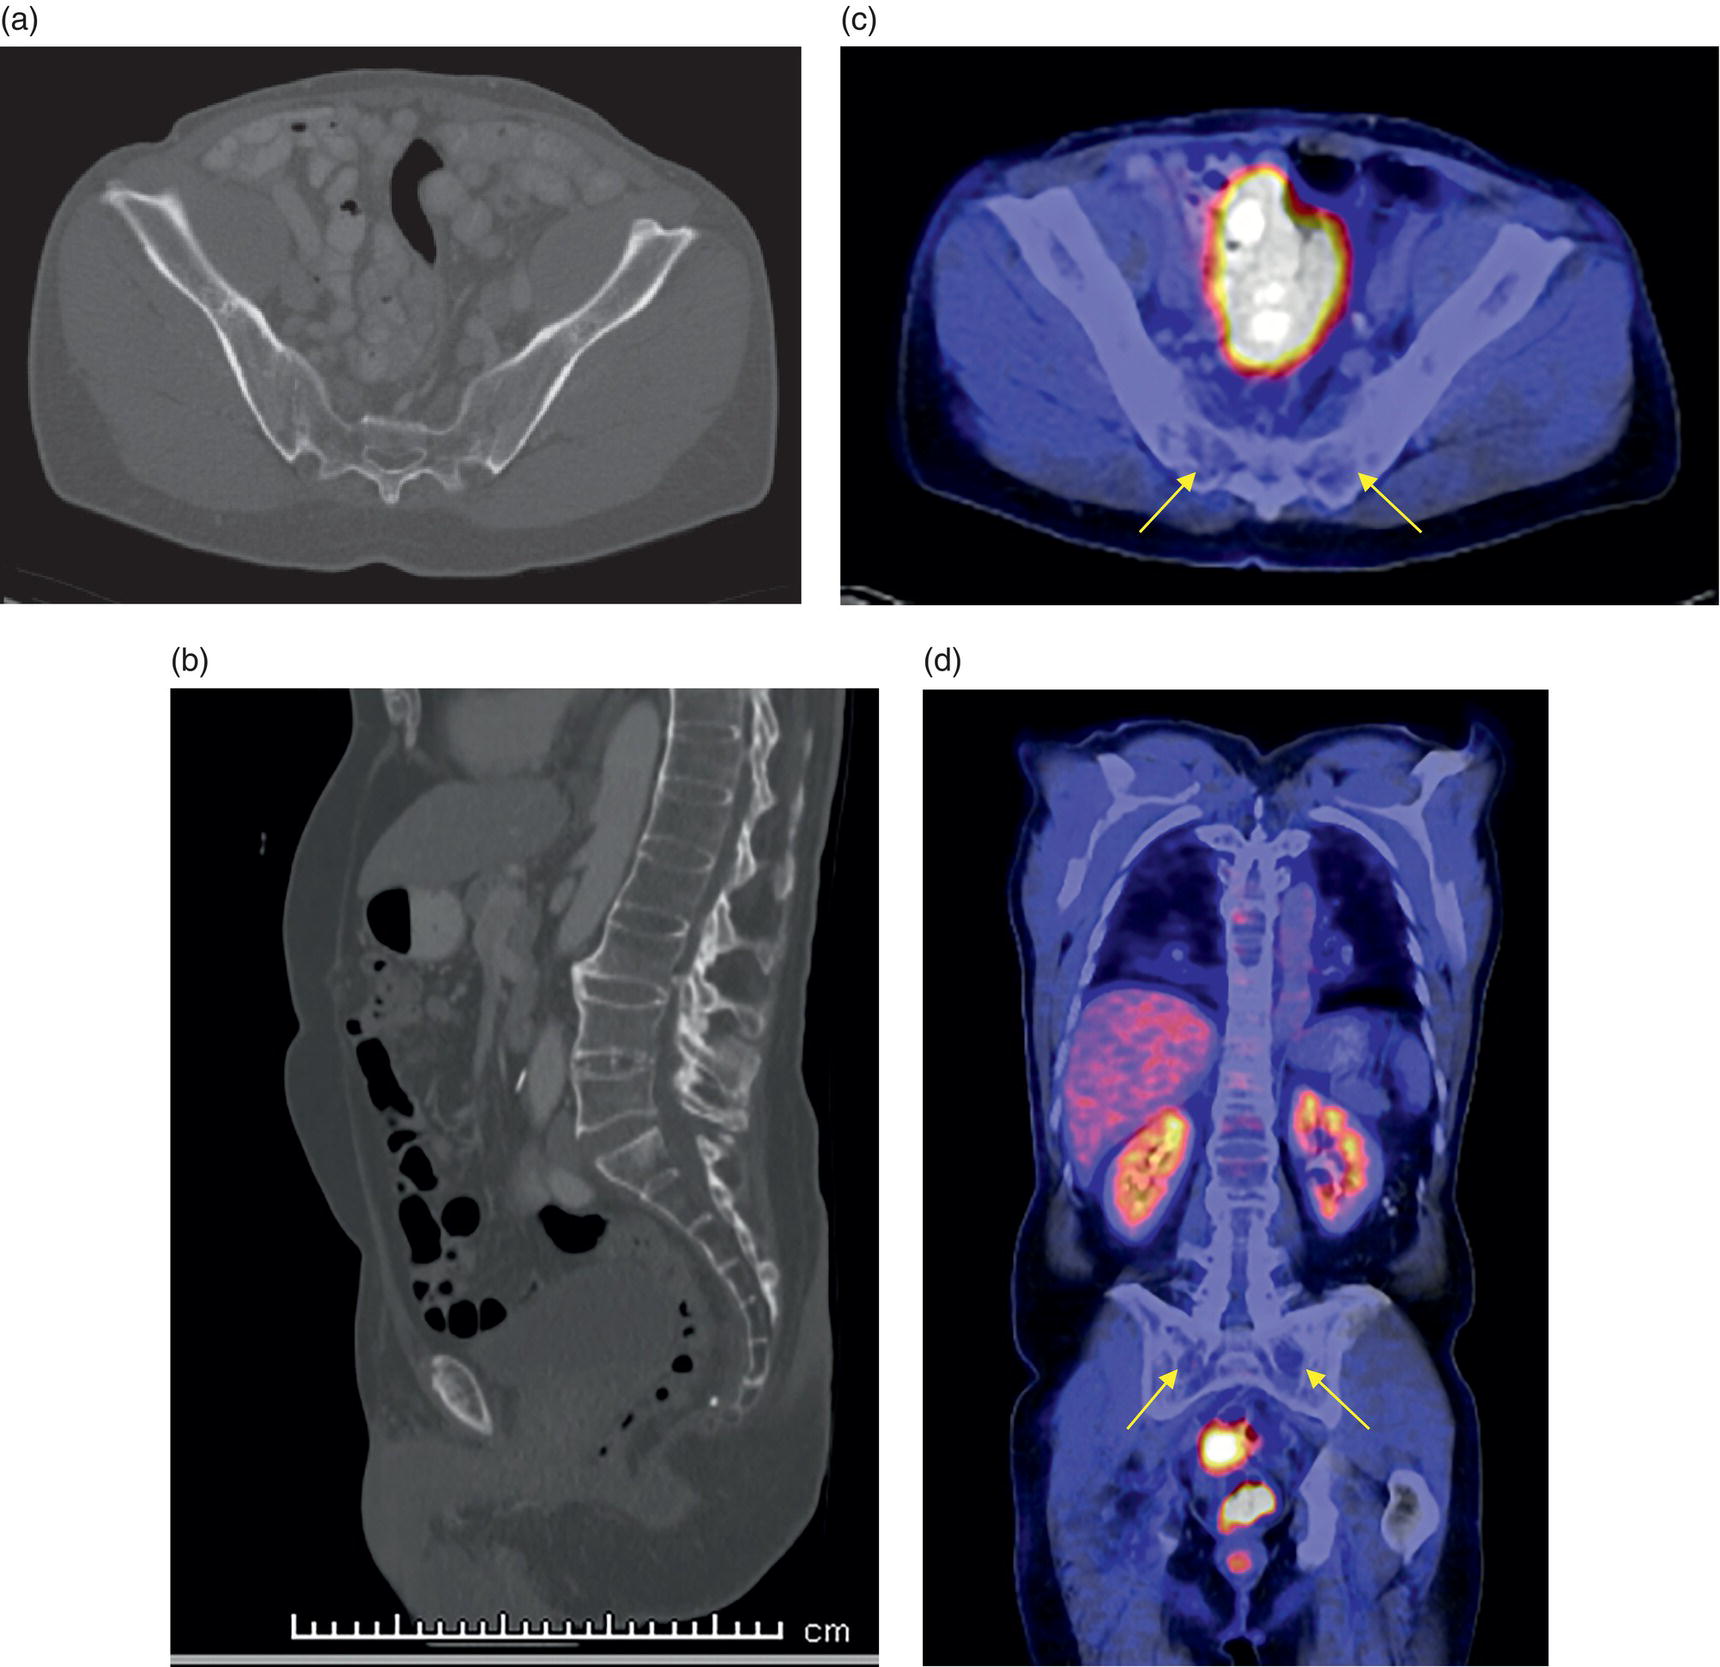
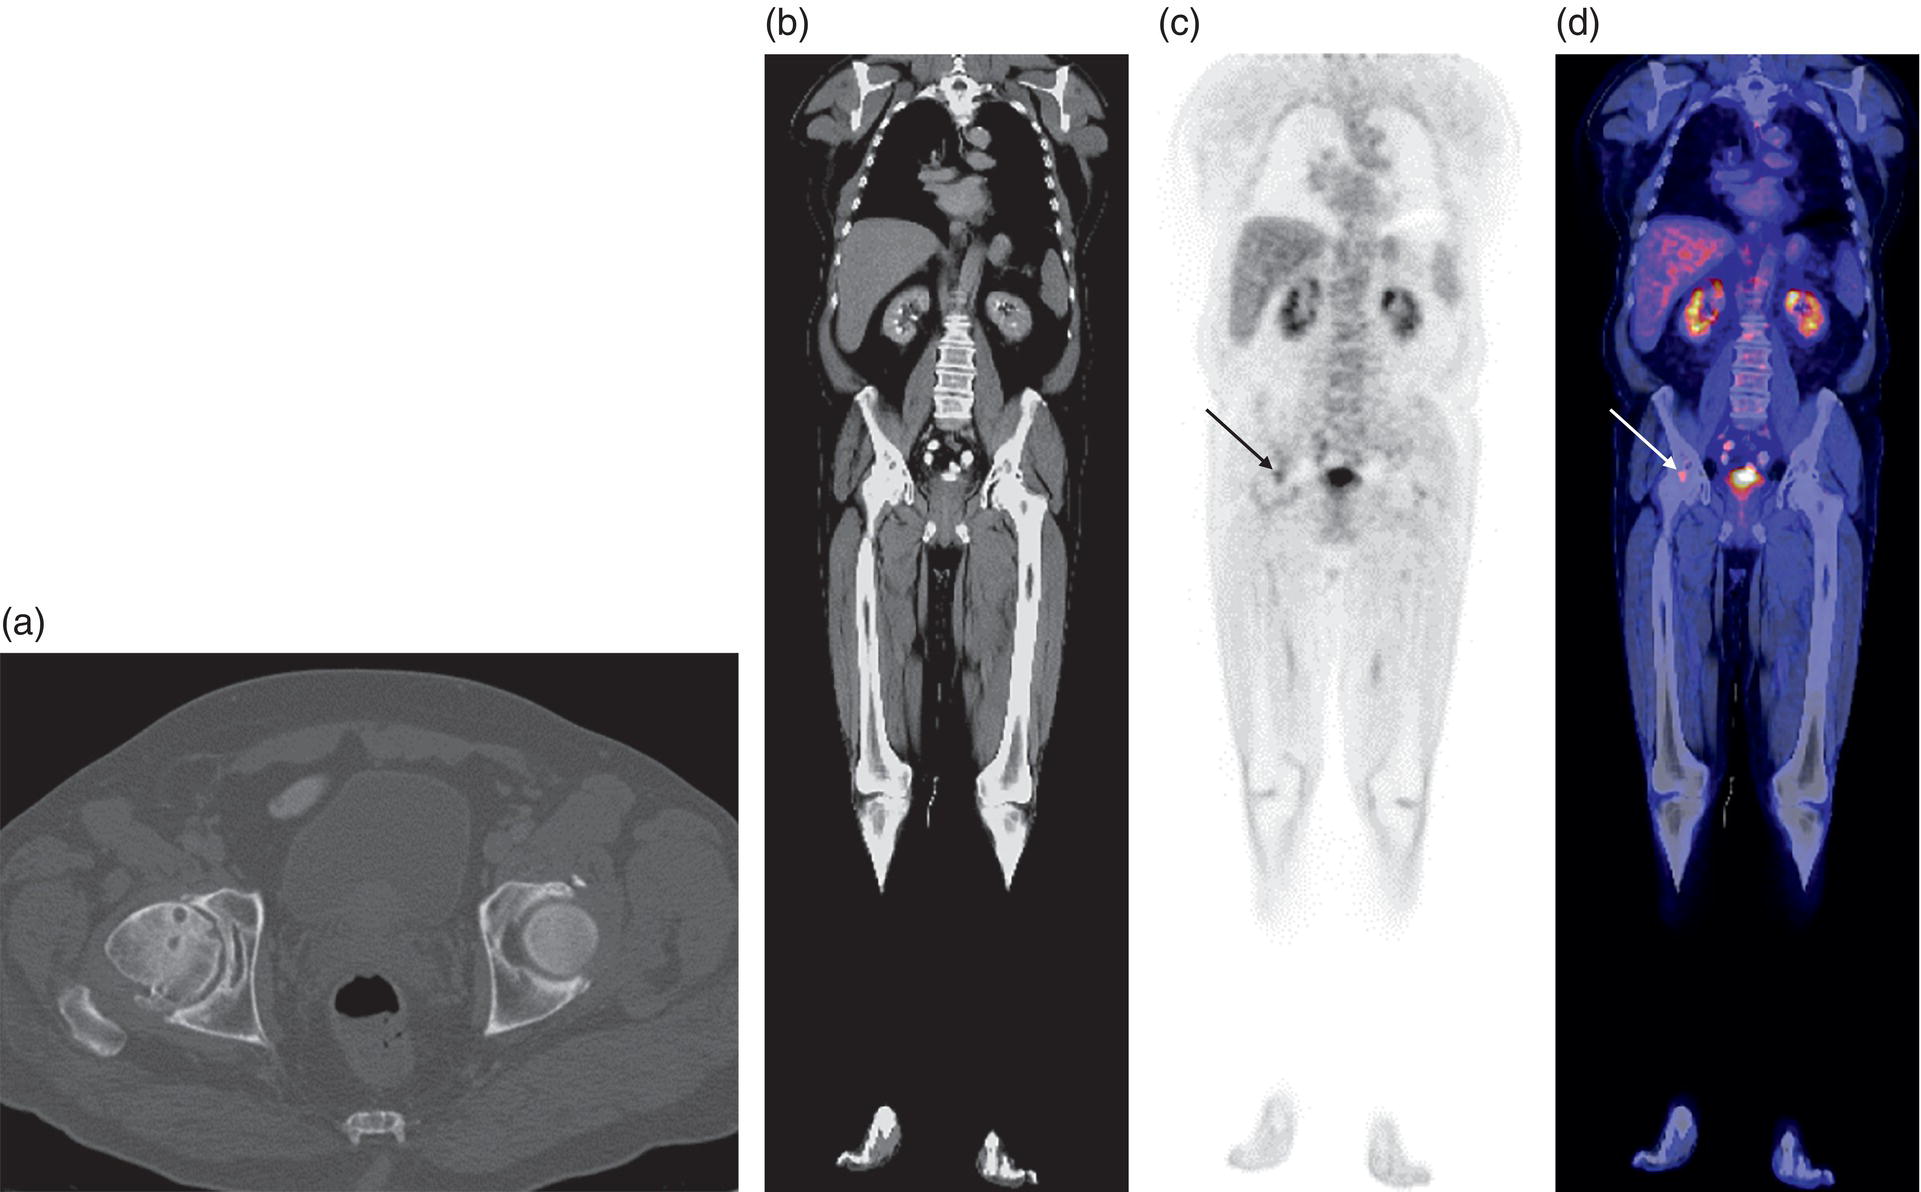
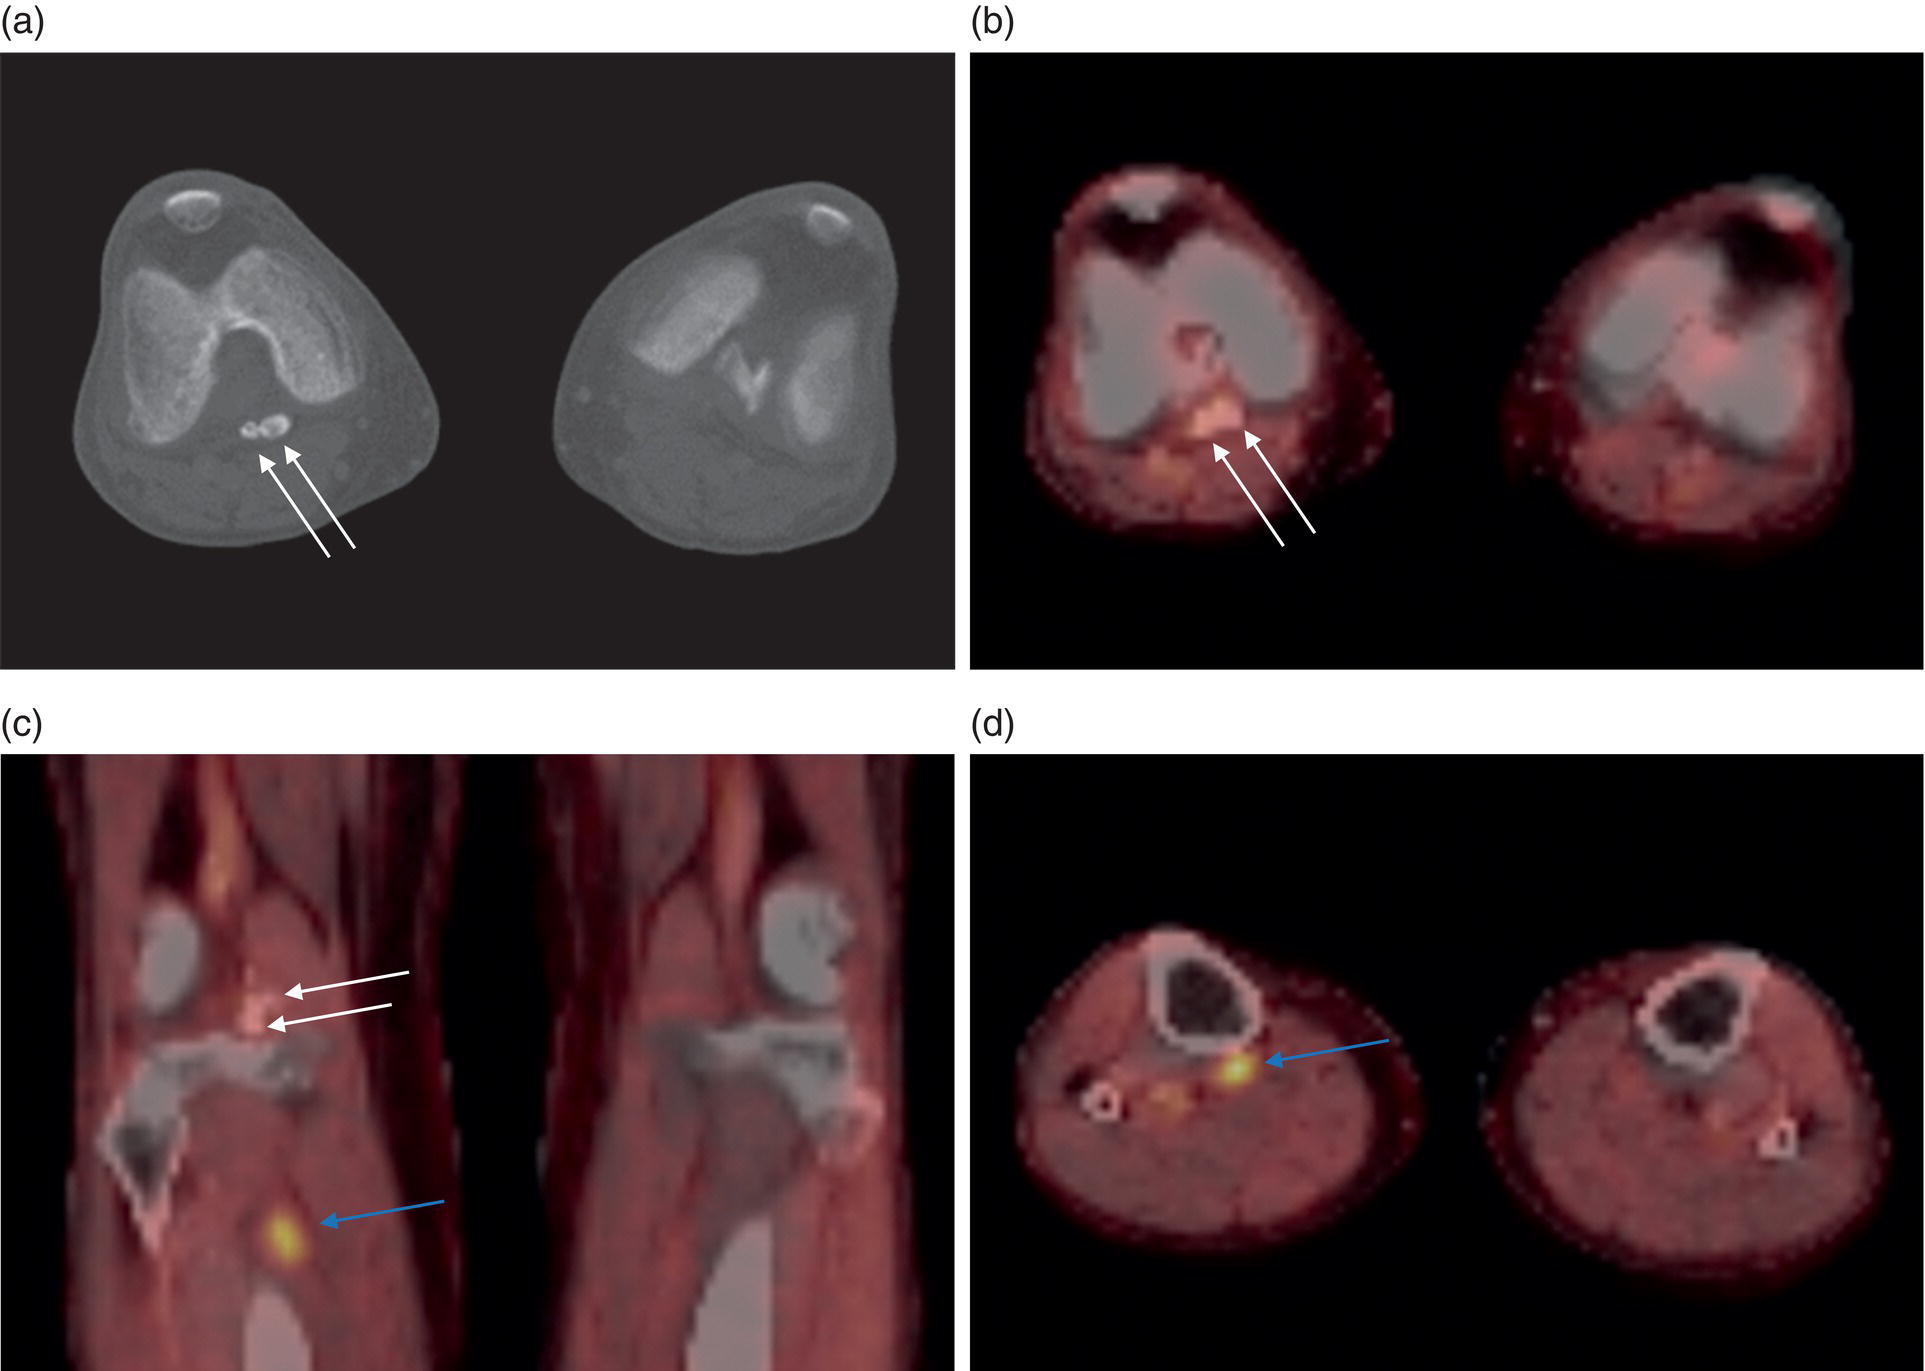
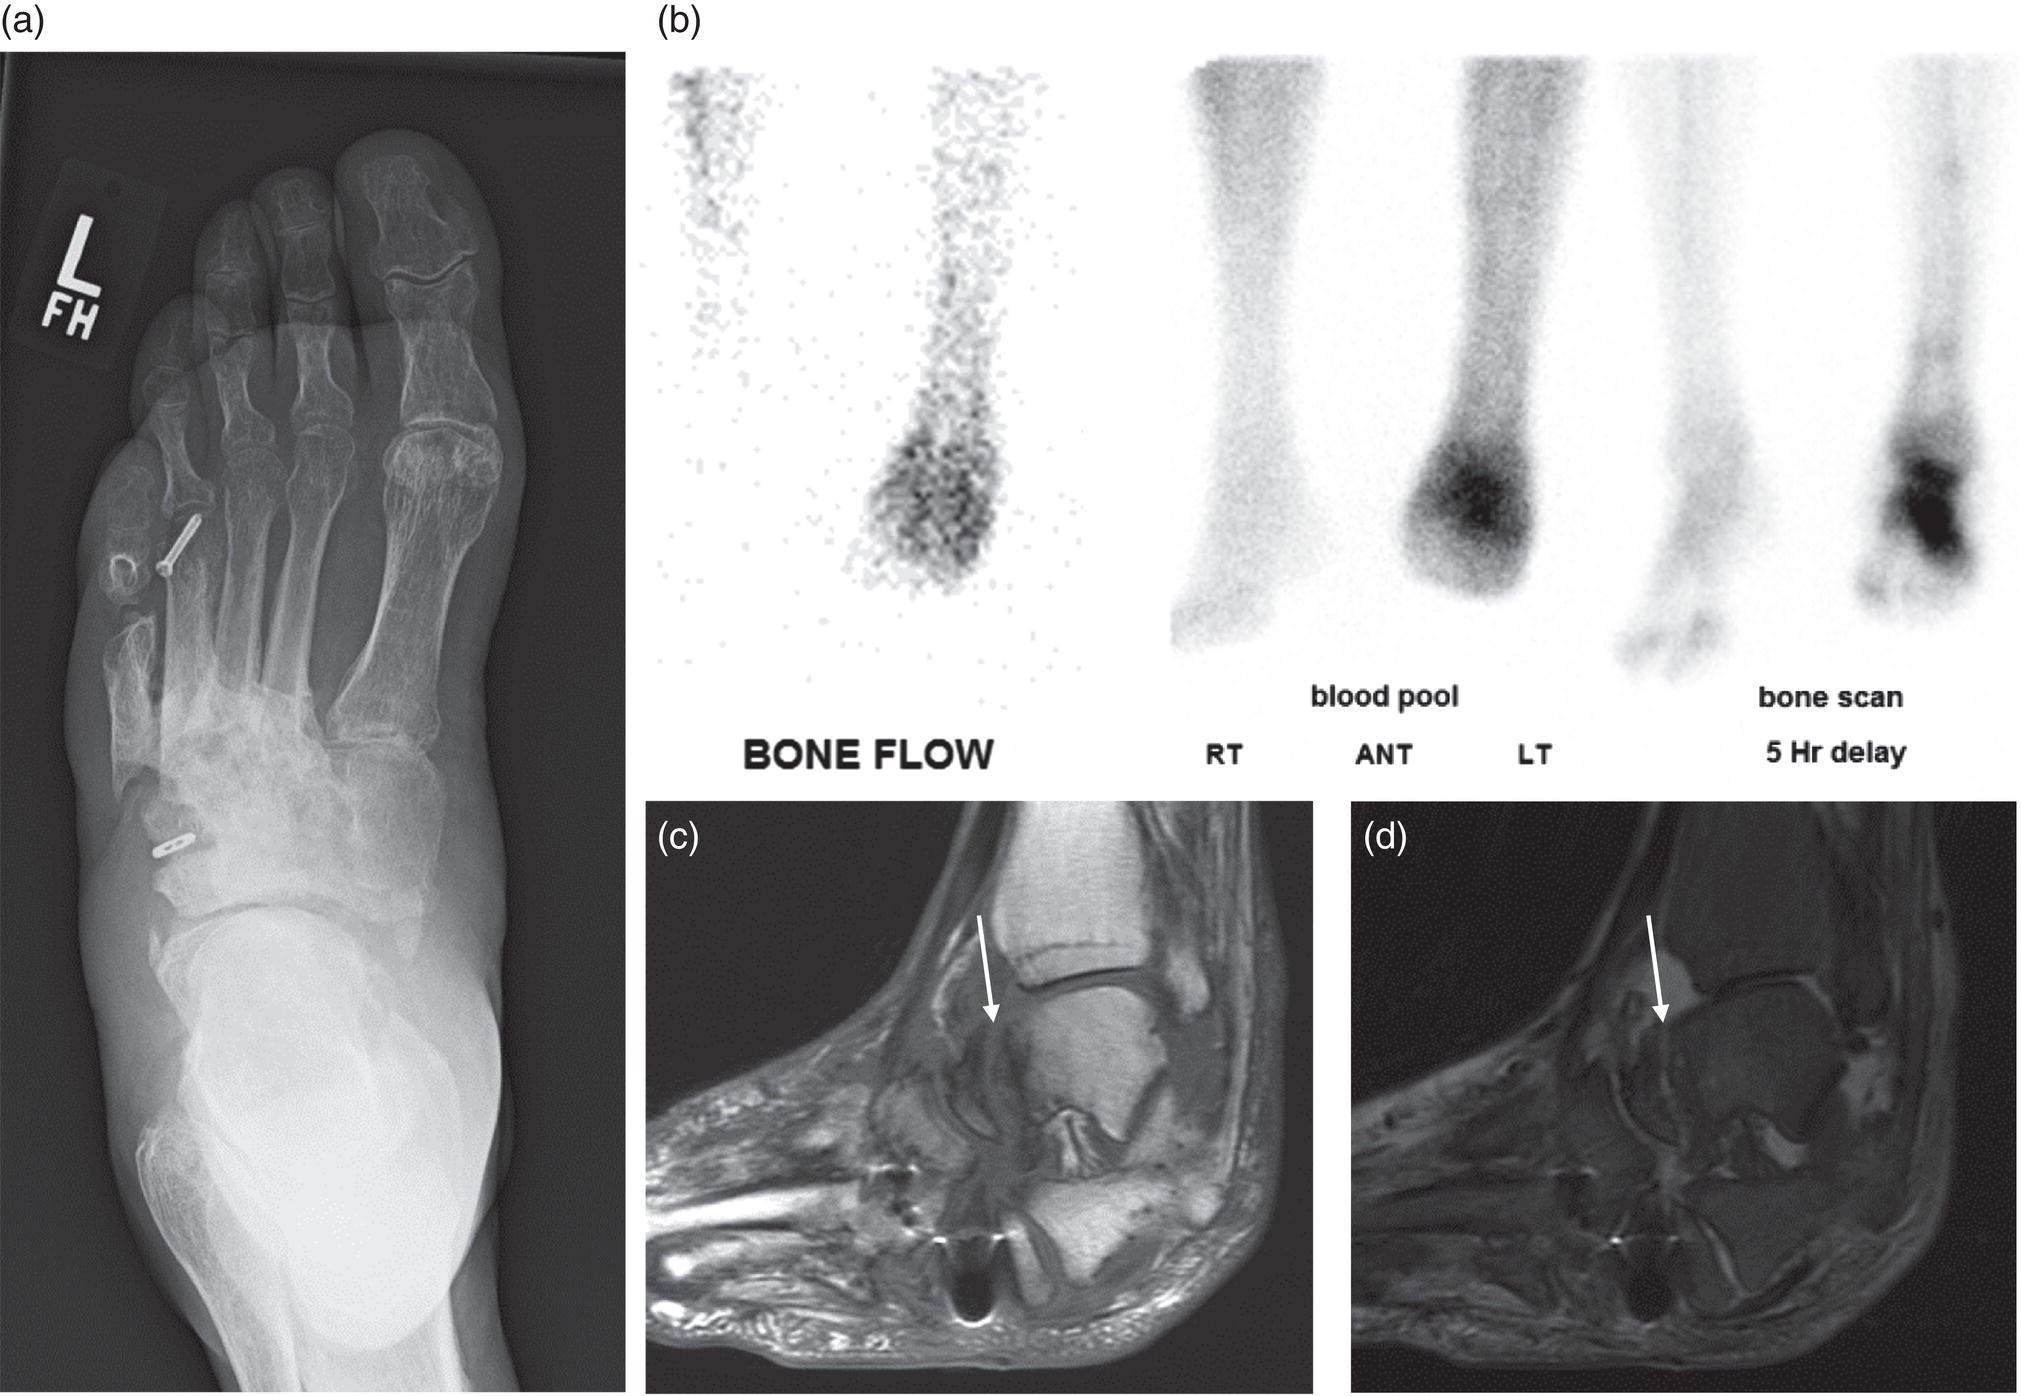
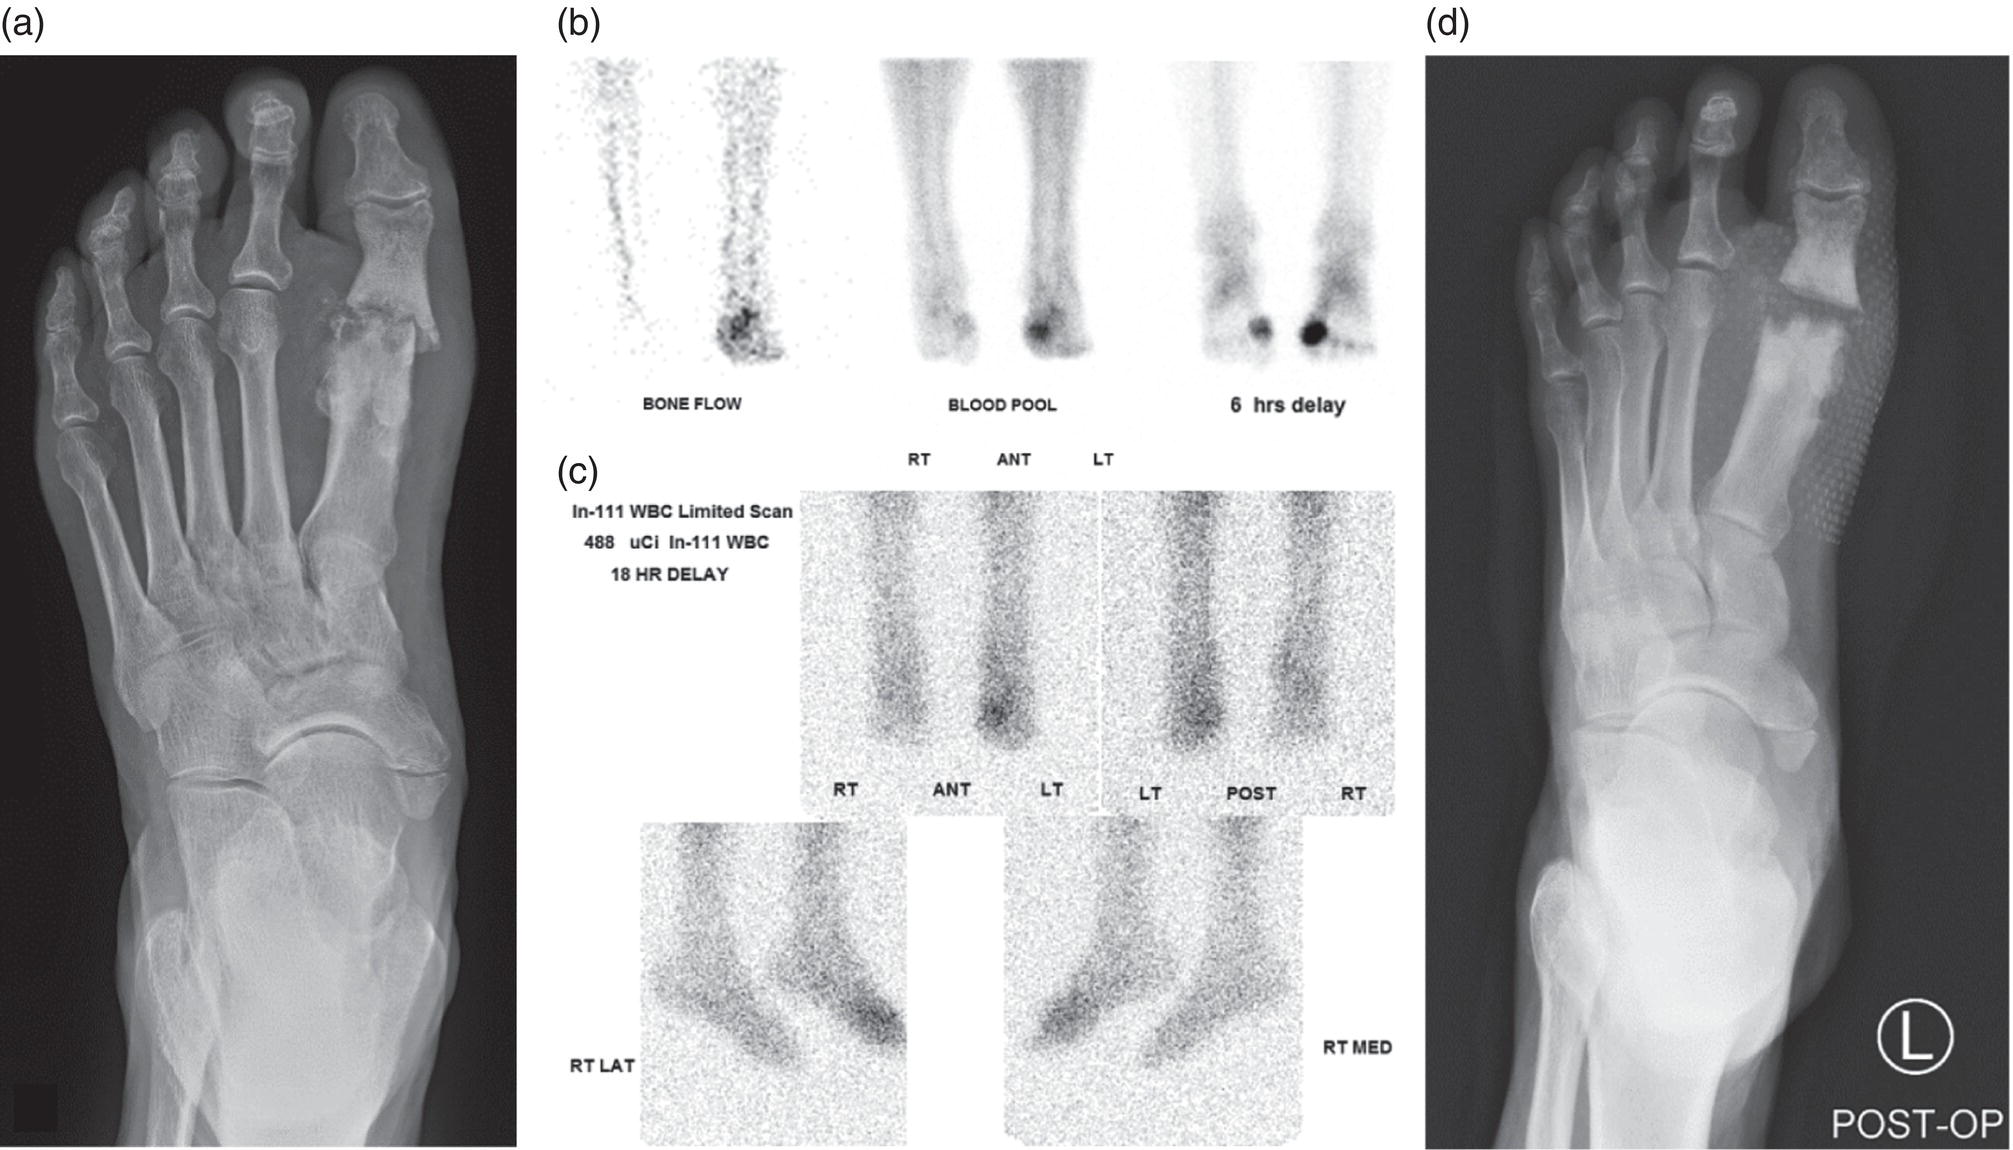
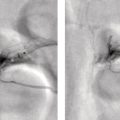
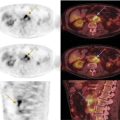
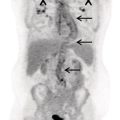
George R. Matcuk, Jr.1, Jordan S. Gross2, Dakshesh B. Patel3,4, Brandon K. K. Fields4, Dorian M. Lapalma3,4, and Daniel Stahl4 1 Department of Imaging, Cedars‐Sinai Medical Center, Los Angeles, CA, USA 2 Department of Radiology, University of California, Los Angeles, Los Angeles, CA, USA 3 Department of Radiology, University of Southern California, Los Angeles, CA, USA 4 Keck School of Medicine, University of Southern California, Los Angeles, CA, USA Nuclear medicine and the array of different radiotracers have an important role in the diagnosis and evaluation of a variety of musculoskeletal diseases. However, understanding the relevant anatomy and physiology, and correlating areas of radiotracer uptake with anatomic imaging modalities is of vital importance to prevent misinterpreting normal physiological uptake or uptake related to underlying degenerative conditions as other pathology. Plain radiographs are the first‐line imaging modality for evaluating most musculoskeletal conditions and should almost always be obtained prior to advanced imaging modalities, including nuclear medicine. X‐rays will give an overview of the patient’s bone mineralization, alignment, prior trauma or surgeries, degenerative changes, and focal lesions. Correlating focal radiotracer uptake with these findings is important for understanding the nature of this uptake. Multiplanar imaging such as single‐photon emission computed tomography (SPECT) and positron emission tomography (PET) enable more precise localization of radiotracer uptake. Combined studies with computed tomography (CT), such as SPECT/CT and PET/CT, enable precise co‐registration of tracer uptake with anatomic correlation and attenuation correction. New PET/magnetic resonance imaging (MRI) scanners that integrate PET with MRI offer improved correlation of PET tracer uptake with the superior bone and soft‐tissue contrast of MRI, particularly for correlating with areas of muscle or bone marrow edema or for tumor imaging. In the pediatric skeleton, there is normal radiotracer uptake on bone scintigraphy and fluorodeoxyglucose (18F‐FDG) PET within the physis related to osteoblastic activity at the zone of provisional calcification [1]. Physiologic and activity‐related stresses can also lead to mild focal radiotracer uptake on bone scintigraphy at joints and attachments of ligaments, muscles, and tendons (entheses) even before there is radiographic evidence of significant osteoarthritis or enthesopathy [2]. On 18F‐FDG PET, physiologic uptake can be seen in skeletal muscles and within brown fat [3]. Physiological or stress‐related muscle uptake (most commonly seen within the neck muscle related to tension) is usually linear, mild to moderate in intensity, and symmetric (Figure 21.1). Proper patient preparation prior to PET with fasting for at least 4–6 hours prior and administration of insulin or oral hypoglycemic medications prior to 18F‐FDG injection in diabetic patients can limit diffuse muscle uptake. Exercise should also be avoided for 24 hours prior to the examination and chewing, reading, and talking should be limited during the uptake phase. Correlation with attenuation on PET/CT can differentiate physiologic brown fat activity from adjacent muscle uptake or lymphadenopathy. Bone scintigraphy is often done to evaluate for osseous metastases and 18F‐FDG PET is commonly used for the diagnosis, staging, and monitoring of oncologic conditions. The most common pitfall when interpreting these studies is to mistake radiotracer uptake for malignancy, when this uptake is actually related to degenerative or inflammatory arthropathy, traumatic or insufficiency fractures, or benign tumors or tumor‐like conditions (Figures 21.2 and 21.3) [4, 5]. This can be a particular problem in the spine, where 18F‐FDG hypermetabolic activity can be seen in up to 22% of spine degenerative disease. Although pathological fractures tend to have a higher maximum standardized uptake value (SUVmax) compared to traumatic and insufficiency fractures there can be overlap depending on the timing of the fracture onset. Although most benign tumors also have lower SUVmax than malignant tumors, benign lesions, particularly those associated with a high number of multinucleated giant cells, can be quite metabolically active and some low‐grade malignant tumors, such as chondrosarcoma, can have relatively low uptake. In all cases, correlation with anatomic imaging is paramount. For instance, a study of bone scintigraphy showed that SPECT/CT led to a revision in the diagnostic category of disease in 23 of 71 patients (32%) compared to the SPECT interpretation alone in the extremities of patients [6]. Figure 21.1 80‐year‐old male with a past medical history of diffuse large B‐cell lymphoma. There is increased uptake in the bilateral infrahyoid muscles on 18F‐FDG PET axial CT (a) and axial and coronal fusion images (b, c, white arrows). The SUVmax value of the right infrahyoid muscle is 3.5 and the SUVmax of the left infrahyoid muscle is 3.0. The muscles are otherwise normal in bulk and morphology. The patient had no evidence of metastatic disease in the chest, abdomen or pelvis. Another important pitfall is attenuation correction artifacts on PET/CT studies. Contrast media and metallic hardware and implants with high density can lead to overestimation of hypermetabolic activity on attenuation‐corrected images (Figure 21.4). It is therefore important to also correlate with nonattenuation‐corrected PET images of the examination to more accurately evaluate activity [7]. Figure 21.2 74‐year‐old male with a history of left upper shoulder melanoma, status post excision, and biopsy. The patient had an 18F‐FDG PET for staging purposes. On the coronal MIP image (a), there is an area of increased metabolic activity at the right shoulder (blue arrow). Incidentally noted is a Foley catheter bag overlapping the right thigh. On the axial CT image (b), there is severe glenohumeral osteoarthrosis, with ossific joint bodies (yellow arrow) located within the anterior glenohumeral recess. These show moderate hypermetabolic activity on the fused axial PET/CT image (c). Conventional radiography has long been considered the first‐line diagnostic for suspected traumatic fracture [8, 9]. If greater delineation of anatomic structures is necessary, cross‐sectional imaging techniques, including CT and MRI, may lend additional utility in fracture detection and evaluation beyond conventional radiography alone [10, 11]. When imaging tomographically, CT is superior for visualizing cortical and trabecular bone, while MRI better visualizes soft‐tissue structures such as menisci, ligaments, articular cartilage, bone marrow, and fat [10–12]. Yet, in recent years, functional studies which identify physiological and metabolic changes in the bone have been increasingly utilized to detect changes in bone remodeling associated with pathologic injury. Bone‐seeking radiotracers, including technetium‐99m (99mTc)‐methyl diphosphonate (MDP), 99mTc‐pertechnetate, and 18F‐sodium fluoride (18F‐NaF), provide important physiological and anatomic information, and often demonstrate differential uptake levels well in advance of anatomic alterations (Figure 21.5) [8, 11, 13–15]. 18F‐FDG, a glucose analog known best for its applicability in oncologic PET/CT, has also shown utility in detecting inflammatory changes in the setting of traumatic facture [10, 11, 13]. Preferential localization of radiotracers using two‐ and three‐phase bone scintigraphy can reflect pathophysiologic bone repair as early as 24 hours post‐trauma in patients younger than 65 years of age [10]. 99mTc‐MDP and 99mTc‐pertechnetate in particular are widely used in skeletal scintigraphy because of their ability to bind to the hydroxyapatite crystalline lattice and collagen framework [9, 14, 16, 17]. Thus, bone scintigraphy plays a critical role in the evaluation of occult fracture, where areas of reactive bone can be detected by increased uptake of radionuclide in the absence of a visible fracture line on radiography [10, 14, 17]. This is especially helpful in situations where complex anatomical structures and low bone density may obscure the visual field, such as in fractures of the carpal bones, femoral neck, and nondisplaced intertrochanteric fractures [10]. Evaluation is somewhat limited in older patients, where lower bone turnover rates may delay early scintigraphic positivity. Nevertheless, sensitivities as high as 95% have been reported in all patients regardless of age at 72 hours post‐trauma [10, 14, 17]. Maximum uptake and anatomic localization of radionuclide occurs at 8–12 weeks during the subacute phase, with gradual resolution on flow and blood pool phases as the fracture transitions to the healing phase [10, 17]. Notably, abnormalities may persist on delayed phase imaging for up to 2 years [10]. Figure 21.3 60‐year‐old female with a history of lung carcinoma. Axial CT image (a), axial fused image from 18F‐FDG PET (b), and axial MIP image from 18F‐FDG PET (c) show a focus of calcific mineralization at the superior humeral head, adjacent to the greater tuberosity, at the location of the supraspinatus tendon attachment. On the PET images, there is increased hypermetabolic activity within this focus of mineralization (SUVmax 6.5). Overall, findings are compatible with calcific tendinosis (hydroxyapatite deposition disease). Fractured bone that has not completely healed within 6–9 months and has shown no signs of healing on serial X‐ray for a period of 3 months is defined as fracture nonunion [18]. Studies on nonunion in long bones following intramedullary nailing would suggest that optimal healing occurs between 4 and 12 months, whereby historically a lack of radiographic progression beyond 12 months is one indication for secondary revision [19–21]. Yet, an emerging body of literature suggests that poor callus visualization on radiography may not necessarily indicate absent biological activity [18, 22]. While nonunion may complicate up to 10% of fractures, current recommendations suggest that only those that do not exhibit evidence of biological activity require surgical supplementation [22]. As radionuclide uptake reflects both blood flow and new bone formation, photon deficiency on bone scintigraphy may be more reflective of absent osteogenesis, especially in cases of atrophic nonunion [18, 22]. When combined with SPECT or SPECT/CT, correlation of characteristic scintigraphic uptake with superior anatomic localization can identify whether the union defect affects both ends of the bone or only one [9, 10, 14]. Figure 21.4 51‐year‐old female with a history of multiple myeloma, with a history of distal femur lesion status post resection and placement of a modular endoprosthesis with a knee arthroplasty component (a). On the corresponding 18F‐FDG PET (b, c), there is attenuation correction artifact around the hardware (red arrows), with an SUVmax of 7.4. There is no evidence of residual or recurrent disease. Figure 21.5 47‐year‐old male with a history of prostate carcinoma, presenting with low back pain. Lateral radiographs (a) show a slight compression deformity at the superior endplate of the L3 vertebral body (white arrow). On MRI performed 3 months later (b), there is further compression of the vertebral body with retropulsion of the posterior portion of the body into the spinal canal (yellow arrow). NaF PET/CT performed 6 months later. The L3 compression fracture shows some degree of uptake (red circle) (c, d). Findings are on a background of diffuse osseous metastatic disease, with multiple additional areas of significant uptake in other lumbar vertebral bodies and within the bony pelvis (blue arrows). At the expense of spatial resolution, PET/CT offers the advantages of higher sensitivity and more accurate quantification of changes in metabolic activities in comparison to SPECT/CT [9]. 18F‐NaF PET/CT in particular has demonstrated superior sensitivity as compared to standard radiographs in detecting new and old traumatic fractures in the setting of nonaccidental pediatric trauma [4, 8, 23, 24]. In contrast to 18F‐NaF, which better reflects increased blood flow and osteoblastic activity, 18F‐FDG can instead be used to reflect osseous hypermetabolism subsequent to traumatic fracture. Gradual decline of this initial hypermetabolic state is expected in cases of uncomplicated fractures and coincides with progression of the normal healing process. As such, 18F‐FDG uptake in the setting of simple fracture is expected to normalize within 3 months, marking an important differentiation between metastatic and hypermetabolic bone disease [4, 15]. Furthermore, 18F‐FDG uptake also demonstrates a much lower mean SUVmax in cases of traumatic as opposed to malignant fracture (2.9 vs. 12.0, respectively); however, potential obfuscation of anatomic detail nevertheless necessitates separate evaluation of unfused CT with bone window settings, as osseous metastatic disease can present similarly with foci of 18F‐FDG uptake [4, 13]. Thus, when correlated with sustained abnormalities on flow and blood pool scintigraphic phases, persistent uptake of 18F‐FDG beyond the 3‐month mark should raise suspicion for fracture complications, in particular malignancy and infection [4, 10, 11, 13–15]. Broadly speaking, stress fractures fall into one of two categories: fractures that arise from normal loading on abnormal bone, termed “insufficiency fractures,” and fractures that arise from abnormal loading on normal bone, termed “fatigue fractures” [25, 26]. Fatigue fractures occur most often in younger athletes and military recruits following an abrupt increase in frequency, intensity, or duration of activity [14, 25, 27–30]. By contrast, insufficiency fractures occur most commonly in the elderly population in the setting of osteoporosis; however, rheumatoid arthritis, hypermetabolic bone disease, neurological dysfunction, chronic glucocorticoid therapy, and radiation history are all known risk factors (Figure 21.6) [25]. The vast majority of stress fractures occur in the lower extremities, with the tibia being the most commonly affected bone (23.6%) [10, 27, 28, 30]. Regardless of etiology, stress fractures are more common in women than in men and are often first brought to clinical attention with a presenting complaint of pain and point tenderness over the bony defect [10, 14, 25, 30]. Figure 21.6 90‐year‐old female with diffuse large B cell lymphoma. Axial CT image (a) from 18F‐FDG PET shows a nondisplaced posterior right rib fracture (yellow arrow). On the coronal MIP image (b), there are areas of hypermetabolic activity at multiple posterior right ribs (blue circle). Findings are compatible with insufficiency rib fractures, secondary to this patient’s osteopenia. Sagittal series from a CT chest abdomen and pelvis (c), with a compression deformity at the L1 vertebral body (red circle). This is a relatively common finding in patients with osteopenia/osteoporosis. As was the case with traumatic fracture, plain radiography is considered the first‐line imaging modality for suspected stress fracture; however, radiographs are relatively insensitive in detecting early associated changes, especially when bone density derangements are concomitantly present [25, 27]. Time to positivity on X‐ray can vary anywhere from 2 weeks to 3 months, with as many as 85% of stress fractures remaining undetected on first radiographs [10, 27, 29, 30]. When a fracture defect is visualized, radiography would be expected to show focal cortical thickening with a faint transverse cortical radiolucency [25, 27]. Progression of healing coincides with periosteal reaction on both cortical and endosteal surfaces, whereby continued remodeling results in thickening and sclerosis of the endosteum [27]. Owing to its ability to resolve high‐attenuation tissues in detail, CT is capable of detecting discrete fracture lines and periosteal reactions with greater sensitivity than either plain radiographs or MRI. This is especially useful for identifying fracture lines in situations that are otherwise difficult to visualize, such as in cases of pedicle fractures, pars interarticularis fractures, and navicular fractures [25, 27]. CT is also the most sensitive modality for identifying early signs of fatigue in cortical bone and is thus the preferred modality for diagnosing osteopenia [27]. The primary advantages for the use of CT lie in its superior resolution of fracture lines, particularly in bones for which cortical thickening is part of the expected physiological stress reaction (e.g. tibial bones). Yet, inferior sensitivity outside of the acute setting limits its use, as CT is unable to adequately demonstrate edema and osteoblastic activity related to bone turnover in more chronic lesions [25, 27]. Multiphase bone scintigraphy is considered the gold standard for diagnosis of stress fracture, with demonstrable radionuclide localization occurring as early as 72 hours following symptom onset [10, 14, 25, 27]. Focal uptake in cortical bone on the skeletal phase is an important differentiator between hyperemia caused by stress reaction and stress fracture, both of which may cause radiotracer uptake on angiographic and soft‐tissue phases [14]. Scintigraphic positivity is observed in as many as 40% of cases with negative initial radiography, prior to progression to intracortical injury and extension into the periosteum [10, 30]. Moreover, symptoms of pain are correlated with the degree of scintigraphic uptake, and increased pain symptoms have been further correlated with progression of stress injury [30]. Yet, bone scintigraphy is limited by poor specificity, with reports of up to 40% of radiotracer uptake occurring at asymptomatic sites [25, 27]. Thus, while bone scanning provides valuable information on the severity and progression of stress fractures [30], accurate diagnosis is best achieved by correlating among other modalities. Notably, correlative findings with SPECT/CT facilitates both detection of smaller sized lesions and identification of the stage of bone stress [10, 14]. Though costly and time‐consuming, MRI is reported to be 100% sensitive and 85% specific for diagnosing stress fractures. Furthermore, MRI is both noninvasive and nonirradiating, two distinct advantages in comparison to bone scintigraphy [27]. Fracture lines can be visualized as band‐like regions of T1‐ and T2‐weighted hypointensity, with T2‐fat saturated and short tau inversion recovery (STIR) hyperintensity in neighboring bone marrow and soft‐tissue structures [25, 27]. Characteristic MRI changes, when correlated with early scintigraphic positivity, can be especially useful when imaging anatomically complex areas [27, 30]. One such applicability of MRI lies in the diagnosis of femoral neck stress fractures, where detection of bone marrow edema allows for more precise anatomic localization than either bone scintigraphy or standard radiography alone. Superior spatial resolution on MRI allows for additional classification as either compression or tension femoral neck fracture, which has important prognostic value and further guides management [27]. 18F‐FDG PET has historically been the modality of choice in detection of sacral insufficiency fractures, which frequently occur in cancer patients following chemotherapy and radiation. “Honda sign” radionuclide localization is classically described, and correlates well with characteristic scintigraphic appearance [4, 15, 25]. However, 18F‐FDG is a glucose analog that is also nonspecifically taken up by tumor cells, which can create situations of diagnostic uncertainty when radionuclide localization is not prominent [15, 31]. Emerging literature suggests that use of bone‐specific radionuclides such as 18F‐NaF may alternatively be used, as these agents more accurately reflect the increased blood flow and osteoblastic responses that are expected in the physiologic fracture response [31]. 18F‐NaF PET has also shown utility in detecting endplate injuries and quantifying stress fractures, in large part due to high target‐to‐background ratios and short imaging times [14, 24, 28]. These properties are especially helpful in detecting fractures of the pars interarticularis and pedicles [14], particularly when characteristic lucencies are visualized on unfused CT bone windows as described above. In either case, increasing prevalence of hybrid construction PET/CT and PET/MRI systems have only further cemented PET as both a complementary and primary imaging modality, a trend only expected to continue as nuclear imaging in general becomes more accessible [14, 15]. In cases of medial tibial stress syndrome, visualization of periosteal edema by MRI is crucial for monitoring progression to shin splints and soleus enthesopathy [14]. Evaluations done on runners with tibial pain revealed that MRI is more accurate than bone scan in correlating clinical symptoms with degree of visualized bony deterioration and was also better able to predict duration of the symptomatic period [27]. Furthermore, fluid‐sensitive and T1‐weighted characteristics yield valuable prognostic information, which allows for recommendations on the optimal duration of inactivity [25, 30]. Yet, when in doubt, correlative findings on MRI with bone scintigraphy may be useful in differentiating between the spectrum of tibial stress injuries. For example, linear uptake localized to the posteromedial tibia on delayed phase bone scan only is more consistent with shin splints, whereas overt stress fractures would be expected to demonstrate more focal radiotracer uptake on all phases [10, 14]. Moreover, enthesopathies with involvement of the tibialis anterior muscle may further demonstrate characteristic uptake in the proximal two thirds of the anterolateral tibial border, which occurs secondary to periosteal reaction in the area of muscle insertion [10]. Proper rest and inactivity are essential to avoid continued bony remodeling and injury progression, which only further delays return to activity and can result in long‐term functional impairment [14, 25]. Heterotopic ossification (HO) is a benign condition characterized by extraskeletal osteogenesis of lamellar bone [4, 32–35]. HO is considered a non‐neoplastic process, and can occur in all types of soft tissues [32, 35]. On a cellular level, it is thought to arise from induction events in a permissive environment which allow for the differentiation of pluripotent mesenchymal cells into osteogenic precursors [32, 34, 35]. Frequent causes include musculoskeletal trauma, spinal cord injury, and central nervous system injury, often in young adults and adolescents. Classically associated risk factors include total hip arthroplasty (THA) and paraplegia secondary to traumatic brain or spinal cord injury, where the hip is the most commonly affected site in both cases [33–36]. Other locations, including the knee, elbow, shoulder, and feet, are less common [33–35]. Known hereditary causes of HO include fibrodysplasia ossificans progressiva and progressive osseous heteroplasia, yet the incidence of these conditions is comparatively quite rare [32, 34]. HO is a potentially debilitating condition, with known sequelae of severe range of motion restriction and ankylosis occurring in up to 10% of cases [32–35]. Restricted mobility may predispose patients to a number of complications, including limb contractures, venous thromboembolism, and pressure ulcers secondary to venous stasis [33, 35]. Curiously, current literature suggests that HO may also contribute to deep venous thrombosis by triggering an inflammatory reaction independent of venous stasis secondary to mass effect [35]. However, as HO is frequently asymptomatic on initial presentation, early detection poses significant challenges in disease management [32, 35]. Conflicting evidence suggests a role for nonsteroidal anti‐inflammatory drugs and radiotherapy in prophylaxis for high‐risk patients, although no consensus guidelines currently exist. Passive range‐of‐motion exercises and diphosphonates may be therapeutically beneficial, although consistent recommendations based on high‐quality evidence remain similarly lacking [32–34]. Definitive management is by surgical resection following sufficient maturation of the bony matrix, which typically occurs after 6–9 months; however, risks of soft‐tissue injury, recurrence, and excessive bleeding limit eligibility for excision only to patients who experience significant functional impairments [32, 35]. The onset of HO is typically 2 months following a traumatic event, although evolving heterotopic foci may be seen as early as 3–4 weeks [32, 34, 35]. Clinicians must maintain a high index of suspicion, as HO commonly presents with nonspecific complaints of fever, erythema, and joint stiffness [34, 37]. Nevertheless, given that the differential diagnosis also includes osteomyelitis, thrombophlebitis, cellulitis, deep vein thrombosis, and neoplastic processes, care must be taken to definitively exclude more sinister etiology based on thorough clinical history and careful review of imaging findings [32, 34, 35, 37]. Resolving diagnostic uncertainty is predicated on a correlative approach to imaging findings across multiple imaging modalities, including conventional radiography, multiphase bone scintigraphy, SPECT/CT, and PET/CT [32, 34, 35]. Radiography was historically the imaging modality of choice for diagnosing HO [32, 34]. Yet, the use of X‐ray is severely limited by poor sensitivity in early disease, whereby plain‐film radiographs can remain normal for up to 4 weeks after an inciting event [32, 34]. However, once sufficient ectopic mineralization has occurred, foci of HO can be visualized on X‐ray as circumscribed calcium deposits with central lucency [33, 34]. Alternatively, ultrasound can be used to detect local signs of inflammation and is positive as early as 1 week following THA [33]. On the other hand, while CT is more sensitive than X‐ray in early‐stage HO, it is poorly specific and is primarily use for staging purposes and guidance of targeted therapy [32, 34]. Multiphase bone scintigraphy is currently the method of choice for earliest detection of HO and is usually positive after 2–4 weeks [32–34]. Early‐phase HO is characterized by hyperemia and blood pooling, which are particularly evident on flow and blood pool images. These changes can be used to detect HO as early as 2.5 weeks following inciting injury, even in the absence of bone uptake on delayed imaging [32–34]. Still, findings should be correlated with elevations in serum alkaline phosphatase (ALP) levels, which can also be detected as early as 2 weeks and are indicative of an increase in osteogenic activity [32–34, 36, 38]. Yet, choice of radiotracer must take into account clinical context, as uptake of gallium‐67 (67Ga) in particular also occurs in both osteomyelitis and malignant processes [34, 37]. Fortunately, 99mTc‐MDP can be used to differentiate HO from infection and tumor, whereby proportional uptake of both 67Ga and 99mTc‐MDP is more consistent with a diagnosis of HO [34]. Serial bone scans can be used to monitor disease progression over time and predict postoperative recurrence [33, 34, 36]. Decreases in flow study and blood pool radiotracer uptake are both indicative of HO maturation. Scintigraphic osteoblastic activity typically peaks a few months after the inciting event and similarly trends downward with HO maturation. Overall, complete normalization of the bone scan to baseline can take as long as 6–12 months [34]. Along with clinical improvement and normalization of serum ALP, these findings should be used to inform appropriate timing of surgical resection, as premature resection of HO invariably leads to recurrence [32–34]. An emerging body of evidence supports the use of adjunctive SPECT/CT in addition to multiphase bone scintigraphy to provide more accurate localization of osteoblastic activity [32, 34, 35, 38]. Precise anatomic visualization is paramount, as accurate diagnosis requires that the foci of osteogenic activity be identified as extraskeletal [32]. As with multiphase scintigraphy, SPECT/CT for bony visualization conventionally uses radiopharmaceutical 99mTc‐MDP given its relatively short half‐life of 6 hours and avidity for assimilation into the bony matrix [35, 36]. Conveniently, current technologies allow for the construction of CT scanners with integrated gamma cameras. Through streamlined acquisition of both SPECT and CT components, unified constructional design facilitates simultaneous acquisition and accurate layering of the topographic reconstructions [35]. When correlated with characteristic uptake on multiphase scintigraphy, clearly identified extraskeletal foci with a zonal pattern of peripheral mineralization on cross‐sectional examination of SPECT/CT further supports a diagnosis of HO in the presence of clinical uncertainty [32, 35, 38]. Furthermore, SPECT/CT has shown some ability to evaluate for residual osteoblastic activity at the time of resection, which may coincide with a greater risk of recurrence [32, 35]. Foci of metabolic activity associated with osteoblastic activity in association with HO can also be detected on PET/CT. Early‐stage HO may be indistinguishable from sarcoma on conventional CT. However, a classic zonal pattern of mineralization will be observed with HO and can help differentiate it from primary malignancy. Starting at 6 weeks, imaging will characteristically reveal a higher density of mineralization peripherally, with central hypoattenuation. When taken in conjunction with appropriate clinical context, it may be possible to exclude a neoplastic process without the need for invasive biopsy [4, 13]. As with SPECT/CT, correlation with typical findings on each of the aforementioned diagnostic modalities can help successively narrow the differential diagnosis on the basis of imaging and clinical judgment alone. Rheumatoid arthritis is an inflammatory disorder with a main target for the synovial membrane of joints, bursae, and tendon sheaths. The earliest and most recognizable imaging finding is thickening and inflammation of the synovial membrane (synovitis) [39]. This results in synovial proliferation and as this process continues it progressively destroys the articular cartilage. The inflammatory tissue then attacks the subchondral bone, with the potential for bony erosive change and destruction, fibrosis and contracture of the joint, and ultimately bony fusion [39]. Rheumatoid arthritis is most commonly a bilateral and symmetric process, and more frequently involves the small joints of the wrists/hands and feet, shoulders, elbows, and knees. It more commonly affects women (at a 3 : 1 ratio), and average age of onset is between 30 and 50 years of age [40]. Patients are also often diagnosed via serologic testing, including a positive rheumatoid factor (RF) and anticyclic citrullinated peptide antibody (anti‐CCP antibody) [40]. Radiography is the mainstay in the preliminary evaluation of rheumatoid arthritis [41]. While radiographs may not be the most sensitive imaging modality, due to overlap of bony structures, they often give a good overview of the patient’s potential disease status. Specifically, hallmarks of rheumatoid arthritis characterized on radiographs that may indicate a more progressed state of disease include periarticular osteopenia, uniform joint space narrowing, and bony erosions. Figure 21.7 51‐year‐old female with a history of rheumatoid arthritis. On radiographs of the bilateral hands (a) there is mild peri‐articular osteopenia. However, there is no evidence of uniform joint space narrowing or erosive change at the radiocarpal or intercarpal joints at either wrist. On 99mTc‐MDP bone scan (b), there is increased radiotracer uptake at both wrists (blue arrows), suggestive of synovitis and/or early arthritic change, quite possibly rheumatoid arthritis given this known diagnosis. Ultrasound and/or MRI are superior to radiographs when evaluating for joint inflammation and joint damage [41, 42]. Both modalities are appropriate next steps in the imaging evaluation of rheumatoid arthritis. Although detecting small or subtle erosions on ultrasound can be challenging, ultrasound is a good modality for evaluating large erosions, synovitis, and tenosynovitis. In addition, ultrasound offers the potential for dynamic imaging for assessment of tendon movement and function. The role of MRI in the evaluation of rheumatoid arthritis has been extensively described in the literature. MRI is superior at detecting early erosive type changes and early findings of joint destruction, including synovial hypertrophy and pannus formation [41]. It also allows for a more comprehensive assessment, with capability to evaluate the tendons, tendon sheaths, ligaments, possible joint effusions, and/or extra‐articular collections [43]. There many current and ongoing studies evaluating the use of contrast‐enhanced ultrasound (CEUS) and dynamic contrast enhanced‐MRI (DCE‐MRI) to evaluate the enhancement pattern of synovitis before and after treatment. The role of imaging in evaluating treatment response in rheumatoid arthritis, therefore, is currently evolving. Conventional nuclear medicine imaging, including two‐dimensional planar imaging and SPECT, can also play a role in the evaluation of rheumatoid arthritis. Radionuclides that have been used and/or described in the literature to target inflammatory arthropathy include 99mTc, Ga67, indium‐111 (111In) and iodine‐123 (123I) [44]. 99mTc is the most commonly used of these agents and is often labeled with diphosphonates, most commonly MDP (Figure 21.7). Three‐phase bone scintigraphy using 99mTc‐MDP has a high sensitivity in the evaluation of inflammatory arthropathy, but it has low specificity [45], being difficult to differentiate from degenerative or neoplastic disease. 99mTc can be tagged with other agents, including labeled leukocytes (hexamethylpropylene amine oxime [HMPAO]) and human immunoglobulin G (Figure 21.8) [44]. With respect to the other radionuclides, 67Ga can be labeled with citrate and 111In can be labeled with leukocytes or octreotide. The use of these agents has been geared mostly toward research purposes and is guided by the dogma that these agents will help measure joint inflammation in active rheumatoid arthritis [44]. However, as with 99mTc‐MDP, results with these agents are sensitive, but not specific. More advanced nuclear medicine imaging and newer radiopharmaceutical agents can increase sensitivity and specificity, and can ultimately play a role in rheumatoid arthritis management. 18F‐FDG PET/CT is a common imaging modality used to evaluate oncologic disease, performed with the dogma that cancer cells metabolize glucose at an elevated rate and need. This is qualitatively evaluated by color‐coded areas of 18F‐FDG uptake on PET/CT and quantifiable by measuring the standardized uptake value (SUV). However, the concept of increased glucose metabolism is not confined to cancer cells and may also be seen in sites of any inflammatory type of response [46]. Much work has been done to understand the pathogenesis of the inflammatory response (synovitis) in rheumatoid arthritis. For instance, Kubota et al. suggested a model for how the different cells involved in the inflammatory process may adopt a glycolytic mechanism in the early 1990s [46–48]. Synovitis in rheumatoid arthritis exhibits massive leukocytic infiltration, proliferation of synovial membranes, and neovascularity, leading to the formation of a pannus. This develops under the conditions of (i) inflammatory cytokine release and (ii) hypoxia. Both of these pathophysiologic conditions result in a cascade that cites an abundance of fibroblasts and active macrophages; these are the predominant cells thought to contribute to 18F‐FDG accumulation in 18F‐FDG PET/CT imaging (Figure 21.9) [49]. Figure 21.8 45‐year‐old female with right elbow pain, history of rheumatoid arthritis, and right elbow arthroplasty. Images were taken after IV administration of 99mTc‐sulfur colloid, 99mTc‐MDP, and 111In‐HMPAO. Images show increased uptake in the immediate (a), delayed (b), and 24‐hour delayed phases (c) in both elbows. Note the increased uptake at the left elbow (blue circle). Uptake in the right elbow on preceding 99mTc‐MDP bone scan corresponds to a right elbow arthroplasty (not shown) and the possibility of hardware infection was considered. However, on left elbow radiographs (d, e), there are features of rheumatoid arthritis, including joint space narrowing at both ulnotrochlear and radiocapitellar joints, and a small elbow effusion (yellow arrows), most compatible with synovitis. Figure 21.9 65‐year‐old male with polyarthralgia. Radiology of the left hip (a) shows symmetric and uniform joint space narrowing at the hip. Lateral radiograph of cervical spine (b) shows narrowing at the atlantoaxial space (red arrow). Overall, findings are consistent with a provided history of rheumatoid arthritis. The patient also presented for staging with 18F‐FDG PET because of a diagnosed renal cell carcinoma. Axial CT image (c) shows severe uniform joint space narrowing at the glenohumeral joint. On the axial MIP image (d), there is hypermetabolic activity at the glenohumeral joint (blue arrow), reflective of known rheumatoid arthritis and likely synovitis. Unraveling and understanding the inflammatory response of synovitis in rheumatoid arthritis sparked continued interest in the use of 18F‐FDG PET/CT and its potential use of PET/CT in quantifying joint inflammation in rheumatoid arthritis, its correlation with clinical disease activity, and monitoring treatment response. In the early‐mid 1990s, Polisson et al. compared to the volume of pannus in two patients (as detailed on contrast‐enhanced MRI) and looked at the 18F‐FDG‐avidity in synovitis both before and after treatment. They noted that that the extent of pannus, and the extent of metabolic activity, may correlate with the patient’s clinical response to treatment [50]. Since that time, numerous articles have been published assessing the role of 18F‐FDG PET/CT and its role in evaluating rheumatoid arthritis synovitis [46, 47, 51–60]. One of the main advantages of 18F‐FDG PET/CT in evaluating rheumatoid arthritis is whole body imaging. Such imaging has added to our understanding of the distribution and patterns of involvement of rheumatoid arthritis. It is known that rheumatoid arthritis involves joints in a symmetric and bilateral pattern. However, this type of metabolic imaging has allowed investigators to evaluate potential metabolic activity before morphologic changes and clinical symptoms occur [52]. In addition, it has allowed investigators to discover and create additional hypothesis about this inflammatory disease process. In 2011, Kubota et al. showed that the number of joints that showed increased 18F‐FDG uptake in patients with rheumatoid arthritis can be higher than the number of symptomatic joints. For instance, they found that most patients with increased 18F‐FDG uptake in larger joints almost always had increased uptake at the atlantoaxial joint [46]. In 2007, Seldin et al. showed that many patients with rheumatoid arthritis had increased 18F‐FDG uptake in axillary lymph nodes [61]. Therefore, one can conclude that 18F‐FDG PET/CT can act as a great imaging tool as we continue to try to unravel the pathophysiology of rheumatoid arthritis, trying to answer questions about its pattern of distribution and disease activity. As described previously, work by Polisson et al. attempted to show how treatment of rheumatoid arthritis can be measured by 18F‐FDG PET/CT. This type of work has continued, with multiple studies evaluating the quantitative measure of radiotracer uptake (SUVmax) to assess treatment response. This is particularly true with the development of newer disease modified antirheumatic drugs (DMARDs) [58]. 18F‐FDG is not the only radiotracer that has been used and/or described with PET/CT for the purposes of evaluating inflammatory arthropathy. Other PET/CT and SPECT radiotracers that have been described for imaging of rheumatoid arthritis include 18F‐galatco‐RGD, 99mTc‐labeled annexin‐V, 123I‐IL‐1 receptor antagonists, 11C‐PK11195, 124I‐rituximab, 11C‐choline, 2‐18F‐fluoroethylazide‐conjugated‐pyrimidine‐2,4,6‐trione, 99mTc‐labeled E‐selectin‐binding peptide, and 18F‐FEDAC(N‐benzyl‐N‐methyl‐2‐[7,8‐dihydro‐7‐(2‐18F‐fluoroethyl)‐8‐oxo‐2‐phenyl‐9H‐purin‐9‐yl]acetamide) [62, 63]. Each of these agents has a specific cellular target, as such each of these agents may target the cellular inflammatory process or pathway(s) in a different way. For instance, 99mTc‐labeled annexin targets apoptotic cells and can be used to assess response to therapy in rheumatoid arthritis. Comparatively,123I‐IL‐1 receptor antagonists target IL‐1 receptors on inflammatory cells and can be used to assess the inflammatory response in rheumatoid arthritis. However, the majority of these aforementioned agents have been tested and evaluated in animal models and have not become available for mainstream use in clinical practice. Spondyloarthropathies are a group of inflammatory diseases characterized by axial or peripheral arthritis and enthesitis, with associated extra‐articular manifestations (depending on the specific inflammatory condition/diagnosis). This category of diseases includes ankylosing spondylitis (AS), psoriatic arthritis (PsA), reactive arthritis (formerly Reiter’s syndrome), inflammatory bowel‐disease (IBD)‐related arthritis, and undifferentiated spondyloarthritis [40]. Each of these diseases has characteristic features of clinical presentation, including sex predilection, age of onset, and predilection for certain joints. For instance, AS is an inflammatory arthropathy, associated with the HLA‐B27 gene, that often presents in the third decade of life and affects males more than females. It often affects the axial skeleton, presenting with back pain related to sacroiliitis. Psoriatic arthritis often presents between the fourth and sixth decades, without a sex predominance. Joint manifestations often precede skin findings of psoriasis [40]. Although the patient’s clinical history is integral to differentiating between these types of inflammatory arthropathy, imaging features can be an important tool. As above, joint predilection can allow a radiologist to narrow the differential diagnoses between these different types of arthropathy. However, the imaging appropriateness criteria – at least the initial imaging workup – is often the same for all types of seronegative inflammatory arthropathies. Similar to rheumatoid arthritis, radiography is the mainstay for preliminary evaluation, particularly in evaluation for erosions, enthesitis or bony proliferation [41]. Ultrasound and MRI are considered appropriate imaging modalities for further imaging evaluation [41]. With respect to ultrasound, it is ideal in evaluating for synovial hypertrophy and synovial hyperemia. Additionally, it can evaluate for enthesitis, depending on the location and accessibility of the target area. Ultrasound may have a role in evaluating for erosive changes, although as in rheumatoid arthritis detecting small or subtle erosions in seronegative spondyloarthropathies on ultrasound can be challenging [64]. MRI is a very sensitive modality to evaluate for erosive changes, synovitis, and enthesitis. It is often used as a mainstay to evaluate for subtler or early morphologic/structural changes of spondyloarthropathy, particularly if there is clinical concern for sacroiliitis. Table 21.1 Features of spondyloarthropathies on 18F‐FDG PET/CT. As detailed in the imaging review by Hotta et al., understanding the distribution and localization of inflammation in the different spondyloarthropathies is integral in our interpretation of nuclear medicine studies (performed for this purpose). However, the use of nuclear medicine as an imaging strategy for the diagnosis and evaluation of this group of diseases is not entirely common. Of the spondyloarthropathies, psoriatic arthritis has been the most researched with respect to imaging protocols and workup [55, 65]. Table 21.1 summarizes some of the characteristic findings of the spondyloarthropathies on 18F‐FDG PET/CT. A distinguishing feature of the spondyloarthropathies is enthesitis, or inflammation at the sites where ligaments or tendons attach onto bone. Long‐standing enthesitis can result in periosteal bone formation and erosive type change. Nuclear medicine evaluation for enthesitis has been reported in the literature, particularly in the evaluation of psoriatic arthritis. Similar to what has been discussed with rheumatoid arthritis, the use of 18F‐FDG PET to evaluate for active areas of enthesitis or subclinical arthritis can be useful in terms of diagnosis, treatment, and treatment response/management (Figure 21.10) [65–67]. There have been studies that have assessed this using 99mTc‐MDP as well [68]. Conventional radiography is the most commonly used and cost‐effective modality for imaging osteoarthrosis (OA) for both initial diagnosis and routine follow‐up [69]. Radiological grading is based mostly on joint space narrowing as an indicator for cartilage loss (chondrosis) and secondary signs such as osteophytosis and subchondral sclerosis and cystic changes [70]. MRI is the preferred modality for direct evaluation of cartilage with high specificity (93%) and modest sensitivity (69%) compared with arthroscopy [71]. Conventional anatomic sequences such as proton‐density (PD)‐weighted images are most commonly used clinically, but newer 3D sequences and compositional MRI techniques may allow for earlier diagnosis and more robust quantification of chondrosis and follow‐up of increasingly performed cartilage repair surgeries [72]. Magnetic resonance and CT arthrography are also excellent for depicting surface lesions of cartilage [73]. Tc‐99m MDP scintigraphy can offer a simple whole‐body survey to identify the site of pain in patients with complex symptoms and overall pattern and extent of OA. There is a high sensitivity for bone reaction (osteophytes and subchondral sclerosis or cystic change), but a bone scan is unable to detect early changes such as low‐grade chondrosis and thus offers low sensitivity for OA. SPECT has better sensitivity and improves anatomic localization and hybrid imaging with SPECT/CT further improves diagnostic accuracy [6]. SPECT/CT of the knee has been shown to correlate with the degree and size of chondral lesions on MRI [74]. Subchondral bone tracer uptake (BTU) has also been shown to correlate with meniscal pathologies on MRI [75]. SPECT/CT can also help guide therapy decisions by identifying compartment overloading to identify patients who may benefit from osteotomies or unicompartmental arthroplasty placement [73, 76]. SPECT/CT is also useful for identifying the specific cause of pain and the appropriate level of treatment in elderly patients with lumbar spine disease [77]. SPECT/CT also demonstrates high agreement with Modic endplate changes on MRI in patients with degenerative disc disease and the Pathria grade on CT in patients with facet joint degeneration [78] [79]. 18F‐NaF PET/CT is also a very sensitive tool for detection of osteoarthrosis, with results comparable to and improved resolution compared to Tc‐99m MDP SPECT/CT, although it may be prone to overdiagnosis in weight‐bearing areas such as the feet, with asymptomatic uptake commonly seen [80]. 18F‐NaF PET/CT can also be used to quantitate regional blood flow and bone remodeling [81]. There is also a correlation between spontaneous osteonecrosis of the knee (SONK) lesion size and SUVmax on 18F‐NaF PET [82]. 18F‐FDG PET/CT and PET/MRI can be useful for the detection of active synovitis, which correlates with pain in OA [83]. However, it is important to not mistake uptake related to osteoarthritis for foci of metastatic disease for patients in whom the PET scan is being performed for a history of malignancy (Figures 21.11 and 21.12). Figure 21.10 64‐year‐old male with a history of rectal carcinoma, also presenting with a known history of ankylosing spondylitis. Axial CT (a) shows fusion of the bilateral sacroiliac joints. A sagittal reformatted series (b) shows bringing anterior syndesmophytes along the visualized thoracolumbar spine, a classic finding in ankylosing spondylitis. 18F‐FDG PET. There is no significant uptake at the fused bilateral sacroiliac joints (yellow arrows) (c, d), suggesting that the patient’s sacroiliac joint disease is in a chronic state. Diabetic patients are at risk for foot infections due to underlying diabetic neuropathy, which leads to a loss of protective sensation and development of anatomic deformities and altered weight‐bearing, and peripheral vascular disease, which limits access of phagocytic cells and antibiotics to infected sites due to impaired circulation [84]. Diabetic patients have an annual and lifetime incidence of foot ulcers of up to 2% and 25%, respectively, and up to one‐third of diabetic foot infections result in osteomyelitis, affecting up to 15% of diabetic patients overall [85]. The total annual cost of diabetic peripheral neuropathy and its complications in the United States is up to $13.7 billion, comprising up to 27% of the direct costs of diabetic care [86]. Timely recognition of diabetic foot osteomyelitis is important to reduce the morbidity of complications, including amputation and dissemination of infection, although the diagnosis can be difficult clinically due to the lack of sensation related to peripheral neuropathy, lack of systemic signs of infection in up to two‐thirds of patients, normal white blood cell (WBC) count in up to half of patients, and the fact that acute neuropathic arthropathy (Charcot joint) can present with findings similar to infection [87]. Anatomic imaging therefore plays a key role in the diagnosis and management of diabetic foot infection. Figure 21.11 72‐year‐old male with a past medical history of melanoma of the right ear pinna. Axial (a) and coronal (b) CT images demonstrate severe right hip joint space narrowing, subchondral cystic changes, and marginal osteophytosis, consistent with osteoarthrosis. Coronal 18F‐FDG PET MIP (c) and CT‐fusion (d) images demonstrate hypermetabolism in this region with related to secondary synovitis (arrows). Care should be taken not to mistake this activity for a melanoma metastasis. Figure 21.12 65‐year‐old male with squamous cell carcinoma of the skin with pulmonary metastases. Axial CT (a) and 18F‐FDG PET (b–d) images of the knees demonstrate two ossific intra‐articular bodies (white arrows) secondary to underlying osteoarthrosis. A focus of hypermetabolism in the region of the tibial origin of the popliteus insertion (blue arrow) was felt to be related to altered biomechanics and muscular tension. Plain radiographs are the appropriate first imaging study for the evaluation of suspected diabetic foot infection, but infection can fester for 10–14 days and up to 30–50% of bone can be destroyed before it is evident radiographically [88–90]. Although MRI is considered the imaging gold standard for the evaluation of diabetic foot osteomyelitis with a sensitivity of 77–100%, underlying fracture, postsurgical changes, and acute neuropathic arthropathy can also cause bone marrow edema that may mimic osteomyelitis, resulting in specificity that varies from 40% to 100% [87]. MRI is also expensive, not universally available, may be limited or nondiagnostic‐related to metal‐susceptibility artifact from implanted hardware or foreign bodies, and some patients may not be able to undergo MRI due to pacemakers or other implantable devices or severe claustrophobia. Nuclear medicine can still play an important role in these patients. Three‐phase bone scintigraphy with 99mTc‐MDP has a sensitivity for diabetic foot osteomyelitis ranging from 69% to 100%, with increased uptake on all three phases, and a normal three‐phase bone scan almost certainly excludes osteomyelitis [91]. However, the specificity is low, with fracture and Charcot foot also demonstrating increased radiotracer uptake on all three phases (Figure 21.13) [92]. Adding a fourth phase to the study 24 hours after radiotracer injection with persistent or more intense osteoblastic activity compared to the 3‐hour scan can increase the overall accuracy to 80–85% for osteomyelitis, although this is rarely done [93]. Figure 21.13 58‐year‐old diabetic male with midfoot cellulitis and ulcer. AP radiograph (a) demonstrates sclerosis and destructive changes of the midfoot, consistent with Charcot (neuropathic) arthropathy with post‐surgical changes. Three‐phase 99mTc‐MDP bone scan (b) demonstrates increased tracer activity in each of the flow, blood pool, and delayed phases, which can be seen with osteomyelitis or Charcot foot. Follow‐up sagittal T1 (c) and STIR (d) MRI images demonstrate normal bone marrow signal intensity despite the underlying destructive changes, including a talar fracture (arrows), compatible with Charcot foot without superimposed osteomyelitis. Figure 21.14 71‐year‐old diabetic male with persistent pain after great toe surgery. AP radiograph (a) demonstrates erosive changes of the first metatarsophalangeal joint. Three‐phase 99mTc‐MDP bone scan (b) demonstrates tracer uptake in the great toe in each of the flow, blood pool, and delayed phases. 111
21
Musculoskeletal Imaging
Relevant Anatomy
Normal Variations
Physiologic Uptake
Pitfalls
Trauma and Activity‐related Uptake
Traumatic Fractures

Stress Injuries
Heterotopic Ossification
Inflammatory Arthritis
Rheumatoid Arthritis
Seronegative Spondyloarthropathies
Spondyloarthropathy
Characteristic findings
Ankylosing spondylitis
Uptake in sacroiliac joints and spine
Occasional asymmetric uptake in shoulders and hips
Psoriatic arthritis
Oligoarticular asymmetric uptake in hands and feet, particularly distal or in ray distribution
Reactive arthritis
Uptake predominantly in the lower limbs and entheses
Inflammatory bowel disease‐related arthritis
Similar to ankylosing spondylitis along with bowel uptake
Degenerative Arthritis
Infection
Diabetic Foot
Related posts:
 Nephro‐urinary Tract Pathologies: A Correlative Imaging Approach
 Imaging in Gliomas: Clinical Principles and Synergies with MRI
 Osteoporosis: Diagnostic Imaging and Value of Multimodality Approach in Differentiating Benign Versus Pathologic Compression Fractures
 Emergency Radiology
 Vascular System
 Infection/Inflammation Imaging
![]()
Stay updated, free articles. Join our Telegram channel

Full access? Get Clinical Tree


