Clinical Examination
All imaging for the evaluation of neurodegenerative diseases must be performed based on a clinical indication. There is currently no role for the use of any imaging modality as a screening examination on normal patients for the evaluation of neurodegenerative diseases. For many purposes, a simple mental status examination may be adequate to identify the presence of cognitive deficits. In more challenging cases, or if it is necessary to more precisely evaluate a patient’s cognitive function, more extensive neuropsychological testing may be performed. A diagnosis of dementia, or neurocognitive disorder as it is now termed in the DSM5 (3), requires the identification of cognitive deficits as well as impairments in the ability of a patient to function arising from those deficits. In recognition of an early phase of many neurodegenerative diseases, a condition of mild cognitive impairment (MCI) has been established. A patient with MCI has deficits in one or more specific cognitive domains, such as memory, language, calculation, executive function, and attention, but is not impaired in the activities of daily living. Clinical examination may reveal a pattern of subtle deficits that may not clearly represent either MCI or neurocognitive disorder, and in this case, the principal question to be addressed is whether or not a patient is normal with respect to brain function.
Imaging
The clinical circumstance is the most important determinant of the appropriate imaging examination for the evaluation of neurodegenerative diseases. MRI, particularly high-resolution T1- and T2-weighted imaging, is the best modality for structural evaluation of the brain parenchyma and provides the most accurate definition of the boundaries between gray and white matter and between brain tissue and cerebrospinal fluid (CSF) spaces, and so are the most useful for the assessment of atrophy. Additional MRI sequences similarly provide the best available characterization of acute infarction (using diffusion-weighted images) and intraparenchymal microhemorrhages (using susceptibility-weighted images). In many circumstances, or if MRI is unavailable, CT may be relied upon for evaluation of the brain structure. CT is capable of revealing patterns of atrophy (4), infarction, and hemorrhage, but with less sensitivity. Image quality is strongly dependent upon the technical parameters applied with both CT and MR imaging, and so, it is not possible to estimate precisely the difference in sensitivity between these modalities. Computational approaches can be applied to many MRI sequences, although this typically requires relatively high-resolution sequences for best results. Quantitative volumetric analysis has been most successfully applied to evaluate patterns of atrophy in both the gray and white matter (5–7). Computational analysis of MRI diffusion tensor imaging provides information regarding white matter structure and integrity (8,9). Perfusion MRI is able to detect changes of neurodegeneration with a sensitivity similar to that of SPECT blood flow scans (10). Functional MRI has been tested extensively in research studies for the evaluation of neurodegenerative diseases and cognitive deficits, although at present, there are no established criteria by which to classify an individual patient as normal or abnormal, and so there are no clinical applications of functional MRI for the evaluation of cognitive deficits at this time.
PET imaging is an important modality for the evaluation of neurodegenerative disease and provides the most sensitive examination available in routine clinical practice. 18F-fluorodeoxy-d-glucose (FDG) uptake provides a functional assessment of metabolic activity in the brain that is a function of gray matter volume as well as synaptic activity, and as such, it is very sensitive to atrophy of cortical and deep gray matter. In addition to visual evaluation, FDG-PET examinations may be analyzed computationally, most commonly by comparing an individual patient’s scan with a normal comparison that is made from an average of many subjects, typically controlled for age and gender. FDG-PET findings are concordant with atrophy on structural brain imaging, and with visual inspection alone, FDG-PET is typically much more sensitive than is visual analysis MRI for the evaluation of cortical atrophy. With quantitative analyses, FDG-PET is similar in sensitivity to quantitative volumetric analysis of brain MRI (11). In the United States, brain FDG-PET has been approved for the differentiation of AD from FTD, and other uses are regarded as off-label.
Since 2012, PET tracers have been approved for detection of brain amyloid, which have application in the evaluation of certain cases in which AD is a diagnostic consideration. Currently, there are three 18F-labeled amyloid PET radiotracers that are available for use in the United States—florbetapir, flutemetamol, and florbetaben—with similar imaging characteristics for each.
There are limited SPECT applications for neurodegenerative diseases. Blood flow can be assessed with blood flow agents such as technetium-99m–hexamethylpropyleneamine oxime (HMPAO) and technetium-99m ethyl cysteinate dimer (ECD), although this is a relatively insensitive measure of neurodegeneration and atrophy. Given the much greater sensitivity and clinical utility of FDG-PET, cerebral blood flow SPECT is generally useful only when PET is unavailable. Presynaptic dopamine transporters can be imaged with SPECT using ioflupane, and this examination can be useful in the evaluation of atypical parkinsonian syndromes.
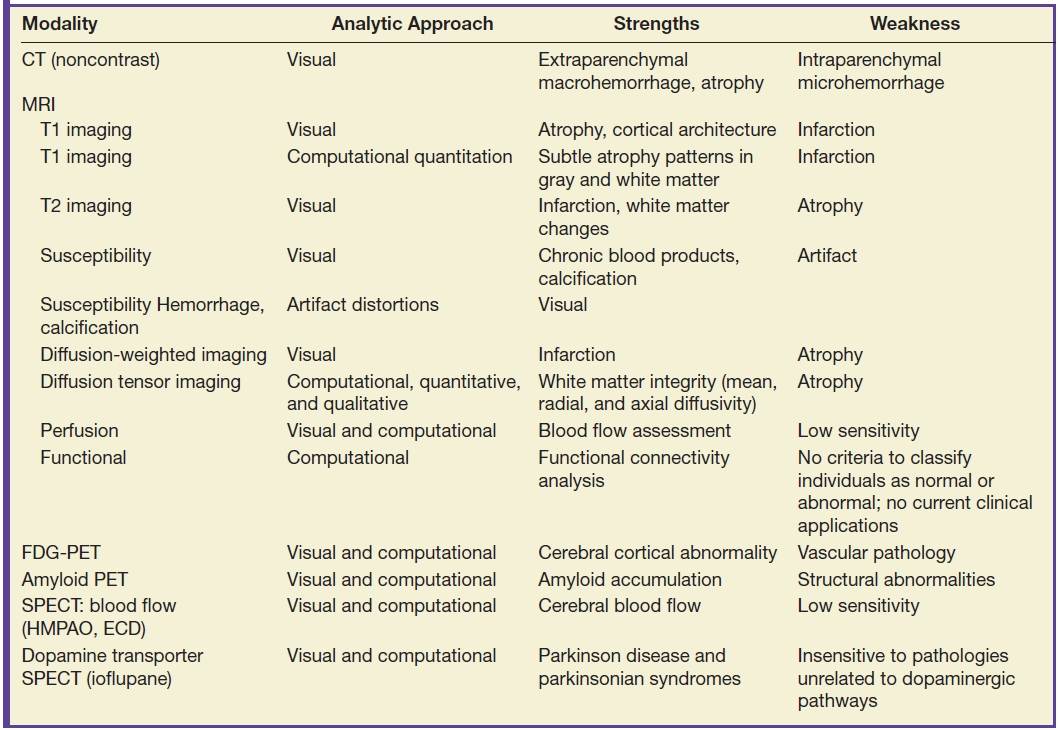
The most useful imaging modalities for the evaluation of neurodegenerative diseases are summarized in Table 7.2.
Table 7.2 IMAGING MODALITIES FOR THE EVALUATION OF NEURODEGENERATIVE DISEASES
Normal Brain Aging
Frequently, the most important diagnostic determination for both clinical and imaging examinations is the distinction between normal and abnormal. In the absence of a dominant pattern of atrophy or a structural lesion such as tumor, hemorrhage, or hydrocephalus, this distinction can be extremely challenging. There is a pattern of brain parenchymal volume loss that occurs with aging that involves the entire brain diffusely, although varying slightly in degree depending on location (12–14). While in a strict sense this atrophy is not normal, as the brain is not perfectly preserved, in another sense, it is typical of what is seen in the population.
In addition to aging, diffuse brain parenchymal volume loss is associated with a large number of other conditions. Among the more common are those that relate at least in part to lifestyle factors such as diabetes and elevated cholesterol level (15). Other factors associated with diffuse brain parenchymal volume loss include chronic diseases such as liver failure, renal insufficiency, heart failure, and pulmonary disease. Cancer and its treatments such as chemotherapy and radiation therapy to the brain are also strongly associated with diffuse brain atrophy. Figure 7.1 depicts two different patients of similar age, one with a brain that is within normal limits for age as well as a brain with diffuse brain parenchymal volume loss.
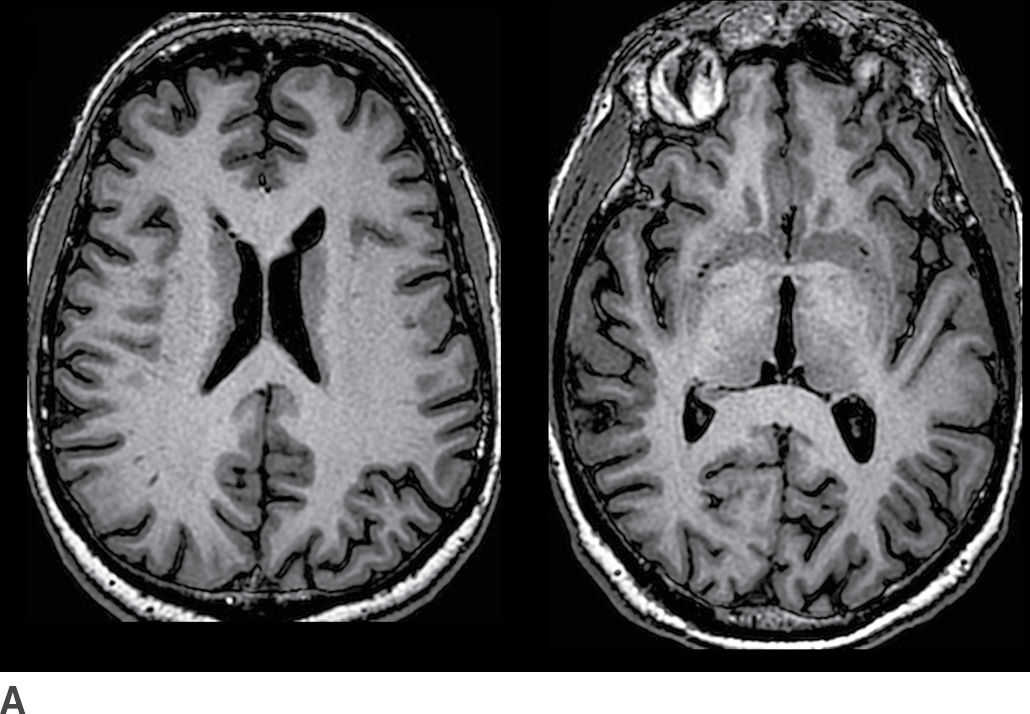
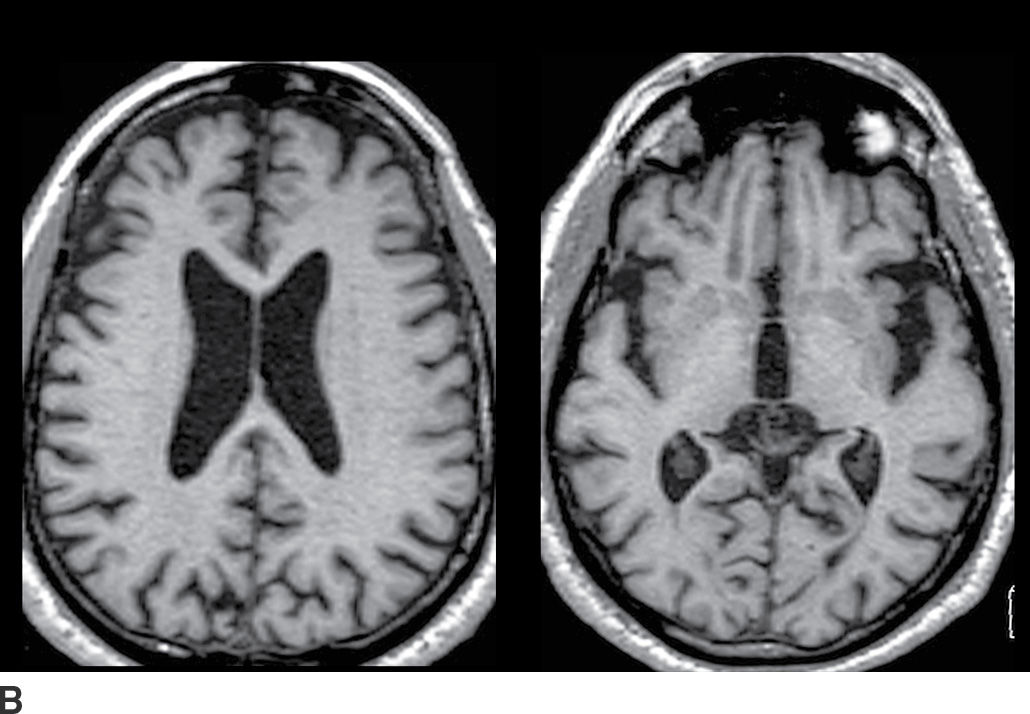
FIG. 7.1 Axial T1-weighted images from cognitively normal patients. A: This 73-year-old patient’s brain has minimal parenchymal volume loss and is reasonably considered within normal limits. B: This 72-year-old patient had long-standing diabetes and emphysema, and the brain demonstrates mild diffuse brain parenchymal volume loss. There is proportional prominence of the ventricles, sulci, and cisterns with no definite regional pattern of atrophy.
Distinguishing a pattern of normal age-related brain parenchymal volume loss from accelerated and abnormal atrophy can be challenging. Automated segmentation and quantitative analysis of gray and white matter volumes can provide more sensitive and accurate determination of patterns of regional atrophy than visual inspection, as shown in Figure 7.2. For many clinical purposes, visual assessment is adequate to determine if the brain volume is within normal limits. Visual rating scales have been developed to assess patterns of atrophy although there can be considerable variation between observers in their application (16,17).
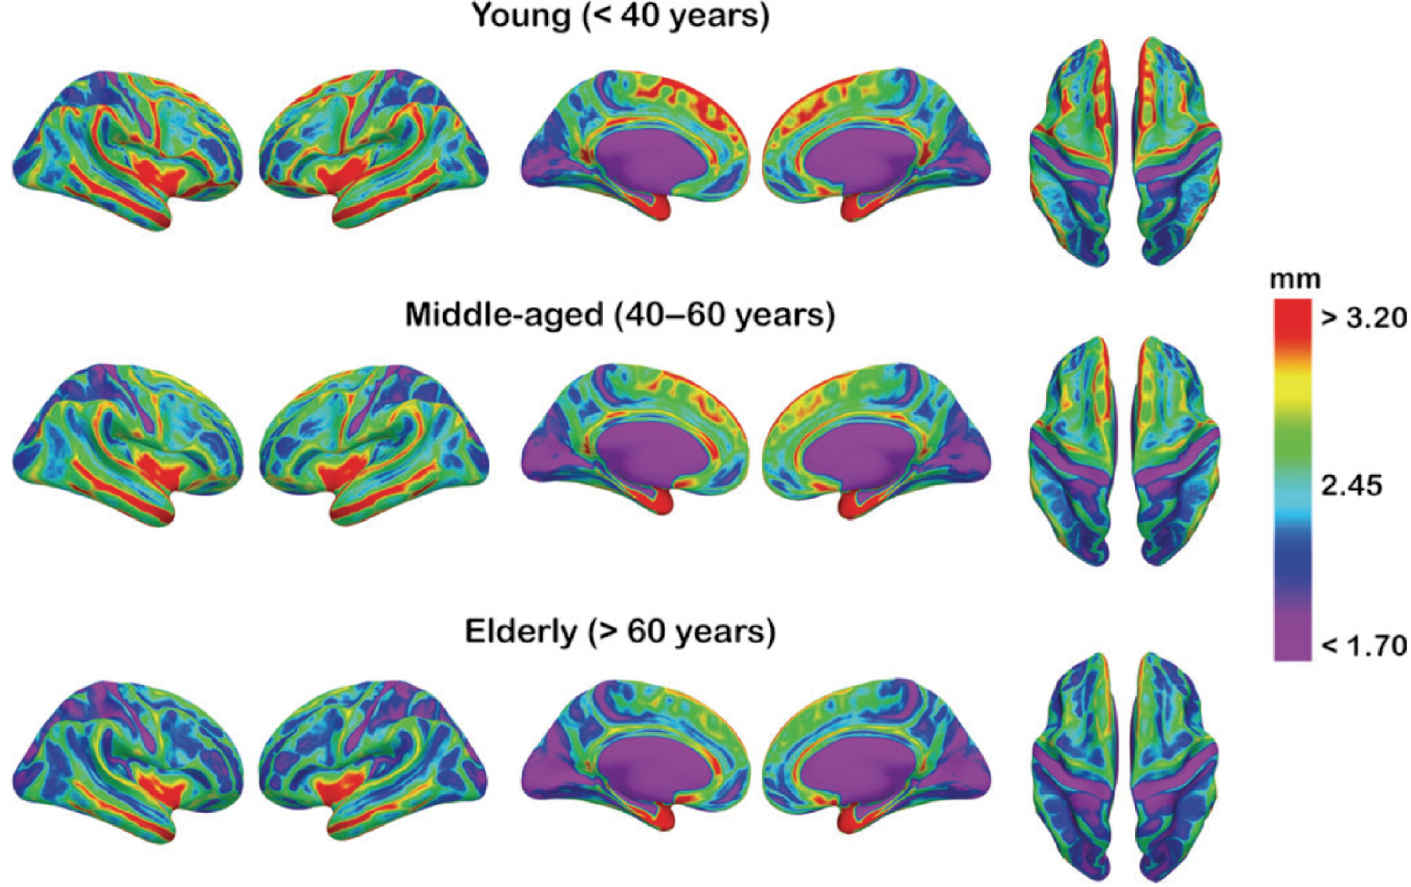
FIG. 7.2 Mean cortical thickness for three age groups is depicted onto a partially inflated brain template, allowing better visualization of sulci. A color-coded scale corresponding to cortical thickness is depicted on the right.
(Reproduced from Fjell AM, Westlye LT, Amlien I, et al. High consistency of regional cortical thinning in aging across multiple samples. Cereb Cortex. 2009;19(9):2001–2012, with permission of Oxford University Press.)
Hydrocephalus
Ventricular enlargement often reflects a degree of brain parenchymal volume loss. However, it is important to assess for alternative causes of ventriculomegaly, particularly hydrocephalus. Hydrocephalus may be due to obstruction of normal pathways of CSF flow such as at the cerebral aqueduct (termed obstructive hydrocephalus), or, more common in the elderly, impaired resorption of CSF from the subdural space (termed communicating hydrocephalus). Features that can help to distinguish hydrocephalus from atrophy are the callosal angle (18,19), transependymal CSF flow, squaring of the gyri abutting the calvarium, partially empty sella, increased fluid along the optic nerves, and elevation of the optic disk. Figure 7.3 depicts examples of diffuse brain parenchymal volume loss and hydrocephalus for comparison.
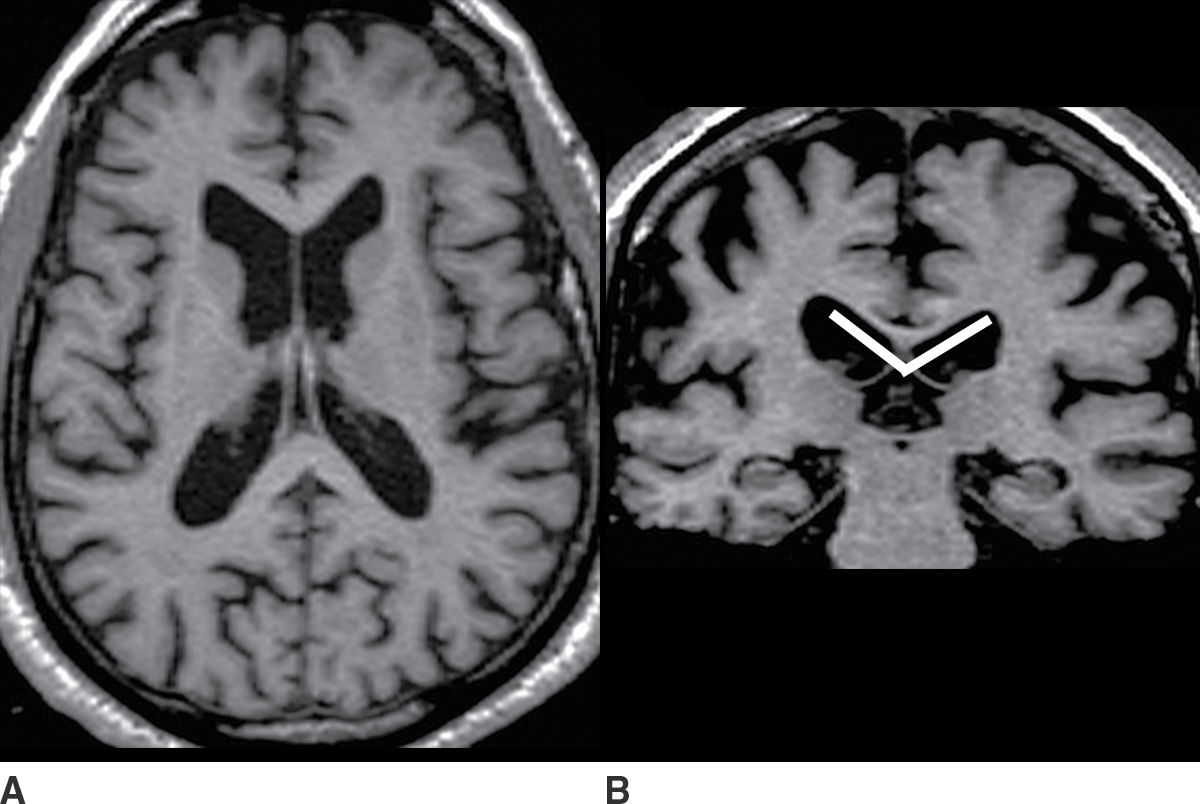
FIG. 7.3 A,B: Axial and coronal T1-weighted images, respectively, of a patient with diffuse brain parenchymal volume loss. C,D: Axial and coronal CT images, respectively, of a patient with a diagnosis of hydrocephalus established by clinical and imaging criteria. Features of hydrocephalus are disproportionate prominence of the ventricles relative to the sulci; acute callosal angle, measured at the level of the posterior commissure (indicated by lines on the coronal images); periventricular hypodensity consistent with transependymal CSF flow; and rounding of the horns of the lateral ventricles (indicated by arrows). These findings are apparent on CT, although the brain parenchyma is more accurately depicted with MRI.
Since not all of the features of hydrocephalus are reliably present, the distinction between hydrocephalus and atrophy can be difficult. Also, long-standing hydrocephalus itself can result in accelerated brain atrophy.
Alzheimer Disease
AD is a heterogeneous spectrum of neurodegenerative diseases that is fundamentally related to abnormal amyloid accumulation in the brain. The principal neuropathologies of AD are diffuse and neuritic extracellular plaques containing β-amyloid and intracellular neurofibrillary tangles containing hyperphosphorylated tau. While these pathologic changes are well characterized, the underlying etiology remains unknown. AD is the most common cause of both late-onset and early-onset dementia, representing approximately 70% and 42% of these conditions, respectively (20,21). In the population over 85 years of age, approximately one-third meet criteria for AD, and among individuals over 95 years of age, the prevalence of AD approaches 50%.
There are several variant Alzheimer syndromes with significant differences related to age of onset (early or late) and dominant areas of brain involvement and associated cognitive deficits; mixed phenotypes are common. The most common AD syndrome presents with memory deficits predominating and, to a lesser degree, deficits in language, executive function, and visuospatial orientation. The areas of greatest brain abnormality are quite variable between patients, but temporal and parietal lobe predominance is typical. Asymmetry is common and even usual, with a moderate majority of left cerebral hemisphere predominance. Some of the variant Alzheimer subtypes have a predominance of specific neuropathology (22). Several Alzheimer phenotypes are summarized in Table 7.3.
Table 7.3 ALZHEIMER PHENOTYPES
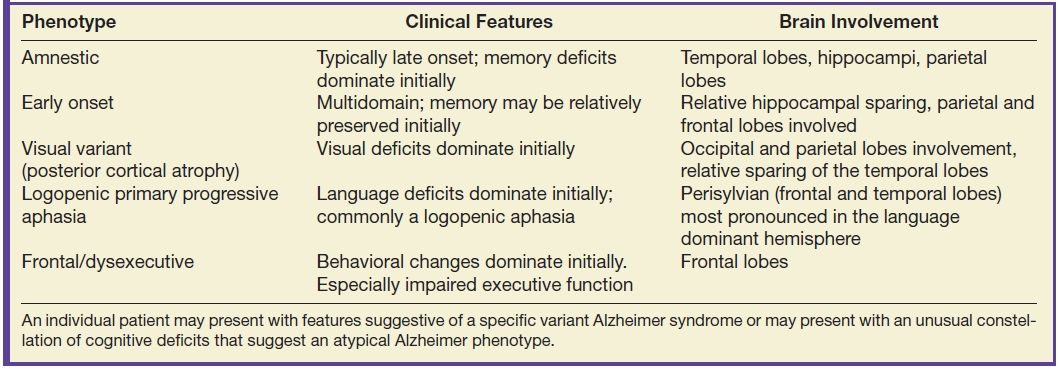
An individual patient may present with features suggestive of a specific variant Alzheimer syndrome or may present with an unusual constellation of cognitive deficits that suggest an atypical Alzheimer phenotype.
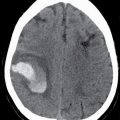
The most common pattern of neurodegeneration in AD initially involves the medial temporal lobes and is most evident in the hippocampi. Atrophy progresses to involve paralimbic and association neocortex, particularly within the temporal and parietal lobes. Within the temporal lobes, the pattern of atrophy is more pronounced posteriorly. Within the parietal lobes, the atrophy is more pronounced inferiorly including the posterior cingulate gyrus and precuneus regions and evolves to become contiguous with the temporal lobe abnormality as the disease progresses. The structural biomarkers that correlate best with AD and progression of AD pathology are total brain volume and hippocampal volume. A pattern that is typical of AD is diffuse brain parenchymal volume loss as well as hippocampal atrophy that is disproportionately greater than the diffuse brain parenchymal volume loss, as shown in Figure 7.4.
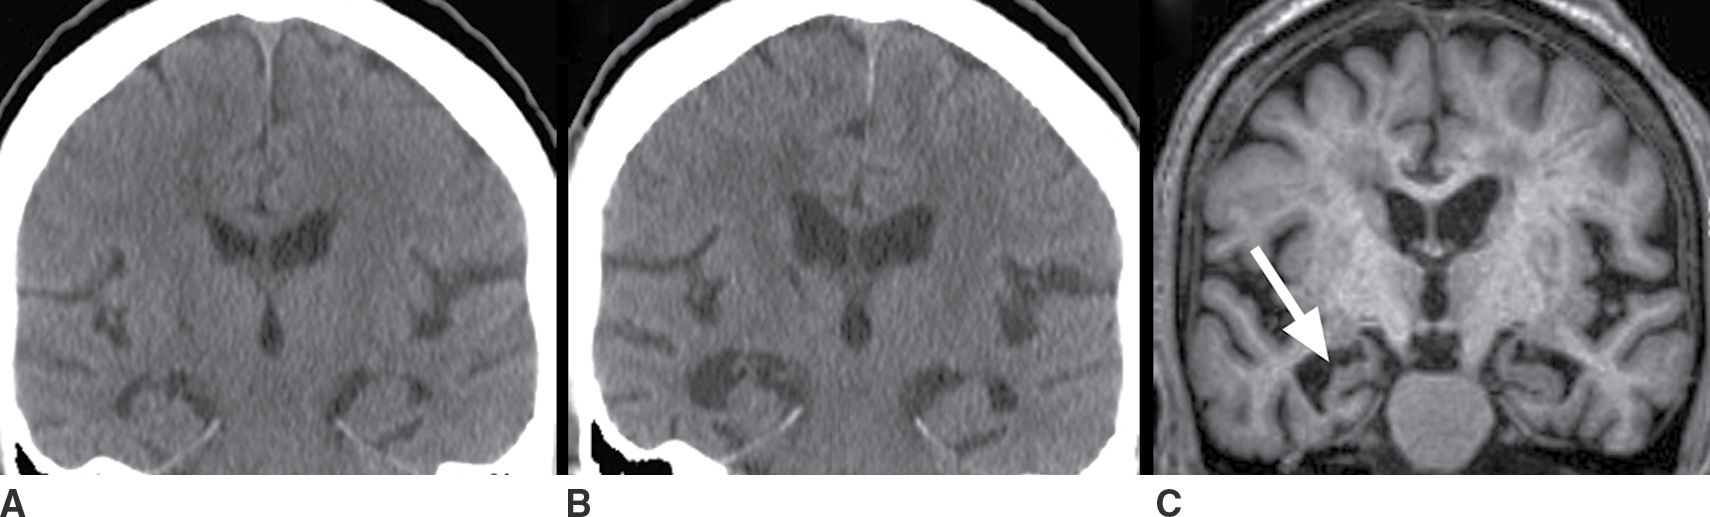
FIG. 7.4 Alzheimer disease. A: Coronal image from a head CT obtained at age 67 for reasons unrelated to cognitive deficits. Coronal images from a head CT (B) and T1-weighted MRI (C), both obtained 5 years later, at age 72. Both show diffuse brain parenchymal volume loss (note the increased size of the ventricles and sulci) and disproportionately greater hippocampal atrophy that is asymmetrically more pronounced on the right than the left (arrow in C). Comparison of (B) and (C) demonstrates the increased tissue definition available with MRI and, in particular, the greater delineation of the gyri and sulci, which contributes to the greater sensitivity of MRI for the detection of atrophy.
FDG-PET is extremely useful for the evaluation of AD, including assessment of whether or not there is a neurodegenerative process and whether that process is likely to be AD. As shown in Figure 7.5, the FDG-PET may show a large abnormality even when the MRI (or CT) shows little or no atrophy.
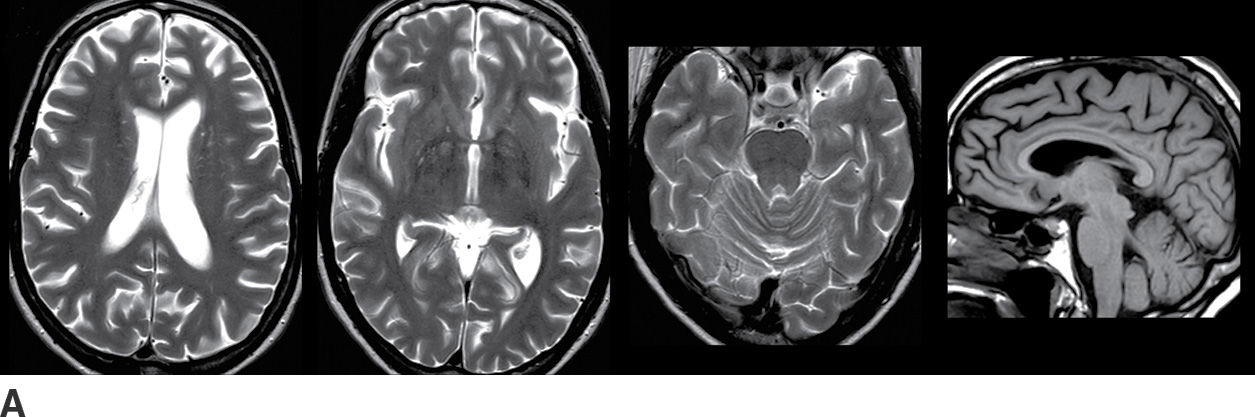
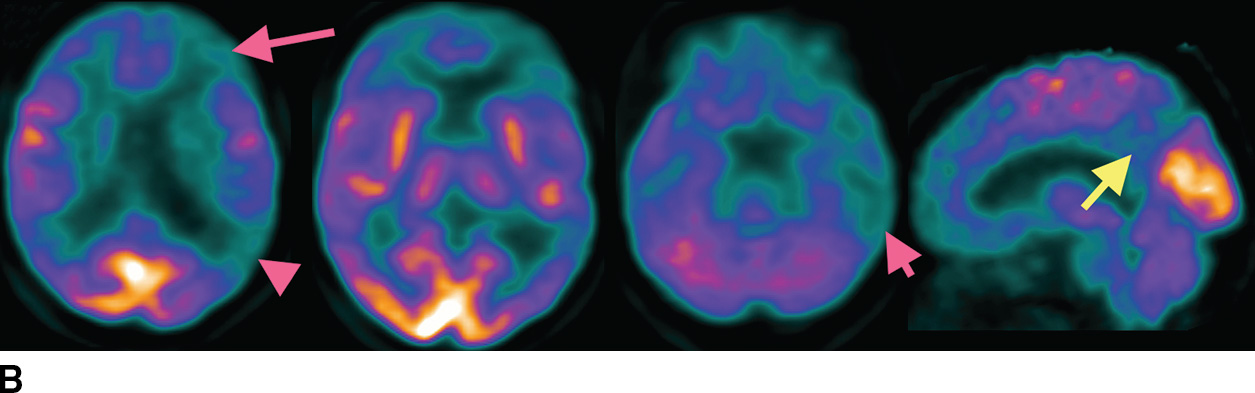
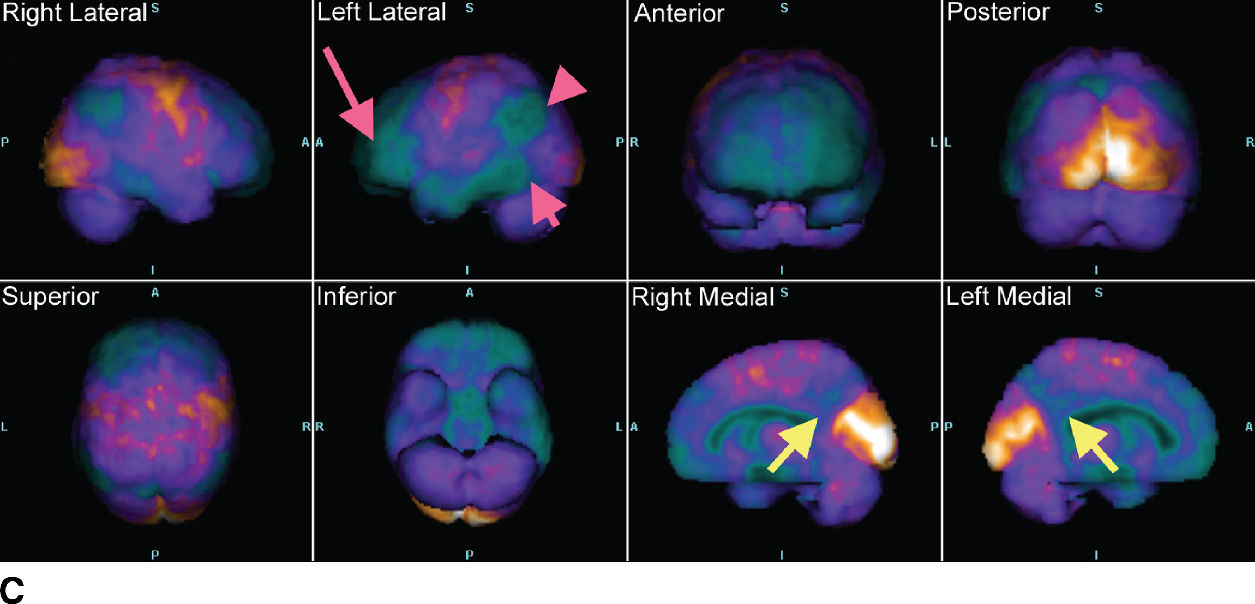
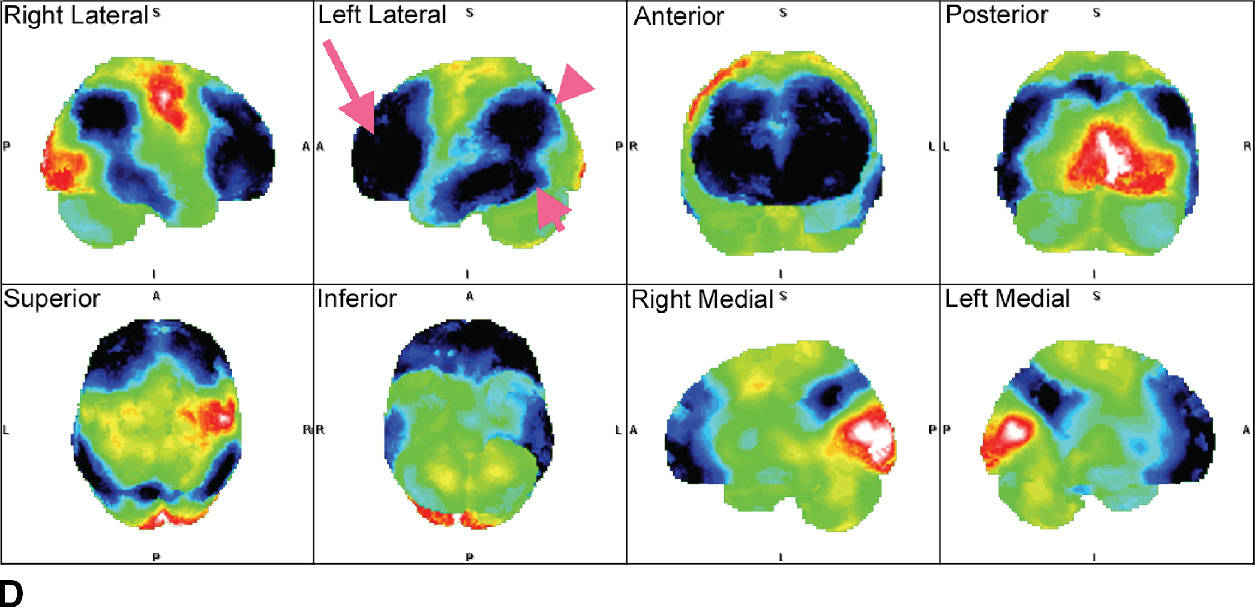
FIG. 7.5 Alzheimer disease. A: Axial T2-weighted images and a sagittal T1-weighted image, with very subtle atrophy that is not easily recognized as an AD pattern. B: Axial slices and a sagittal slice from an FDG-PET, approximately corresponding to the MR images above. There is marked cerebral cortical hypometabolism that is most pronounced in the inferior parietal (fuschia arrowhead) and posterior temporal lobes (fuschia short arrow) and markedly involving the frontal lobes (fuschia long arrow). The abnormality is much more pronounced in the left cerebral hemisphere than the right. The sagittal views demonstrate the prominent involvement of the posterior cingulate and precuneus regions (yellow arrows). C: 3D smoothed cortical surface projection of the FDG-PET scan from the same patient, demonstrating the pattern of hypometabolism throughout the brain. D: Cortical projection of a Z-score statistical map of the patient’s FDG uptake pattern relative to a normal comparison, with darker shades indicating hypometabolism. The relative hyperintensity seen in the occipital lobes and perirolandic regions is an artifact of whole-brain normalization of the PET data.
The variant Alzheimer syndromes are associated with patterns of neurodegeneration, evident as atrophy on structural metabolism and hypometabolism on FDG-PET, that are often typically with the clinical phenotype. For example, visual variant AD (VVA), also known as posterior cortical atrophy (PCA), is typified by neurodegeneration in the occipital and parietal lobes and often comes to clinical attention due to decrease in visual acuity, as with the patient depicted in Figure 7.6. PCA may be asymmetric, and the visual deficits typically correspond to the extent and degree of the cortical abnormality. The imaging appearance of PCA overlaps significantly with Lewy body pathology, and clinical findings are essential to establishing an appropriate diagnosis.
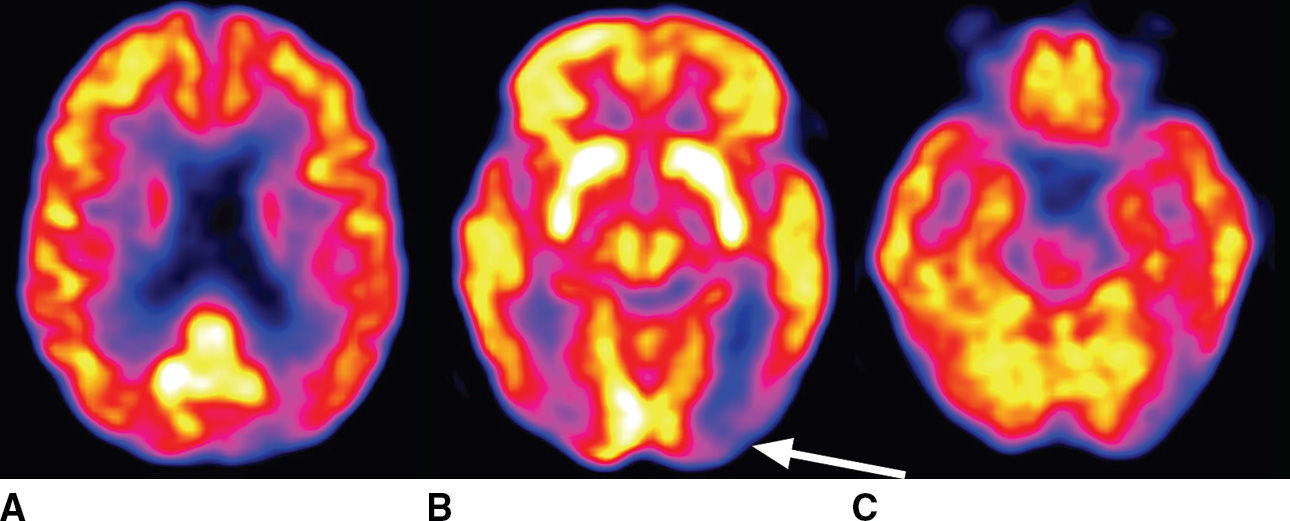
FIG. 7.6 Posterior cortical atrophy (visual variant AD). A 72-year-old woman presents with decreased visual acuity that is most pronounced in the right visual fields. Axial FDG-PET images shown here demonstrate marked cortical hypometabolism that is most pronounced in the occipital lobes and much more pronounced in the left cerebral hemisphere than the right. There is milder involvement of the parietal and frontal lobes and minimal involvement in the left temporal lobe. The arrow indicates the dominant abnormality in the left occipital lobe. Lewy body pathology could be considered in the differential diagnosis of this imaging appearance, although the clinical circumstance would be significantly different.
Similar to PCA, logopenic primary progressive aphasia is seen clinically as a syndrome of worsening expressive aphasia. In the majority of cases, this is associated with abnormal β-amyloid deposition in the prefrontal and temporoparietal cortices and is reasonably considered a variant Alzheimer syndrome (23). In a minority of cases, this may be a result of a frontotemporal lobar degeneration (FTLD), and the pattern of atrophy and FDG-PET findings alone may be unable to distinguish these possibilities.
In cases in which knowledge of the presence or absence of amyloid may make a significant difference in clinical management, amyloid PET may be useful. Specific criteria have been published to help guide the appropriate use of amyloid PET scans (24,25). Amyloid PET may be most useful in patients with an unusual presentation of cognitive deficits in which AD is a possible diagnosis. In contrast, it is advised that amyloid PET should not be performed as a screening examination in cognitively normal patients, as a substantial proportion of older patients have a significant burden of cerebral amyloid and yet may not develop AD. Also, amyloid PET is not recommended for patients for whom the most likely diagnosis is AD. Examples of positive and negative amyloid PET scans are shown in Figure 7.7.
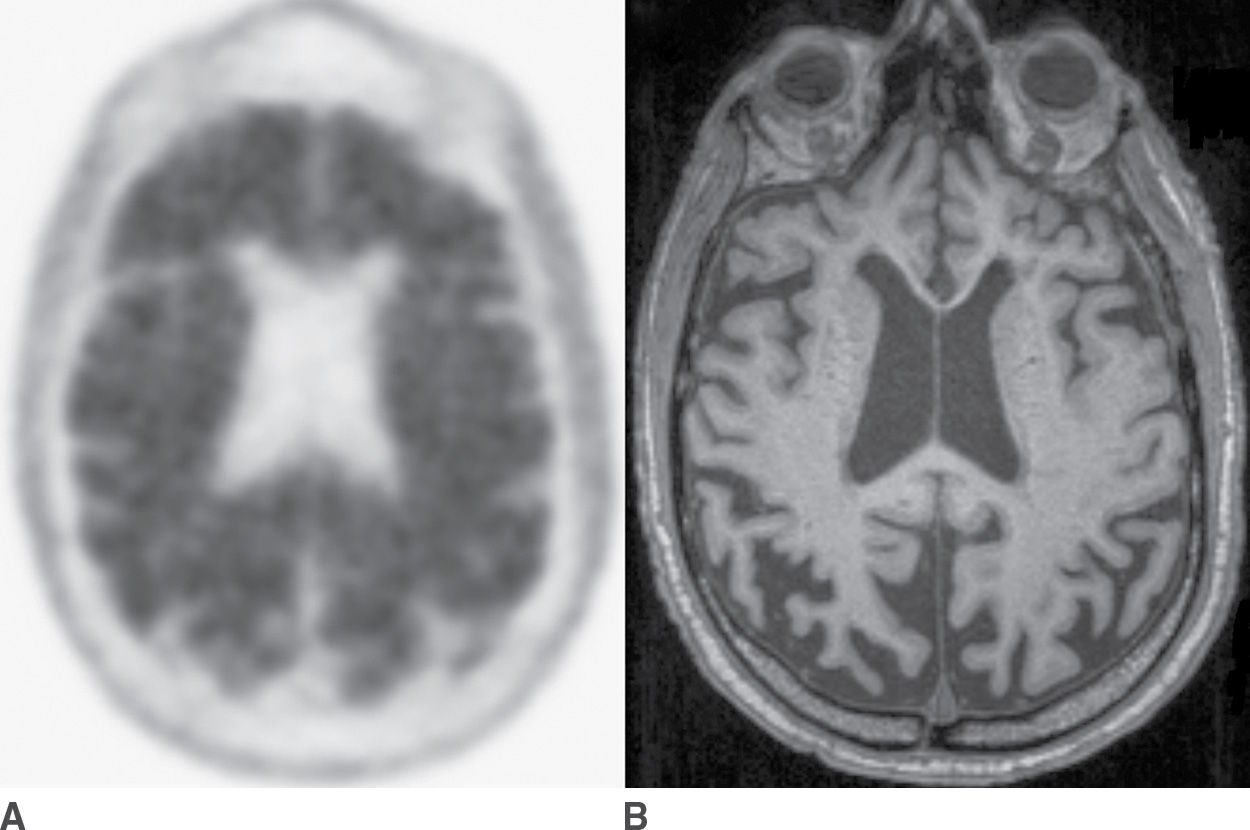
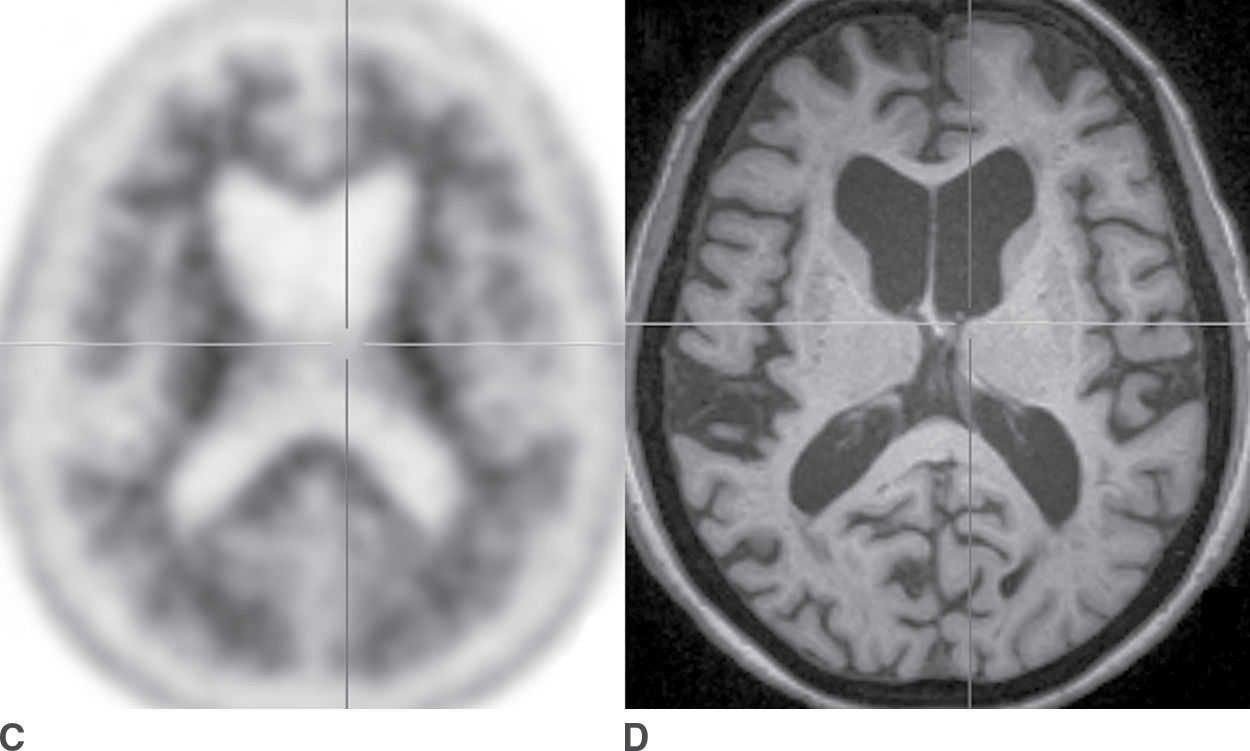
FIG. 7.7 Amyloid PET scans. A: Florbetapir PET scan positive for amyloid, corresponding to abundant neuritic plaques, in a patient with a clinical syndrome of dementia of Alzheimer type. B: Corresponding axial T1-weighted MR image, which shows marked atrophy that is more pronounced in the parietal lobes compared to the frontal lobes. C: Florbetapir PET scan that is negative for amyloid, corresponding to few or no neuritic plaques, a finding that is not supportive of a diagnosis of Alzheimer disease. D: The corresponding axial T1-weighted MR image shows diffuse atrophy without a regional predominance.
Cerebral amyloid angiopathy (CAA) is characterized by abnormal accumulation of β-amyloid within the cerebral vasculature. The principal imaging findings of CAA are intraparenchymal microhemorrhages (“microbleeds”), most commonly in a lobar cerebral distribution, as opposed to the deep cerebral and brainstem distribution typical of hypertensive microbleeds. The association of CAA and AD has been reported from 80% to 98% (26), and the distribution of microbleeds in AD is biased to the occipital and parietal lobes (27). Consequently, the presence of microbleeds, which is most sensitively assessed with susceptibility-weighted MR images, may favor the diagnosis of AD, particularly when found in an occipital and parietal distribution.
Dementia with Lewy Bodies
Lewy bodies are defined by the presence of abnormal intraneuronal filamentous protein inclusions containing α-synuclein. They may be found within neurons of the central and peripheral nervous systems and are associated with a broad spectrum of neurodegenerative diseases, including Parkinson disease (PD) and Parkinson-plus syndromes. As with β-amyloid, the extent and quantity of Lewy bodies do not correlate precisely with neurodegeneration, and so, the mechanisms of Lewy body neuropathology remain poorly understood. Lewy body pathology giving rise to dementia with Lewy bodies (DLB) and Parkinson disease with dementia together constitute the second most frequent cause of neurodegenerative dementia. These entities account for approximately 10% to 15% of dementia cases, representing a prevalence in the population over age 65 of approximately 1%. The clinical features of DLB include fluctuating cognitive deficits, hallucinations (most commonly visual), and parkinsonian motor deficits. Other findings supportive of diagnosis of DLB are REM sleep disorder, psychosis, and dysautonomia.
Structural imaging findings in DLB are frequently subtle, particularly in the early stages. Functional abnormality in the occipital cortex is not strongly represented by atrophy, and instead, a subtle pattern of diffuse brain parenchymal volume loss may be seen. FDG-PET provides a much more sensitive evaluation and typically reveals hypometabolism that is most pronounced in the occipital and parietal lobes (Fig. 7.8). It is reported that a majority of patients with DLB are also positive for amyloid, with a variable distribution although in many respects similar to an AD pattern of brain amyloid (28).
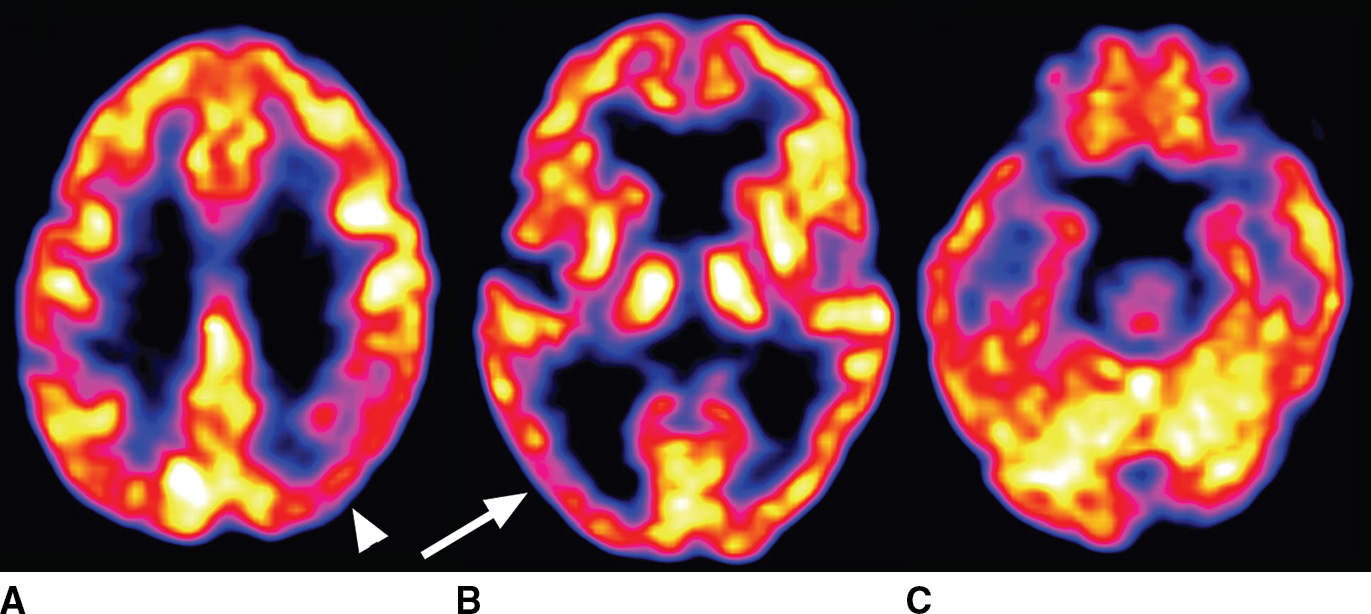
FIG. 7.8 Lewy body disease seen on FDG-PET. Asymmetric cortical hypometabolism is most pronounced in the occipital (arrow in B) and parietal (arrowhead in A) lobes, with relative sparing of the frontal and temporal lobes.
Related posts:
Stay updated, free articles. Join our Telegram channel

Full access? Get Clinical Tree


