Fig. 10.1
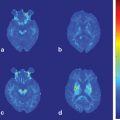
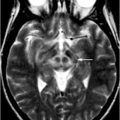
Neuromelanin-sensitive magnetic resonance imaging of the substantia nigra and locus ceruleus (LC). a, b Two-dimensional (2D) fast spin-echo (FSE) images obtained at 3 T; c, d three-dimensional (3D) spoiled gradient-echo (GRE) images with magnetization transfer contrast pulse at 3 T; a, c: axial sections at the level of the midbrain; b, d axial sections at the level of the upper pons. Neuromelanin-sensitive images obtained by either 2D-FSE or 3D-GRE techniques clearly depict the high-signal areas at locations that correlate well with the locations of the substantia nigra pars compacta (a, c; arrows) and LC (b, d; arrows). On the 3D-GRE image, a punctate hyperintense area is seen at the midline of the midbrain tegmentum, indicating the ventral tegmental area (c, arrowhead)
Table 10.1
Scan parameters of neuromelanin-sensitive T1-weighted imaging
MRI sequence | Fast spin-echo |
Repetition time (TR) | 600 ms |
Effective echo time (TE) | 14 ms |
Slice thickness | 2.5 mm |
Interslice gap | 1.0 mm |
Number of slices | 10 |
Field of view (FOV) | 22 cm |
Matrix size | 512 x 320 |
Echo trains | 2 |
Number of excitations | 8 |
Acquisition time | 12 min |
T1-Weighted Three-Dimensional Gradient Echo Imaging with Magnetization Transfer Contrast
Neuromelanin-sensitive 2D-FSE T1WI has several limitations such as relatively low spatial resolution, long acquisition time, limited coverage, and signal nonuniformity due to B1 heterogeneity [1]. These technical issues can cause substantial errors in the qualitative and quantitative assessment of the signal alterations in the SNc and LC in Parkinson disease and other related disorders.
Three-dimensional (3D) spoiled GRE technique with MTC pulse, also used for source imaging in magnetic resonance angiography, is sensitive to neuromelanin-related contrast [3]. This technique can obtain high-resolution volume images with minimal signal inhomogeneity during a short acquisition (< 10 min) and can overcome the limitations of the 2D-FSE technique (Fig. 10.1c, d). In addition, this method can be used for visualizing the SNc and LC at both 3 and 1.5 T [3].
Normal Image Findings of Neuromelanin-Containing Nuclei
Substantia Nigra
Axial neuromelanin-sensitive images show distinct band-like high-signal areas in the posteromedial part of the crus cerebri, mainly at the level of the lower midbrain (see Fig. 10.1a) [1, 11]. Horizontal and vertical distributions of the hyperintense areas correspond well with that of neuromelanin-containing neurons in gross specimens, but are substantially different from the distribution of low-signal-intensity areas on T2-weighted images and gray matter signal areas on proton-density-weighted or short inversion–time inversion recovery images [11]. Thus, compared with other structural imaging techniques, neuromelanin-sensitive MRI is more appropriate for direct assessment of the SNc. Sometimes, 3D-GRE images show a punctate hyperintense area at the midline of the midbrain tegmentum, indicating dopaminergic neurons of the ventral tegmental area (see Fig. 10.1c).
Locus Ceruleus (LC)
The LC is one of the gray matter structures that are “invisible” on conventional MRI but can be visualized as a pair of rod-shaped hyperintense areas along the lateral edge of the fourth ventricle floor in the upper pontine tegmentum by using neuromelanin-sensitive imaging techniques (see Fig. 10.1b, d) [1, 11]. Distribution of the hyperintense areas is identical to that of the LC in gross specimens [10]. In addition, rostrocaudal variations in the signal intensity have been reported to be closely related to the variations in the number of the neuromelanin-containing neurons [12], suggesting that the degree of signal intensity can reflect neuronal number and/or intraneuronal neuromelanin content.
Neuromelanin-Sensitive Imaging for Evaluating the Changes that Occur in Neurodegenerative Diseases
Idiopathic Parkinson Disease (iPD)
Neuromelanin-sensitive imaging techniques have been mainly utilized for evaluating the pathological changes in the SNc or LC of patients with iPD, because conventional MRI techniques fail to detect significant changes related to the principal pathological changes in iPD, i.e., neuronal depletion of the SNc and LC [11, 13]. Several studies have shown significant signal attenuation and/or volume reduction of hyperintense SNc areas on neuromelanin-sensitive images of iPD patients, indicating degeneration of dopaminergic neurons (Fig. 10.2b) [1, 2, 14]. In addition, such changes were more pronounced in the later stages than in the early stages of the disease, reflecting pathological progression of iPD [2]. Significant signal decrease in the LC areas was also seen in iPD (see Fig. 10.2d) [1]. Thus, neuromelanin-sensitive MRI can be used to visualize degenerative changes in the neuromelanin-containing neurons occurring in iPD. However, the performance of neuromelanin-sensitive MRI in terms of early and differential diagnoses is not known and should be evaluated in further investigations.
< div class='tao-gold-member'>
Only gold members can continue reading. Log In or Register to continue
Stay updated, free articles. Join our Telegram channel

Full access? Get Clinical Tree


