Type of infarct
Clinical description
Lacunar
Acute stroke that includes one of the major recognized lacunar syndromes: (1) pure motor, (2) pure sensory, (3) sensorimotor, (4) ataxic hemiparesis, (5) dysarthria (clumsy hand syndrome)
Total anterior circulation
Ischemia in both deep and superficial territories of the middle cerebral artery characterized by higher cerebral dysfunctions such as dysphasia, dyscalculia, visuospatial disorder, homonymous visual field defects, ipsilateral motor, and/or sensory deficit of at least two areas of the face, arm, and leg
Partial anterior circulation
Clinical syndrome includes only two of the three aforementioned components, with higher cerebral dysfunction alone or with more restricted sensorimotor deficits than those classified as lacunar infarcts
Posterior circulation
Ipsilateral cranial nerve palsy with contralateral motor and/or sensory deficit, bilateral motor and/or sensory deficit, disorder of conjugate eye movement, cerebellar dysfunction without ipsilateral long-tract deficit, or isolated homonymous visual defect
In 1993, a multicenter clinical trial known as TOAST, or Trial of ORG 10172 in Acute Stroke Treatment, classified ischemic strokes based on their respective causative mechanisms: (1) large-vessel atherosclerotic disease, (2) small-vessel atherosclerotic disease, (3) cardioembolism, (4) other determined etiologies, and (5) undetermined of multiple possible etiologies (Table 2) [4, 5].
In this chapter, the etiologies of ischemic stroke, characteristic imaging patterns associated with the evolution of ischemic strokes, and stroke categories based on causative mechanisms will be reviewed.
Etiologies of Ischemic Strokes
Large-vessel disease is the culprit in approximately 13 % of all patients who present with first-time strokes [6]. Caused by atherosclerotic debris and ulceration, large-vessel disease is defined as occlusion or stenosis of greater than 50 % of a major brain artery or branch cortical artery. Large-vessel atherosclerosis leads to infarction when there is hemodynamically significant narrowing, which is defined as a decrease in vessel lumen diameter by 50–70 % [7]. In such cases, however, it is also possible for blood flow to be preserved in the setting of collateral circulation involving the circle of Willis and leptomeningeal vessels. Conversely, complete internal carotid artery (ICA) occlusion in the neck may still cause cerebral infarctions in the setting of emboli, which may be multiple and simultaneous or focally broken up to produce multiple infarctions.
While 35 % of patients over the age of 50 have atherosclerotic changes in their cervical arteries, only one third will have symptomatic vascular disease [7]. Dissection of the carotid or vertebral artery should always be considered as a cause of stroke in young otherwise healthy patients. Ischemic infarction typically occurs as a result of distal embolization from a cervical dissection rather than occlusion and typically manifests on imaging several hours to days after the onset of the dissection, although may also be delayed for several weeks.
Cardioembolism is the principal cause of ischemic cerebrovascular disease. Cardiogenic embolism is responsible for approximately 15–27 % of first-time strokes [6]. High and medium risk sources of cardioembolism are summarized in Table 3. In those with large infarcts without ICA occlusion, the frequency of cardioembolic disease is higher than in large infarcts with ICA occlusion or limited infarcts without ICA occlusion [8]. The incidence of cardioembolism is greater in patients below the age of 45, presumably due to a lower rate of atherosclerotic disease in this younger age group. Cardioembolic ischemic stroke is the most common subtype associated with recurrent strokes and is associated with the highest 1-month mortality and in-hospital mortality in comparison to other subtypes [9, 10].
High risk | Mechanical prosthetic valve |
Mitral stenosis with atrial fibrillation | |
Atrial fibrillation | |
Left atrial/atrial appendage thrombus | |
Sick sinus syndrome | |
Recent myocardial infarction (<4 weeks) | |
Left ventricular thrombus | |
Dilated cardiomyopathy | |
Akinetic left ventricular segment | |
Atrial myxoma | |
Infective endocarditis | |
Medium risk | Mitral valve prolapse |
Mitral annulus calcification | |
Mitral stenosis without atrial fibrillation | |
Left atrial turbulence | |
Atrial septal aneurysm | |
Patent foramen ovale | |
Atrial flutter | |
Lone atrial fibrillation | |
Bioprosthetic cardiac valve | |
Nonbacterial thrombotic endocarditis | |
Congestive heart failure | |
Hypokinetic left ventricular segment | |
Myocardial infarction (>4 weeks, <6 months) |
Approximately 16 % of ischemic strokes are associated with atrial fibrillation and 10 % are probably secondary to atrial appendage embolism [11, 12]. On brain imaging, large cortical territorial infarction is suggestive of a cardioembolic mechanism, especially if the patient does not have ICA occlusion. Although simultaneous acute infarctions are generally attributed to cardioembolism, the majority of cases are generally not caused by a proximal embolus from the heart or aortic arch, but rather by artery-to-artery embolism or fragmentation of a proximal artery embolus [7]. The median volume of infarcts secondary to cardiogenic embolism is greater than twice that of infarcts caused by artery-to-artery embolism [13].
Although uncommon, acute stroke caused by fat emboli is potentially life threatening. Acute ischemia in the presence of long bone or pelvic fractures, cardiac surgery, or joint replacement therapy should raise concern for fat embolism. Fat emboli from epicardial or bone marrow fat can pass through pulmonary capillaries without shunting lesions and result in systemic embolization, commonly to the brain. Patients typically present with the clinical triad of hypoxia, altered mental status, and petechiae. Other signs that may be present include tachycardia, fever, anemia, and thrombocytopenia.
Small-vessel occlusion is characterized by one of the traditional lacunar syndromes without evidence of cerebral or cortical dysfunction and is the cause of 25 % of all first-ever strokes [6]. Lacunes are thought to occur most often in patients with hypertension or diabetes [14]. In addition to atherosclerosis and lipohyalinosis, other potential causes of small-vessel occlusion include vasculopathy, artery-to-artery or cardiogenic embolism, arterial dissection, and hypercoagulability-associated thrombosis [15]. In patients with their first lacunar stroke, vascular imaging of the cervical and intracranial arteries for a cardiac source of embolism is indicated.
Only 2 % of strokes are classified in the “other etiology” category [6]. Strokes of other determined causes include non-atherosclerotic vasculopathies, hypercoagulable states, and hematologic disorders, whereas strokes with negative or incomplete evaluations, or as a result of two or more causes, are labeled strokes of undetermined cause.
Anoxic and hypoxic brain injuries occur when there is decreased oxygen content in the blood. Anoxia results from near-complete absence of oxygen in the blood for more than 5 min, while hypoxia occurs when there is partial but more prolonged hypoxemia [7]. Anoxia can occur after cardiac arrest, prolonged seizures, strangulation/hanging, near drowning, and smoke/carbon monoxide inhalation. Carbon monoxide poisoning produces anoxic injury by preventing oxygen from binding to hemoglobin. General sites of the brain susceptible to ischemia are those with increased metabolic rate and a paucity of redundant blood supply, including the hippocampus, globus pallidus (in particular in carbon monoxide poisoning), amygdala, cerebellum, and occipital lobes, in decreasing order of frequency.
Imaging Findings Associated with Ischemic Strokes
Brain imaging can accurately localize an ischemic stroke lesion to a specific vascular distribution [16, 17]. Identification of occlusion or stenosis of extracranial and/or intracranial arteries can delineate the ischemic nature of a lesion and help determine its etiology – for example, whether it occurs as a consequence of slow flow, proximal embolic occlusion, or small-vessel disease.
CT and MRI findings change rapidly throughout the initial week after an infarct due to the underlying pathophysiologic changes taking place. Although CT is extremely useful for detecting large ischemic infarcts of more than 6–8 h in duration, it does not reliably reveal infarcts of less than 4 h in duration or optimally characterize the extent of such infarctions. The goals of CT in the acute setting include exclusion of intracranial hemorrhage or involvement of greater than 33 % of the distribution of the middle cerebral artery (MCA) territory, which would preclude thrombolytic therapy, identification of any early features of infarction, and exclusion of other intracranial pathologies that may mimic a stroke, such as a tumor.
CT Findings
Within the first few hours of an ischemic stroke, imaging features on CT include loss of gray–white matter differentiation and loss of the ability to differentiate the basal ganglia or thalamus from the internal capsule. Mass effect is typically absent. Areas of cortex with poor collateral blood supply, such as the insular ribbon (Fig. 1) are more vulnerable to ischemia [18] and should be carefully inspected to detect early loss of gray–white matter differentiation. The basal ganglia should also be scrutinized for findings associated with hyperacute stroke; relative hypodensity in the lentiform nucleus (with loss of contrast difference to the adjacent white matter in the internal capsule) can be seen in 75 % of patients at 3 h [18] (Fig. 2). The dense vessel sign reflective of acute embolic occlusion can sometimes be seen on unenhanced CT and is helpful in the setting of normal-appearing acutely infarcted parenchyma. Evaluation of CT angiogram source images may make acute infarction more apparent because of absent or decreased enhancement of hypoperfused gray matter (Fig. 3).
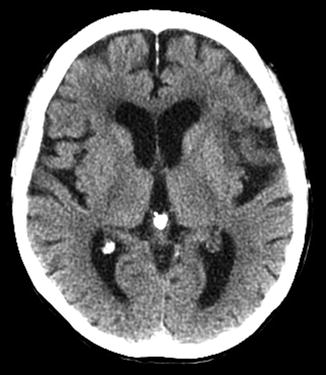
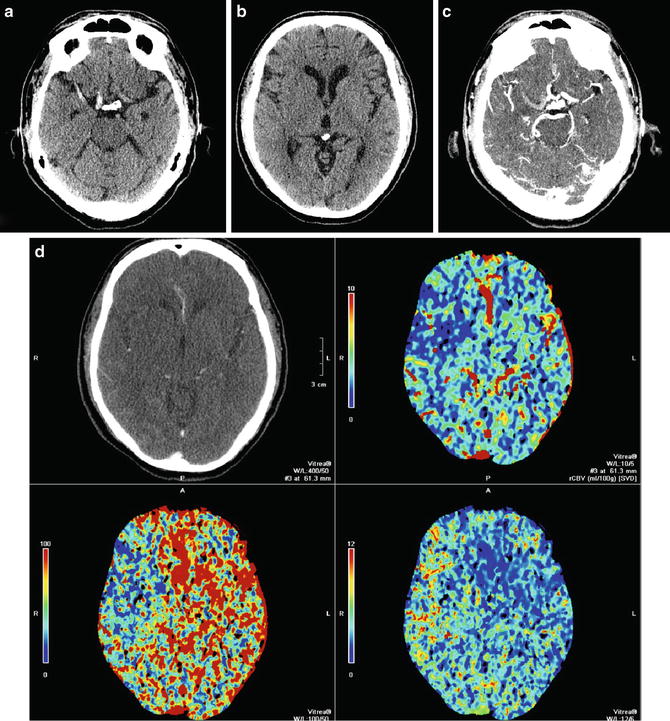
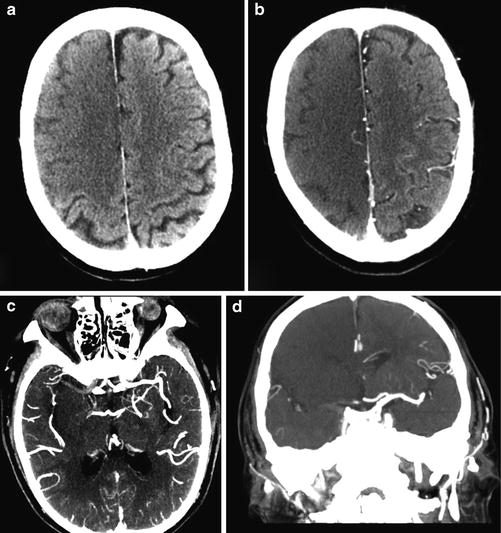
Fig. 1
Hyperacute M2/M3 MCA distribution infarct; insular ribbon sign. Axial CT of the brain demonstrates marked hyperdensity in the frontal and temporal lobes along the insular ribbon and cortex, consistent with acute MCA distribution infarction
Fig. 2
Hyperacute MCA infarct. (a) Axial CT of the brain demonstrates a dense distal right internal carotid artery and M1 portion of the MCA, a sign of acute thrombus. Note the normal less dense left MCA. (b) A more superior image demonstrates loss of normal gray matter density in the entire right MCA distribution. Note the relative hypodensity of the left and right sides of the ganglia and cortex. (c) The corresponding axial CTA of the brain demonstrates a filling defect in the distal right internal carotid artery and M1 segment of middle cerebral artery due to acute thrombosis. Note the normally enhancing patent left MCA and normal enhancement of right M2 branches is consistent with collateral supply. (d) CT perfusion demonstrates decreased CBF and CBV and increased MTT corresponding to the subtle hypoattenuation seen on non-contrast CT. There is no mismatch
Fig. 3
MCA/ACA distribution hyperacute infarction. (a) Unenhanced CT in a patient with atrial fibrillation demonstrates subtle loss of normal gray matter density involving lateral (MCA) and medial (ACA) frontal cortex. (b) On source images loss of normal cortical gray density is more apparent, reflecting decreased blood volume in the region of infarction. Axial (c) and coronal (d) MIP CTA images demonstrate lack of enhancement of the A1 and M1 segments of the right MCA, indicative of acute thrombus and loss of normal cortical density in the MCA and ACA distributions. Note the presence of filling of some right M2 and A2 branches due to collateral supply from the posterior circulation
Over the first week, hypoattenuation and edema associated with ischemia progressively increase. In the case of a large infarct, substantial mass effect is typical, often causing secondary damage to other areas of the brain, such as in cases of herniation (Fig. 4). Contrast-enhanced scans may demonstrate parenchymal enhancement, which is typically gyriform in cases of cortical infarction. Approximately one week after the onset of cerebral infarction, the swelling starts to subside and there are new cortical petechial hemorrhages and/or hyperemia, which result in elevation of cortical attenuation (pseudonormalization). In such cases, imaging of a stroke at this time can be misleading as the affected cortex will appear normal, known as the “CT fogging phenomenon.” Administration of contrast will demonstrate gyriform enhancement of the “fogged” infarct area and can thus be performed to prevent misinterpretation [19] (Fig. 5). Over the weeks and months that follow, infarction gliosis sets in, which appears as a region of low density with focal volume loss (atrophy), such as in the case of ex vacuo dilatation of the ventricles and associated encephalomalacia (Fig. 6). Cortical mineralization or laminar necrosis may also occur, appearing as curvilinear hyperdensities following gyral anatomy.
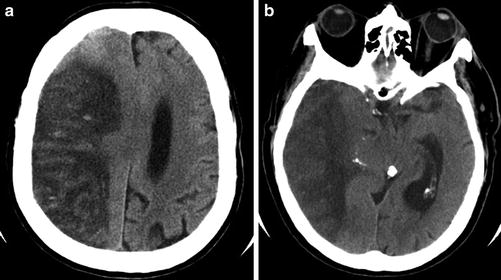
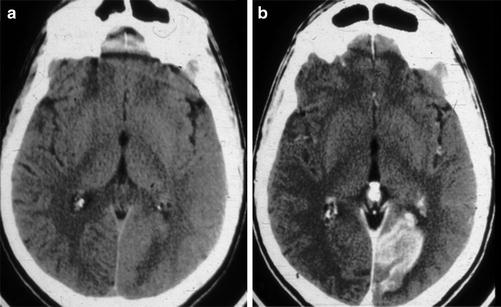
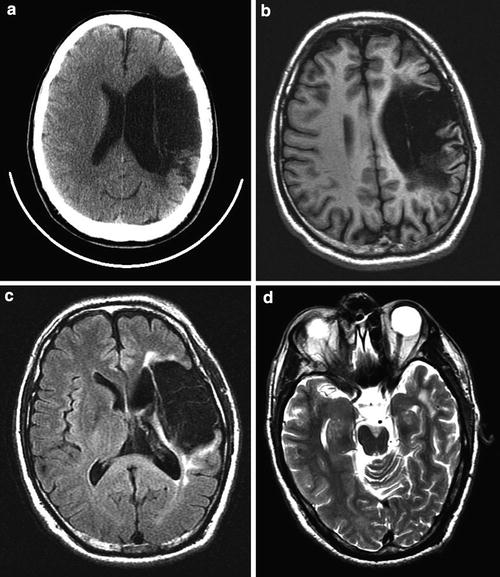
Fig. 4
Subacute “malignant” MCA infarct. (a) Axial CT of the brain 3 days after an acute MCA territory stroke demonstrates marked hypodensity and mass effect with uncal herniation, as a result of increased vasogenic edema and intracranial pressure. (b) Image at the level of the lateral ventricle demonstrates marked hypodensity with transfalcine herniation. Punctate foci of hyperdensity and mild gyriform hyperdensity within the infarct are consistent with a combination of reperfusion hemorrhage and hyperemia
Fig. 5
Subacute PCA P3 distribution infarct. (a) Axial unenhanced CT of the brain in a patient with a subacute PCA territory occipital lobe stroke, which appears isodense to normal gray matter due to hyperemia and/or laminar necrosis. (b) Contrast-enhanced axial CT of the brain demonstrated gyriform enhancement that confirms that non-enhanced CT of the brain demonstrated the “fogging phenomenon”
Fig. 6
Chronic M2/M3 distribution infarct with cystic encephalomalacia. (a) Axial CT scan demonstrates marked hypodensity in the left MCA distribution with ex vacuo dilatation of the left lateral ventricle. (b) T1-weighted and (c) FLAIR images demonstrate that this region is fluid-filled consistent with cystic encephalomalacia. (d) T2-weighted image at the level of the mesencephalon demonstrates marked atrophy of the cerebral peduncle consistent with Wallerian degeneration
Perfusion CT is superior in detecting the presence and extent of possible acute strokes that are inconspicuous on unenhanced CT. It has emerged as a critical tool for the selection of patients optimal for reperfusion therapy, as it can identify the penumbra surrounding the core of an infarct, which is the region that is ischemic but has not yet undergone permanent infarction and may thus be possibly salvaged. The parameters associated with cerebral hemodynamics include cerebral blood flow (CBF), which represents instantaneous capillary flow in tissue; cerebral blood volume (CBV), which describes the blood volume of the cerebral capillaries and venules per cerebral tissue volume; the mean transit time (MTT), which measures the length of time a certain volume of blood spends in the cerebral capillary circulation; and the time to peak (TTP), which is inversely related to CBF in that reduction of blood flow results in an increase in the time needed for contrast to reach its peak in the perfused volume of brain tissue. These parameters are linked by the central volume principle which state that CBF = CBV/MTT. Specifically, areas which demonstrate matched defects in CBV or CBF and MTT represent unsalvageable infarct core, whereas those with prolonged MTT but preserved CBV are considered to be the ischemic penumbra [20]. Recently the value of perfusion imaging in determining success of stroke intervention has come into question [21], leading some investigators to state that, given the importance of time to treatment, a non-contrast head CT is all that is needed to make a therapeutic decision [22] (Fig. 2).
CT angiography (CTA) is utilized to identify possible thrombus within an intracranial vessel and guide intra-arterial thrombolysis or clot retrieval. CTA can also be applied to the carotid and vertebral arteries in the neck to establish stroke etiology, such as atherosclerosis or carotid dissection, and identify any possible endovascular treatment access limitations, such as arterial tortuosity or stenosis (Figs. 2 and 3).
MRI Findings
The acuity or chronicity of a stroke is better elucidated on MRI than CT due to different time-sensitive signal characteristics. The typical MRI findings that may help determine the relative ages of cerebral infarcts are displayed in Table 4. MRI is a much more sensitive modality than CT in the identification of hyperacute infarction (<6 h) [23]. In the first 3 h after infarction, CT does not typically demonstrate any parenchymal abnormalities [23, 24]. T2-weighted fluid attenuation inversion recovery (FLAIR) sequences are also relatively insensitive during this hyperacute period (and are less sensitive than CT in the 3–6 h range) but the overall sensitivity of MR is 82 % in the first 24 h, whereas detection rates for acute infarction on CT are 58 % in the first 24 h [25]. Even more impressive is the 99 % sensitivity rate of diffusion-weighted imaging (DWI), associated with detection of an ischemic stroke within 12 h of its onset (including the first 1 h), in contradistinction to the 39 % sensitivity rate associated with CT [26]. In addition, causes of stroke such as venous thrombosis, vascular malformations, infections, and tumors are better identified and characterized with greater accuracy on MRI than is possible with CT.
Table 4
Stages of ischemic stroke and their respective appearances on MRI
Stage | Timing | T1WI | T2WI/FLAIR | DWI | ADC |
|---|---|---|---|---|---|
Hyperacute | 0–6 h | Isointense, possible loss of sulci | Isointense to mildly hyperintense | Hyperintense | Hypointense |
Acute | 6 h–4 days | Hypointense, mass effect | Hyperintense | Hyperintense | Hypointense |
Subacute | 4–14 days | Hypointense | Hyperintense | Mildly hyperintense from T2 shine through | Isointense |
Chronic | >14 days | Smaller area of hypointensity, encephalomalacia | Hyperintense | Isointense | Hyperintense |
Described as the “light bulb sign,” hyperintensity associated with acute infarction usually occurs within 3 h and is easily detected on DWI [7] (Figs. 7 and 8). This marked hyperintensity is initially due to diffusion restriction in the area of cerebral ischemia. Cytotoxic edema occurs as a result of depletion of adenosine triphosphate, which in turn leads to breakdown of normal cell membrane integrity. As a consequence, there is intracellular swelling and damage to intracellular proteins causing increased intracellular viscosity. These processes are indicators of cell death. After 4–6 h T2 increases within the area of infarction due to vasogenic edema. Restricted diffusion can be assessed independent of T2 by evaluating apparent diffusion coefficient (ADC) maps. Restricted diffusion usually peaks at around 3 days and disappears by 5–10 days (pseudonormalization) [27, 28]. Thereafter diffusion increases in the area of infarction due to removal of dead cells and development of gliosis. Diffusion restriction and increased T2 combine to produce hyperintensity on DWI images that lasts for up to 2 weeks after infarction. In circumstances where diffusion is equal to normal brain but T2 is increased, such as in the case of a subacute infarction, the tissue will appear bright on DWI and isointense on apparent diffusion coefficient (ADC) maps, a phenomenon known as T2 shine through (Fig. 9).
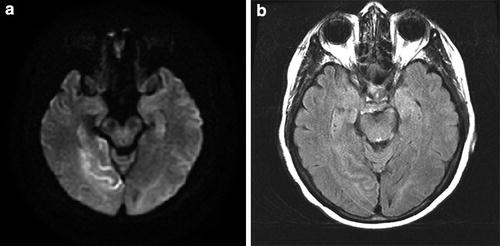
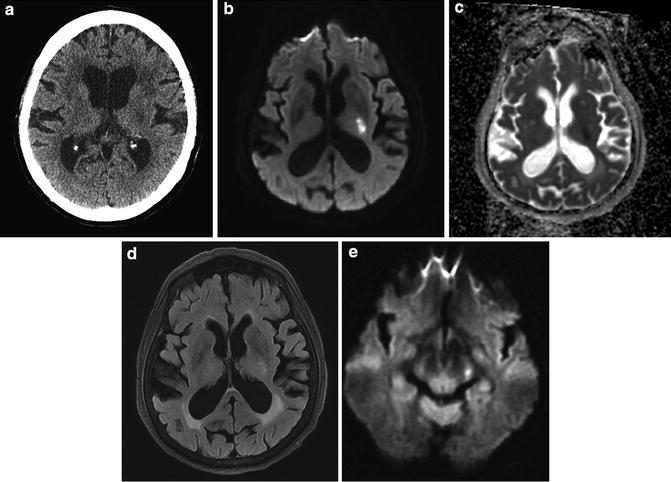
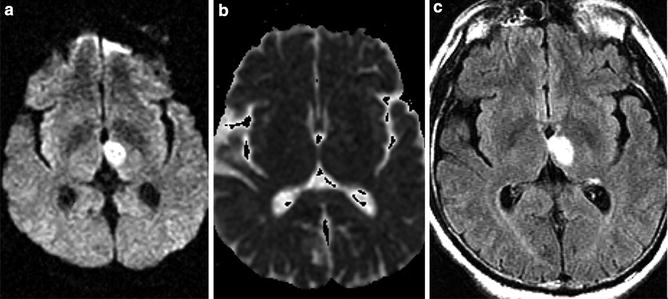
Fig. 7
Hyperacute PCA P2 distribution infarct on MR (<4 h); FLAIR/DWI mismatch. (a) Hyperintensity on DWI and (b) relative isointensity on FLAIR in the occipital lobe and hippocampus. The presence of the diffusion-FLAIR mismatch has been proposed as an indicator of hyperacute infarction when the clinical timing of infarction is uncertain (e.g., “wake-up strokes”). In many of these cases, CT will be positive before FLAIR
Fig. 8
Acute infarct internal capsule – anterior choroidal distribution. (a) CT reveals ill-defined hypodensity in left posterior limb of internal capsule consistent with infarct of indeterminate age. (b) DWI reveals marked hyperintensity. (c) ADC map reveals hypointensity indicative restricted diffusion. (d) FLAIR reveals subtle hyperintensity indicative of acute infarct. (e) DWI at the level of the cerebral peduncle reveals hyperintensity indicative of acute Wallerian degeneration
Fig. 9
Subacute thalamic infarct – T2 shine through. (a) Axial DWI MRI of the brain demonstrates hyperintensity in the medial thalamus imparting mild mass on the third ventricle. (b) ADC map demonstrates absence of hypointensity indicative of T2 shine through and not restricted diffusion. (c) FLAIR MRI demonstrates marked hyperintensity corresponding to region of hyperintensity on DWI sequence
DWI nearly doubles the likelihood of detecting acute ischemic strokes compared to FLAIR [29]. Although T2-weighted imaging and FLAIR are less sensitive in detecting parenchymal change in the first few hours, loss of normal flow voids in large arteries may be visible immediately [30]. The MRI correlate of the early CT dense vessel sign in acute embolic occlusion is intraluminal hypointensity without associated flow-related hyperintensity on gradient echo or susceptibility-weighted images. Normally, large vessels are centrally hypointense with associated hyperintensity adjacent to the vessel due to signal from spatially displaced blood secondary to flow effects. In the presence of acute clot, however, there is marked hypointensity that often extends beyond the lumen of the vessel, referred to as “blooming,” and there is no corresponding flow-related hyperintensity [7] (Fig. 10).
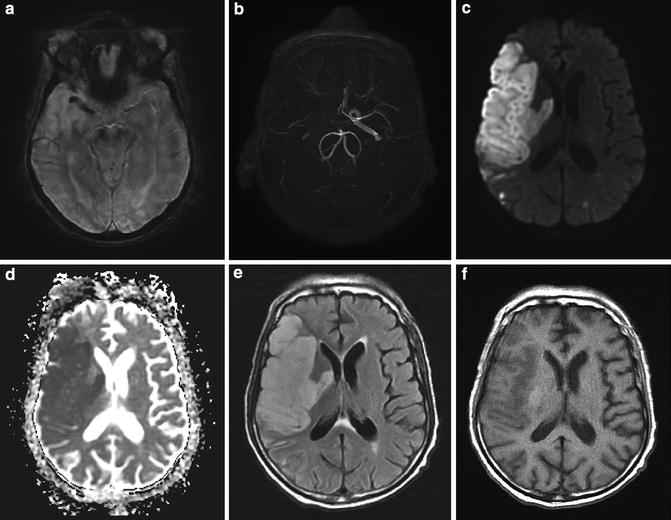
Fig. 10
Subacute deep and superficial MCA infarct secondary to carotid occlusion. (a) SWI image demonstrates hypointensity in the M1 segment of the right MCA. Note the normal hyperintense flow effects within the left MCA. (b) MRA reveals absence of flow in the distal right internal carotid artery and MCA. (c) DWI reveals marked hyperintensity. (d) ADC reveals marked restricted diffusion. (e) FLAIR reveals hyperintensity and mass effect in the entire right MCA distribution consistent with infarct of 2–3 days duration. (f) T1 reveals mild cortical hypointensity and mass effect with gyral swelling and sulcal obliteration. These findings are typical for an infarct after 3–5 days
Hyperacute infarction is T1 isointense and T2 isointense to mildly hypertense, which is best appreciated on FLAIR and is usually confined to the gray matter in cases of thromboembolic infarction. It typically takes 4–5 h for hyperintensity to develop on FLAIR, which is actually less sensitive than CT in the 3–6 h period [7]. The presence of restricted diffusion and normal signal on FLAIR (diffusion-FLAIR mismatch) may potentially be used to determine the onset of infarction in patients in whom the time on onset is unknown (referred to as “wake-up” stroke), potentially allowing for therapeutic intervention in these individuals [31] (Fig. 7).
After 6–12 h, infarcted tissue becomes high signal on T2-weighted images, while low intensity on T1-weighted images typically mirrors this high T2/FLAIR signal. In thromboembolic infarcts, T2 hyperintensity is confined to the gray matter. Although the extent and degree of T2 hyperintensity increase during the acute phase of infarction, the extent of the DWI abnormality remains relatively unchanged (unless there has been interval progression of the infarct) (Fig. 10). In 50 % of cases, contrast enhancement can be seen [2]. Enhancement can be intra-arterial due to slow flow, in which case it can be seen at the time of vascular occlusion. Subsequently transient leptomeningeal enhancement may occur and usually resolves by the end of the first week. Parenchymal enhancement due to blood–brain barrier damage and ingrowth of new immature vessels may occur by the end of the first week and last for several weeks [2].
Blood flow to the affected portion of the brain is typically reestablished 24–72 h after infarction, during the early subacute phase. By day 3 or 4, new ingrowth of immature vessels with more permeable blood–brain barriers result in increased vasogenic edema, which is extracellular swelling caused by leakage of fluid out of capillaries. In large infarcts, mass effect typically peaks at around 5 days and can lead to transfalcine or transtentorial herniation. Infarcted brain is mildly T1 hypointense and markedly T2 hyperintense, involving both gray and white matters with ill-defined margins. Intensity on DWI and ADC maps is variable at this stage, reflecting the degree of cytotoxic edema (decreased ADC) and vasogenic edema (increased ADC) (Figs. 10 and 11). If the infarct involves the corticospinal tract, Wallerian degeneration may occur and manifest as mild T2 hyperintensity and restricted diffusion acutely (Fig. 8). In such cases, signal abnormality will be present in the ipsilateral cerebral peduncle and pons and should not be mistaken for an additional area of infarction. In chronic infarcts Wallerian degeneration is manifested by volume loss in the ipsilateral cerebral peduncle without signal abnormality (Fig. 6d).
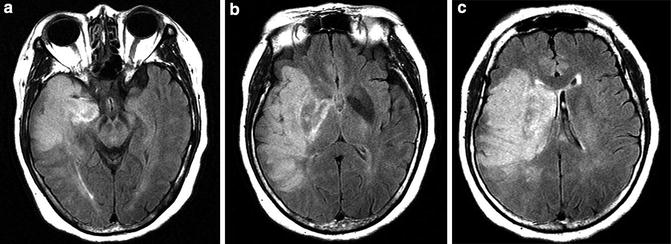
Fig. 11
Malignant MCA infarct MR. (a–c) FLAIR images reveal an infarct involving the majority of the deep and superficial distributions of the MCA. Note the marked mass effect with early medial displacement of the uncus (a) and mass effect upon and displacement of the lateral ventricle (b and c)
Within 5–14 days, DWI demonstrates isointensity to mild hyperintensity, while ADC maps display hyperintensity reflective of increased diffusion [7] (Fig. 9). T1 hypointensity and T2 hyperintensity persist into the late subacute and chronic healing phases. Cortical laminar necrosis may be visualized as a ribbon of intrinsic T1 hyperintensity and is usually apparent after 2 weeks [2] (Fig. 12). Cystic encephalomalacia and lacunar infarcts appear as central regions of T1 hypointensity, T2 hyperintensity, and FLAIR hypointensity (similar to spinal fluid intensity) surrounded by T2 hyperintensity and are best seen on FLAIR imaging (Fig. 6). On DWI, chronic infarction is isointense to mildly hypointense, while the infarct appears hyperintense on ADC maps due to increased diffusion in the hypocellular infarcted brain (Fig. 12). If contrast is administered, parenchymal enhancement usually begins near the end of the first week and lasts less than 12 weeks – if it lasts longer, the presence of an underlying lesion should be considered [2].
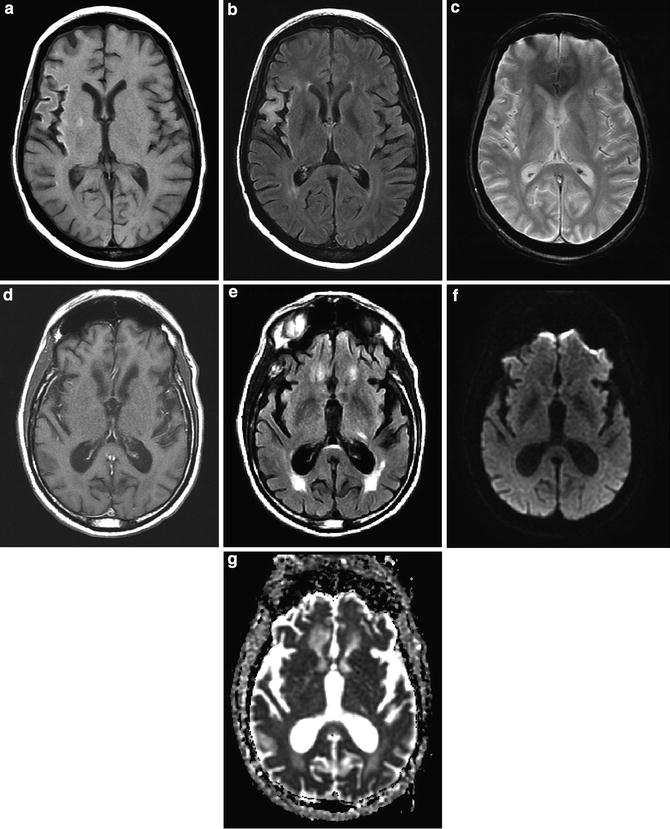
Fig. 12
Chronic infarcts. (a) T1-weighted image demonstrates cortical hyperintensity and atrophy in the M2 distribution of the MCA. (b) FLAIR demonstrates cortical and subcortical T2 hyperintensity and volume loss. (c) Gradient echo scan demonstrates no evidence of susceptibility hyperintensity to suggest chronic hemorrhage. (d) T1 hyperintensity is due to pseudolaminar necrosis. (e) In an example of a left chronic lacunar infarction, FLAIR images demonstrate hyperintensity. T1-weighted images would demonstrate corresponding minimal hypointensity. (f) Lacunar infarction is isointense on DWI and (g) hyperintense on ADC map
Vascular Imaging
Arterial and venous occlusion or slow flow can be visualized on FLAIR and enhanced T1-weighted images. Chronic vessel occlusion or extremely slow flow in large vessels manifests with isointensity to hyperintensity on T1-weighted images (Fig. 13) and hyperintensity on FLAIR because the intrinsic hyperintensity of blood can be “captured” due to the absence of flow effects. If contrast is administered, intraluminal hyperintensity is more extensive distal to an occlusion than in normal circulation because the intrinsic intensity of the enhanced blood is detectable secondary to absent flow effects.
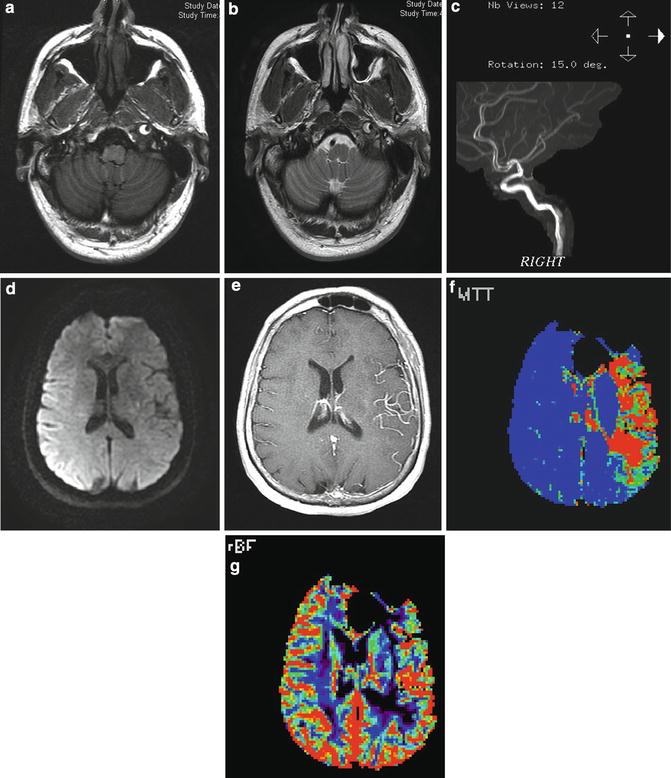
Fig. 13
Carotid dissection with slow flow and large perfusion diffusion mismatch. (a) T1- and (b) T2-weighted images demonstrate the presence of peripheral hyperintensity surrounding central hypointensity in the left internal carotid artery at the skull base (“target sign”) representing intramural clot surrounding the narrow but patent artery. (c) MRA demonstrates the hyperintense flow with the lumen surrounded by more amorphous hyperintense clot in the vessel wall. (d) DWI image demonstrates minimal restricted diffusion in the left corona radiata (apparent hyperintensity overlying right hemisphere is artifactual). (e) Contrast-enhanced T1-weighted image demonstrates enhancement of MCA branches due to slow flow. (f) MR perfusion demonstrates marked prolongation of mean transit time and (g) moderate decrease in cerebral blood flow
Direct visualization of vascular abnormalities (stenosis occlusion and dissection) can be obtained with CTA, magnetic resonance angiography (MRA), and catheter angiography. The latter is usually reserved for cases where intervention is contemplated or when diagnosis is in doubt. Atherosclerotic narrowing and occlusion occur in typical locations (e.g., carotid bifurcations in the neck, M1 segments of middle cerebral arteries, vertebral artery origins, and intracranial segments). Dissections of the extracranial internal carotid artery produce four patterns of luminal abnormality: smooth tapering to a pointed occlusion, long segment asymmetric narrowing, double lumen with an intimal flap, and pseudoaneurysm formation [7]. CTA allows for the detection of intimal flaps and double lumens and MRA is excellent at identifying carotid dissection. MRI imaging of the neck in particular with fat-suppressed T1-weighted imaging can identify the intramural hematoma that is the direct result of the dissection (Fig. 13).
MR Perfusion
Perfusion imaging can be performed with MR as well as CT. As with CT the brain is imaged as a bolus of contrast is being injected. The contrast agent is paramagnetic so it causes intensity in the brain to decrease proportionate to the amount of contrast in the vascular system. Whole brain coverage is routinely obtained (as opposed to CT perfusion). The perfusion parameters are similar to those obtained from CT, but it is not possible (or at least not easy) to obtain MTT measurements and therefore quantification is difficult. However, since the perfusion diffusion mismatch is qualitatively visible, there is no need for quantification to delineate the core infarct and the penumbra (Fig. 13).
Localization of Ischemic Strokes
The intracranial circulation involves paired internal carotid arteries and vertebral arteries that merge to form the basilar artery. An anastomotic network connects the carotid and vertebrobasilar systems at the circle of Willis provides defense against major-vessel occlusive disease. However, collateral circulation is more sparse distal to the circle of Willis, which makes these areas more susceptible to infarction. It is thus important to understand the vascular anatomy and recognize territorial arterial supply to localize blood vessels with atherosclerotic disease/thrombosis.
Related posts:
Stay updated, free articles. Join our Telegram channel

Full access? Get Clinical Tree


