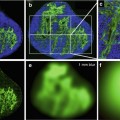
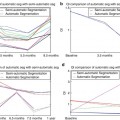
Fig. 16.1
T2- and T2*-weighted echo-planar MR image of the same slice show decreased signal intensity of brain parenchyma while bolus of paramagnetic contrast material passing through the tissues. The reduction of signal intensity is greater within the gray matter than in the white matter. In GE T2* acquisition this signal drop can be appreciated in all territories, especially in great vessels. Conversely, in SE T2-weighted images this signal drop is more pronounced in gray matter than in great vessels
Although, both types of image weighting (T2 and T2*) are sensible to contrast concentration, it has been described a different behavior depending on the vessel size. On one hand, SE-based maps show a stronger capillary weighting and suppression of large vessels, making that the gray-to-white matter ratio determined with the SE method is in better agreement with previous positron emission tomography (PET) and single photon emission tomography (SPECT) studies than the GE results. On the other hand, GE techniques are also sensible to large vessel perfusion [4]. For brain tumor aggressiveness differentiation, GE techniques have shown higher rCBV in aggressive tumors compared to SE sequences. In addition, equivalent dispersion levels have been found on both techniques [5].
Based on the different behavior of both acquisition techniques depending on vessel size, imaging techniques has been proposed to be able to measure the radius of the vessel. These techniques are known as vessel size imaging (VSI). Although a deep explanation of these techniques is out of the scope of this chapter, two different acquisition approaches have been proposed in the literature. The main difference between both approaches relies on the used contrast and the associated acquisition approach. The first approach use a super-paramagnetic contrast agent and R2 and R2* mapping techniques for the estimation of relaxation difference when the contrast is distributed in the parenchyma [6]. The second approach benefits from the first pass of gadolinium combined with a dynamic acquisition where GE- and SE-weighted images are acquired at the same time [7].
For quantitative flow results using DSC-MRI experiments, it is necessary to convert T2 changes in contrast concentration using the following equation:

where r represents the T2 relaxativity constant of the contrast, and T2(t) and T2(0) represents the T2 during the contrast passage and at the baseline. A detailed analysis of the conventional MRI signal shows that the S(t) can be expressed as:

where S 0 (T1) represents the fully T2 or T2* relaxed signal that takes into account T1 saturation effects, S(t) represents the signal evolution during contrast injection, TE represents the echo time of the sequence, and T2(t) or T2*(t) the relaxation constant that will be affected by the changes in contrast concentration during the first pass of contrast. Under the assumption that there is no signal change due to T1 relaxation, S0 (T1) remains constant during the experiment and the contrast concentration can be obtained as:


(16.1)

(16.2)

(16.3)
In the case where there is also a signal variation due to T1 effects, Eq. 16.3 cannot be applied. A clear example is when the BBB is broken and the contrast goes to the extravascular-extracellular space and is accumulated along the experiment also producing faster T1 relaxation. Imaging sequences sensitive to susceptibility effects will demonstrate a decrease in signal due to contrast passage. However, unless the sequence is insensitive to relaxivity effects, this will cause elevation of signal intensity (T1 shine-through), which may result in underestimation of rCBV [8, 9].
In order to avoid T1 effects in the signal, two different approaches have been suggested. The most common one is to inject a pre-bolus of contrast before the DSC-MRI experiment [10]. With this injection, those brain regions with broken BBB accumulates enough contrast, producing less variation due to T1 effects during the second contrast injection of the DSC-MRI experiment. This approach is combined with acquisition strategies less sensible to T1 effect, with small excitation flip angles, normally lower than 35º [10]. The second approach is to acquire dual-echo sequences [11] with a segmented EPI sequence that allows T2 and T2* estimation for each dynamic acquisition and, it does not need to refer to different dynamic acquisitions to get the relaxativity variation due to contrast concentration. Moreover, this technique allows to distinguish between T2 and T1 effect during the acquisition and, therefore, to obtain not only the conventional DSC-MRI parameters, but also the extraction fraction of the contrast to the extravascular space.
16.2.1.2 Dynamic Contrast-Enhanced MRI
The most common method to measure perfusion is known as DCE-MRI, where a dynamic imaging technique is used to monitor the time variation signal change in the tissue due to an intravenous injection of a bolus of paramagnetic tracer. The first DCE-MRI experiments were performed at mid-1980s [12, 13], but true perfusion weighting was only obtained when this signal variation could be followed at the equivalent time scale of tracer dynamics [14, 15]. Since this is the time scale of typical tracer transit times through the capillary bed, the tracer is essentially intravascular during the first pass of the bolus, providing pure perfusion weighting.
Depending on the image information that will be extracted from the images, the acquisition strategy needs to be defined. On one hand, in many clinical applications, it is sufficient to acquire a limited number of images at the baseline and during contrast pass through the tissue of interest, in order to measure the maximum enhancement and contrast washout and roughly study the enhancement pattern. This approach does not require a very high-temporal resolution acquisition, and for this reason, this approach is usually performed in most of the clinical abdominal MRI.
On the other hand, the evaluation of the whole hemodynamic perfusion information derived from DCE-MRI exams relies on the quantitative capability of the MRI techniques to provide an accurate contrast concentration along time not only in the tissue -C(t)- but also in the feeding arteries -C A(t)-. This requirement imposes some limitation in the temporal resolution that need to be fulfilled, establishing a framework for MRI techniques applied in DCE-MRI studies.
On MRI, intravenous tracers produce a competitive T1 and T2 relaxation mechanism when used in clinical environment. Normally, T1 effects are the most relevant relaxation mechanism associating signal changes during the MRI acquisition. At the same time, the contrast arrival also presents T2* effect, especially in the feeding arteries, that needs to be reduced in order to avoid underestimation of contrast concentration in the C A(t).
Most of the sequences applied in DCE-MRI are either 2D or 3D gradient-echo sequences. The earliest approaches used a 2D sequence with a limited number of slices to achieve the high-temporal resolution required for perfusion MRI. However, since the introduction of parallel imaging and acceleration schemes for dynamic imaging [16, 17], fast 3D acquisition has become feasible and is gradually replacing 2D approaches in current practice. Moreover, 3D acquisition is less sensible to B1 artifacts reducing slice profile error of the 2D acquisition. For this reason this section will be focused on the 3D approach (Fig. 16.2), but deeper analysis of MRI techniques applied to DCE-MRI can be found elsewhere [18].
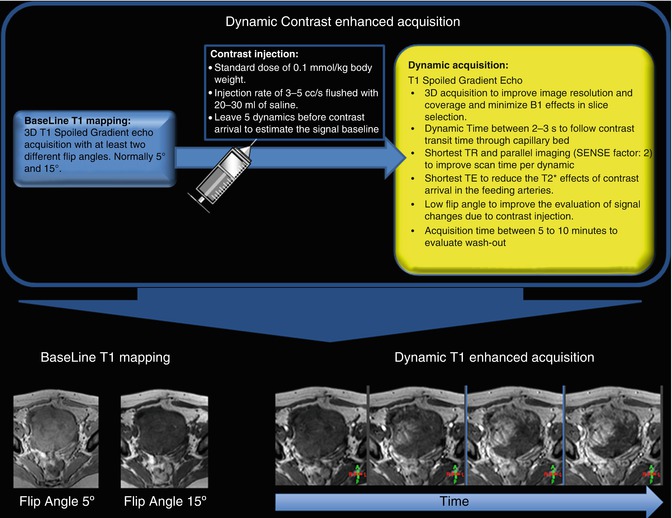

Fig. 16.2
Schematic representation of a DCE-MRI acquisition including the baseline T1 mapping, the injection protocol, and the dynamic acquisition
For accurate flow estimation, it is necessary to estimate the contrast concentration for every dynamic acquisition. To get this concentration it is possible to use the well-known T1 relation described by:

where T1(t) represents the T1 variation trough dynamic acquisition due to contrast concentration, T10 represents the T1 of the tissue at the baseline, r1 represents T1 relaxativity of the contrast agent, and C represents the unknown contrast concentration. From Eq. 16.4 contrast concentration can be easily estimated if T10 and T1(t) are known. The easiest way to estimate this baseline T10 value of the tissue is acquiring a 3D T1-weighted spoiled gradient-echo (3D SPGR) acquisition with different flip angles, maintaining equal all other acquisition parameters. The optimum selection of the applied flip angle to estimate T1 values can be chosen depending on the expected T1 value [19]. The final estimated T1 value is obtained fitting the signal intensity of the images acquired with different flip angles to:

where α represents the applied flip angle in each acquisition, S 0 represents the T1 fully relaxed signal that takes into account T2 effects, and TR represents the repetition time of the sequence.

(16.4)

(16.5)
Dynamic acquisition is also performed using a 3D SPGR acquisition strategy. The sampling rate of this sequence should be sufficient to follow the transient of the contrast through the capillary bed that is typical between 3 and 5 s. In order to achieve this dynamic time, the shortest possible TR is chosen and parallel acquisition techniques are normally applied. To minimize the T2* effects due to contrast arrival, especially in the C A(t) estimation, the shortest possible echo time (TE) is preferable. To improve the visualization of the contrast concentration variations, it is desirable to define an optimum flip angle according to a defined range of contrast concentration and the other image parameter [20]. Finally, the number of dynamic acquisitions is chosen to cover the whole hemodynamic process, according to the enhancement pattern of the tissue, but a 5 min acquisition is normally sufficient to evaluate the tissue wash out.
16.2.2 Image Analysis
16.2.2.1 Motion Compensation
As an alternative to motion compensation approaches on the acquisition level, or complementary to them, motion correction may be performed on the post-processing level [21]. Technically, the major difficulty in DCE-MRI compared to similar problems in medical imaging is the changing signal intensities during bolus passage. The challenge for a (semi) automatic motion correction technique is to distinguish these changes from those due to motion, and the development of robust techniques remains an open problem. For an ROI-based analysis, the most straightforward approach is to redraw or modify the ROI for every individual dynamic acquisitions. The process is tedious and time consuming, difficult to automatize [22], and is not suitable for a pixel analysis. An alternative approach is based on co-registration techniques, which aim to match motion-affected images to a reference image by a rigid or nonrigid deformation of the image [23–25]. Co-registration is attractive in theory, as it fully removes motion effects and reconstructs the data that would be measured in the absence of motion. However, it is computationally challenging and usually requires expert intervention especially in those body organs where the displacement is different depending on the organ position.
16.2.2.2 Image Quantification
Different strategies can be applied to extract quantitative parameters from perfusion studies. The simplest approach uses curve descriptor like contrast arrival time (time when the contrast arrive to a pixel), time to peak (time for the maximum signal intensity), or area under the curve (AUC, integral of the contrast concentration time curve for a specific time interval definition).
On the other hand, once the contrast concentration is obtained from each dynamic acquisition, the tracer kinetic theory provides a relation between those quantities and thus forms the basis for determining the tissue status from the measured concentrations in the tissue C(t) and the feeding artery C A(t). This theory establishes a relation between both quantities that follows:

where F p is the flow of the blood plasma in the tissue, and R(t) is normally called residue function and represents the fraction left in the tissue at time t of a dose injected at time t = 0, and ⊗ represent the convolution operator. The residual function R(t) is the relative amount of contrast in the VOI in an idealized perfusion experiment, where a unit area bolus is instantaneously injected and subsequently washed out by the perfusion.

(16.6)
The blood volume (BV) can be estimated as:

where the k H represents a correction factor that takes into account the extracellular behavior of the contrast.

(16.7)
Following the central volume theorem, the passage of contrast can also be measured with DSC-MRI through the MTT, expressed as MTT = V/F p which gives a measure of the washout time of the blood in the volume of interest. In the case of cerebral perfusion, F p is known as CBF and the contrast volume is known as CBV (Fig. 16.3).
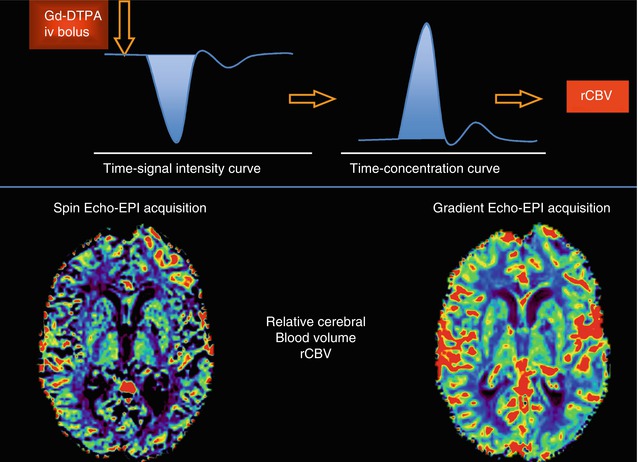

Fig. 16.3
Time-signal intensity curve demonstrates decreased signal intensity with passage of bolus of paramagnetic contrast material (Left, Top row). The shaded area represents the area used to calculate the rCBV. Data obtained in the time-signal intensity curve are transformed to time-contrast concentration curves (Right, Top row) to generate color-coded map that represents rCBV values in brain tissue. Notice the differences between the rCBV parametric maps derived form a SE-EPI and a GE-EPI sequences (Bottom row).
One step further in this theory is the pharmacokinetic modeling of the residue function in terms of the hemodynamic parameters. The fundamental building block of any tracer-kinetic model is the compartment, often defined as a space where the tracer is well mixed or evenly distributed over the space at all times. Following this theory, the residue function can be described as a combination of different compartments:

where n represents the number of compartments.

(16.8)
Following this compartmental theory, cerebral perfusion can be seen as a single compartment model where the residual function can be expressed as:


(16.9)
In most of the tissues other than brain, standard MRI tracers distribute over two different spaces: the blood plasma P and the extravascular, extracellular space E. The two-compartment exchange model [26–28] is defined by the assumption that (1) P and E are compartments; (2) E does not exchange tracer directly with the environment; (3) the clearances for the outlets connecting P and E are equal; and (4) the clearance for the outlet of P to the environment equals the plasma flow.
There are four different situations where a tissue with this structure can be effectively reduced to a one-compartment model: (1) and (2) when one of the spaces has a negligible volume, (3) if the tracer extravasates slowly, so that, the concentration in the extravascular space is negligible within the acquisition time, and (4) if the tracer extravasates rapidly, so the system behaves as a single well mixed space. In each of these regimes, the residue function becomes mono-exponential, but the precise interpretation of the parameters is different. Hence, it is recommended to use an abstract notation K trans and k ep for the model parameters of a one-compartment model:


(16.10)
A one-compartment model with these notations is often referred to as a Tofts model [29] or as a modified Tofts model when a term is added to account for the tracer in the vasculature [30]. If prior information regarding the state of the tissue is available, then K trans and k ep can be interpreted in more concrete terms. However, to avoid errors of misinterpretation [31, 32], it is prudent to leave the interpretation open [33, 34].
In those cases where the vascular volume cannot be neglected, it is required to include the plasma contribution in the model with a resulting total contrast concentration equal to:

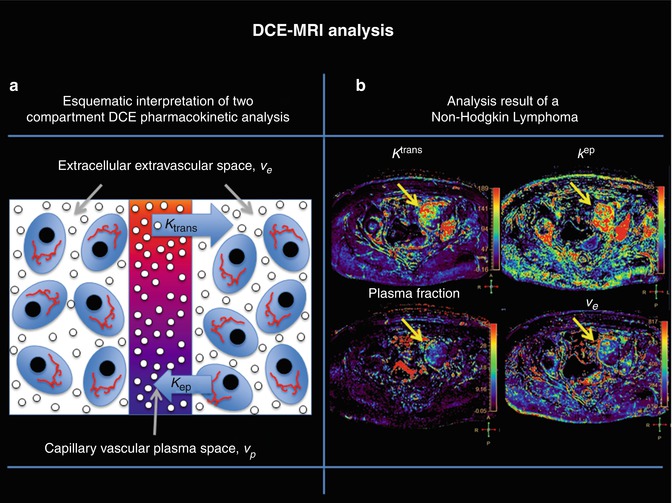
where v p represents the volume of plasma inside the voxel and is normally called plasma volume, v e represents the extravascular-extracellular volume inside the voxel, K trans represents the transfer rate of the blood from the vessels to the extravascular-extracellular space, and k ep the transfer rate of the blood from the extravascular-extracellular space to the vessel. A graphical interpretation of these parameters can be found in Fig. 16.4 and the results of the analysis of a highly vascularized tumor.

(16.11)

Fig. 16.4
(a) A graphical interpretation of the quantification parameters of a two-compartment model and (b) K trans, K ep, plasma volume and extraction volume maps obtained according to the quantification process explained in Fig. 16.2. The yellow arrows show the pharmacokinetic characteristics of a non-Hodgkin lymphoma, which demonstrates high permeability and perfusion
16.2.2.3 AIF Selection
For an accurate perfusion estimation, it is necessary to obtain the arterial input function (AIF) of a contrast agent C A(t); the time-concentration curve in plasma has long presented a problem in MR DCE-MRI and DSC-MRI studies. A poor estimation of the AIF due to insufficient time sampling or signal saturation effects produces substantially increase bias in the estimated hemodynamic and permeability maps [28]. To overcome this limitations, some authors have proposed to use a simplified functional form for the AIF, which is assumed valid for all individuals [35, 36]. However, others have shown that using a simplified standard AIF can lead to large systematic errors in kinetic tracer model output parameters, such as the volume transfer constant K trans and the fractional blood volume [37, 38]. Because interindividual variations in heart rate and kidney function have the potential to lead to differences in the AIF form, the use of an accurately measured AIF for each subject is often the preferred approach, even though it is only attainable in a minority of studies [35, 39]. It is often not possible to perform a reliable AIF measurement due to experimental constraints or due to the lack of a suitable artery in the field of view. Hence, recent published work [40] of a clinical DCE-MRI study has suggested the use of an assumed form of AIF that is sufficiently similar to the true AIF to allow estimation of model parameters. Parker et al. [40] demonstrated that in the presence of measurement errors in an experimentally acquired AIF, there are significant benefits to be gained in the reproducibility of compartmental model parameters by using an assumed form. However, there have been limited studies conducted, so far, to quantify the effects of using an assumed form of AIF in experimental models or in differentiating the effects of varying assumed AIF forms, including population averages.
16.2.3 Contrast Agents and Injection Protocol
DCE-MRI may be performed using low-molecular-weight contrast media or macromolecular contrast media. Most of published DCE-MRI studies in the body have used low-molecular-weight contrast media because of their clinical availability. Due to space constraints, this review will not refer to DCE-MRI with macromolecular contrast agents. Any of the commercially available gadolinium chelates of 0.5 mM concentration are useful to measure first-pass perfusion, but in order to analyze permeability, it is preferable to avoid the use of protein-bound tracers, as they need of a complex specific analysis.
Most commonly, a standard dose of 0.1 mmol/kg body weight is recommended, using an injection rate of at least 3 cc/s flushed with 20–30 ml of saline.
DSC-MRI is usually performed with extravascular-extracellular gadolinium chelates. Some authors advocate for the use of protein-bound tracers or agents with double-gadolinium concentration due to better contrast enhancement and better diagnostic performance in many clinical situations due to higher relaxivity [41]. In DSC-MRI, a dose of 0.1 mmol/kg of gadolinium-based contrast agent is enough for adequate diagnostic performance. Injection protocol requires fast injection rates (ranging from 3 to 5 mL/s bolus injection rate) for stronger arrival effect of the contrast followed by a 20–30 mL saline flush at the same rate.
16.3 Non-Contrast-Based Techniques
16.3.1 Arterial Spin Labeling
Among MRI methods, arterial spin labeling (ASL) techniques have shown their potential for tissue perfusion quantification. The complete noninvasiveness and nonionizing nature of this technique makes ASL a very interesting method for studying perfusion in healthy individuals or patients who require repetitive follow-ups. Furthermore, the use of any radioactive tracers or exogenous contrast agents, which are necessary in most conventional techniques, may be restricted in patients with particular conditions, such as kidney failure, or in pediatric populations. Finally, ASL-based methods are useful for functional studies and evaluations of new therapies, in which physiological changes due to the pharmacological stimuli must be monitored over time. Due to movement artifacts, most of the clinical experience of ASL has been limited to the brain (Fig. 16.5), although recently it has been proven useful in body organ such as kidney.
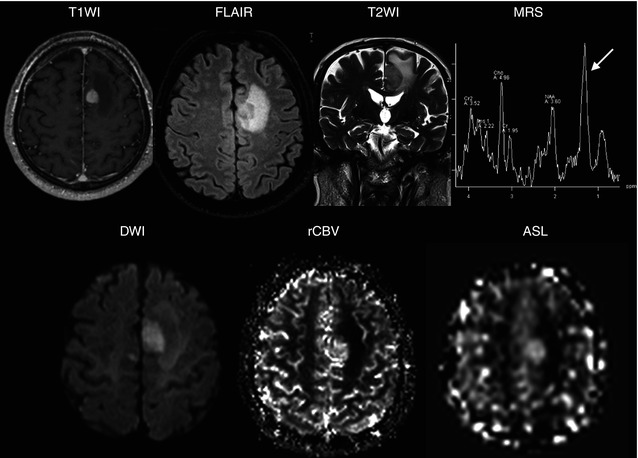

Fig. 16.5
A 47-year-old woman with Hodkgin lymphoma complaining of new onset of seizures. A round-enhancing lesion is demonstrated in the parasagittal aspect of the left frontal lobe, surrounded by vasogenic edema. The lesion also presents restricted diffusion, secondary to its hypercellularity. MR spectroscopy shows elevated picks of choline and lactate/lipids (arrow) and reduction of NAA. The lesion demonstrates high perfusion on both rCBV and ASL maps related to brain involvement by lymphoma
The common goal of all existing ASL techniques is to produce a flow-sensitized image (also known as a labeled image) and a control image in which the static tissue signals are identical. This is usually performed by inverting or saturating the water protons in the blood supplying the imaged organ. After a delay between labeling and image acquisition, called the inversion delay (TI), the labeled blood spins reach the capillaries, where they exchange with tissue water, giving rise to the perfusion signal. The subtraction of the label from the control yields a difference signal that directly reflects local perfusion, since the signal from stationary tissue is completely eliminated.
There exist two main classes of ASL techniques: continuous ASL (CASL) and pulsed ASL (PASL). In CASL, the supplying blood is continuously labeled below the imaging slab, until the tissue magnetization reaches a steady state. The PASL approach labels a thick slab of arterial blood at a single instance in time, and the imaging is performed after a time long enough to allow the spatially labeled blood to reach the tissue and exchange at the region of interest. Both methods need a control experiment in order to visualize and quantify the perfusion (Fig. 16.6).
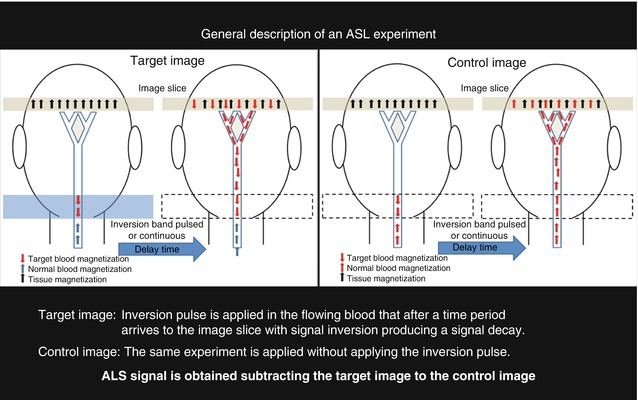

Fig. 16.6
A schematic representation of an ASL experiment is presented where two sets of images are acquired with and without the application of an inversion pulse to the flowing blood. In the first experiment an inversion pulse is applied producing a signal drop in the slice image due to the inverted spins of the target blood. In the second experiment there is no signal drop due as none inversion pulse is applied. The difference between both images provides perfusion information
16.3.1.1 Continuous Arterial Spin Labeling
The original ASL method proposed by Detre and Williams et al. [42, 43] in 1992 used a continuous flow-driven adiabatic inversion scheme, a method that was previously used for angiography [44]. This type of adiabatic inversion of the arterial magnetization is performed using a 2–4 s continuous radiofrequency (RF) pulse, while applying a magnetic field gradient in the flow direction. The moving arterial spins will therefore experience a slow variation of the resonance frequency, which will result in their inversion, while static (tissue) spins will just be saturated. The use of long inversion pulses produces strong magnetization transfer (MT) effect during the labeling procedure that needs to be compensated as well during control image acquisition. In the first implementation, MT effects were compensated by applying a distal labeling during the control experiment. This produces identical saturation effects but, due to the applied gradients during labeling, this is unfortunately valid only for a single slice. For multi-slice acquisition, Alsop et al. [45] proposed the use of two closely spaced inversion planes, also called double adiabatic inversion. In the control experiment, the magnetization gets inverted while traversing the first plane and returns theoretically to its original state during the passage through the second plane.
16.3.1.2 Pulsed Arterial Spin Labeling
In 1994, Edelman et al. [46] proposed the first pulsed ASL scheme. Contrary to CASL, the labeling is performed once in a 10–15 cm slab proximal to the image slices. For the PASL sequences, MT effects have to be considered as well, although these are much smaller compared with CASL. In this first version of the “Echo-Planar MR Imaging and Signal Targeting with Alternating Radio frequency” (EPISTAR) sequence, inversion was performed distal to the image slice during the control experiment to induce identical MT effects in both cases. Again, this truly compensates for a single slice only and, therefore, the sequence was modified for multi-slice acquisition using a single 180° adiabatic pulse for the label experiment and two 180° + 180° pulses of half the power for the control experiment at the same proximal location [46, 47].
Shortly afterwards, an alternative to this asymmetric method of labeling was proposed by Kwong et al. [48] and independently by Kim [49], who named it flow alternating inversion recovery (FAIR). Here, the label is applied using a nonselective inversion pulse, while the control employs a concomitant slice-selective gradient pulse. The symmetric nature of this sequence automatically compensates for MT effects.
PASL allows inversion of the arterial spins closer to the image slices and the inversion efficiency is improved; however, due to imperfect inversion profiles, a gap between the labeling region and the image slices of typically 1–2 cm is needed, depending on the type of RF pulse used. This increases transit time from the labeling slab to the imaging slices leading to decreased efficiency. In addition, T1 relaxation of all the inverted spins will also result in a theoretically lower signal difference. Nevertheless, the ease of implementation and reduced practical problems, as compared with CASL, has made PASL a popular choice for perfusion imaging.
16.3.1.3 ASL Perfusion Quantification
Having acquired the data using either technique, the subtracted control-label images will be perfusion weighted. The relationship between the ΔM signal and the actual CBF depends mainly on proton density and T1 relaxation rates of tissue and inflowing blood and their respective differences. In addition, the label transit time from the inversion slab to the observed region in the images is also an important factor. Traditionally, quantitative CBF estimation is carried out using the tracer clearance theory originally proposed by Kety and Schmidt [50] which was first adapted to ASL experiments by Detre and Williams et al. [42, 43]. In the original model, it is assumed that the labeled arterial blood water is a free diffusible tracer, implying that the exchange of blood water with tissue water happens instantaneously upon its arrival to the parenchyma. Therefore, this model corresponds to a single compartment tracer kinetic, described by a mono-exponential tissue response function. In the original quantification model, further assumptions about uniform plug flow and equal T1 relaxation of both tissue and arterial blood were made [42]. Buxton et al. [51] proposed a general kinetic model where the magnetization difference between labeled and control measurements were described using the convolution integral between a particular arterial input function and to consider a certain exchange mechanism (CASL and PASL experiments) and the mono-exponential tissue response.
16.3.2 Intravoxel Incoherent Motion
Diffusion-weighted imaging (DWI) is an MRI technique sensible to microscopic mobility of water and is classically referred as Brownian motion. This mobility is due to thermal agitation and is highly influenced by the cellular environment of water. In oncologic imaging, DWI has been linked to lesion aggressiveness and proposed to evaluate tumor response, although the biophysical basis for this is incompletely understood. In biologic tissues, these motions include molecular diffusion of water and microcirculation of blood in the capillary network (perfusion). Molecular diffusion refers to physical properties of tissue that allow tissues to be characterized. The sensitivity to water movement is controlled by a sequence parameter called b value. This acquisition parameter controls the water dephasing due to the movement; when this parameter increases, the signal from water molecules with a higher movement disappears, remaining only the signal from those water molecules with restricted movement. In this scenario microcirculation of blood or perfusion can also be considered an incoherent motion due to the pseudorandom organization of the capillary network at the voxel level that can be imaged using low b values during the diffusion acquisition.
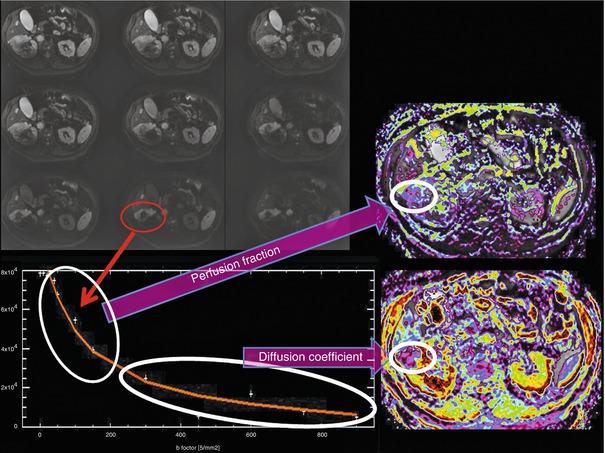
IVIM imaging is a method initially developed by Le Bihan et al. [52] to quantitatively assess the microscopic translational motions that occur in each image voxel at MRI. Le Bihan et al. [52, 53] demonstrated that both pure molecular diffusion and microcirculation, or blood perfusion, can be distinguished by using IVIM analysis of diffusion signal decay. For this, it is necessary to obtain multiple b values to encompass both low b values (<200 s/mm2) and high b values (>200 s/mm2). The low b values are used to study the fast water movement associated to the blood flowing through the capillary network in a pseudorandom manner. Conversely, for b values over 200 s/mm2, the signal information from the capillary network is completely dephased obtaining only signal from the extravascular space (Fig. 16.7).
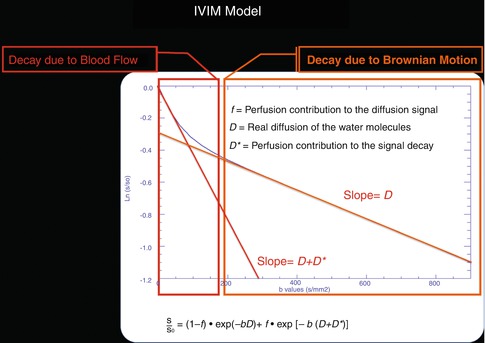

Fig. 16.7
This figure represents a graphical interpretation of IVIM model. In the first part (b < 200 s/mm2) of the diffusion decay curve, there is a fast signal drop related to the blood flowing through the capillary network organized in a random manner. The second part of the curve represents the signal decay due to normal diffusion of the tissue
16.3.2.1 IVIM Quantification
Following the diffusion theory the signal variation with the b values can be expressed as:

where S is the acquired signal intensity for each b value; S 0 is the signal intensity when there is no diffusion weighted applied, and D is the diffusion coefficient that represents the water mobility inside the studied voxel.

(16.12)
Under the IVIM theory where the blood flow mimics the diffusion process, the signal is also modeled equivalent to equation to Eq. 16.12

where D * represents the fast signal decay due to blood flow and is normally referred as perfusion-related diffusion. Combining the information of both tissues, diffusion territories is obtained:
![$$ S={S}_0{e}^{- bD}\left[\left(1-f\right)+f{e}^{-b{D}^{*}}\right], $$](/wp-content/uploads/2016/04/A272994_1_En_16_Chapter_Equ14.gif)
where f represents the perfusion fraction, which corresponds to the portion of the signal decay explained by the blood. Under this model D represents the free perfusion-diffusion coefficient (Fig. 16.8).

(16.13)
![$$ S={S}_0{e}^{- bD}\left[\left(1-f\right)+f{e}^{-b{D}^{*}}\right], $$](/wp-content/uploads/2016/04/A272994_1_En_16_Chapter_Equ14.gif)
(16.14)

Fig. 16.8
IVIM analysis of round cell carcinoma of the right kidney. Several b values under and over 100 s/mm2 are necessary to model the diffusion-signal decay in a bicompartmental model. The firs fast decay permits to obtain information about tumor moving flow (perfusion fraction map) and posteriorly, the more flattened signal decay of diffusion permits the quantification of tissue diffusivity without perfusion contamination (diffusion coefficient)
16.4 Clinical Applications in Oncology of perfusion-weighted MRI
16.4.1 Clinical Applications in Brain Tumors
16.4.1.1 Tumor Grading
There is a strong correlation between astrocytoma grading and tumor rCBV. One of the characteristic features of high-grade tumors relative to low grade is a higher degree of vascular proliferation related to neoangiogenesis, which can be assessed by rCBV. Thus, perfusion rCBV maps can provide relevant information regarding tumor grading, as low-grade gliomas have low rCBV (Fig. 16.9) and high-grade gliomas have high rCBV (Fig. 16.10). Some authors also proposed that rCBV measurement has the capability to predict progression and survival [54


Stay updated, free articles. Join our Telegram channel

Full access? Get Clinical Tree


