Fig. 12.1
Relationship between X-ray translucency and (a) air and lung vessel volume and (b) pulmonary blood volume per unit volume
Fig. 12.2
Measured pixel value and electrocardiogram in a normal control
It is also well known that there are regional differences in ventilation in respiratory physiology [19]. Ventilation per unit volume is greatest near the bottom of the lung and becomes progressively smaller toward the top with symmetrical right-and-left distribution. Therefore, ventilatory impairment can be detected based on deviation from the normal pattern of ventilation distribution. In the case of dynamic chest radiography, ventilatory impairment could be detected by comparing respiratory-induced changes in pixel value in symmetrical positions in both lungs [22].
Other measurements showed that, at the end of expiration, the lower airway closes earlier than the upper airway due to the differences in air pressure of the thoracic cavity, i.e., airway closure, and the ventilation in the upper area becomes greater than that in the lower area. The lung volume when airway closure occurs is defined as the “closing volume,” which is a very effective index for diagnosing pulmonary diseases. For example, in subjects with COPD and restrictive pulmonary disease, airway closure appears in early expiratory phase, and as a result closing volume becomes large. Therefore, abnormalities can be detected by evaluating the timing of “airway closure” [23].
Pulmonary Blood Circulation
Circulation dynamics is reflected on chest radiographs and abnormalities appear as shape changes or shifts in the distribution of pulmonary vessels [20, 24, 25]. These are effective indices for diagnosing specific cardiac diseases and determining an appropriate examination procedure: redistribution or cephalization of pulmonary blood flow indicating the presence of pulmonary venous hypertension [26]; a centralized pulmonary blood flow pattern, indicating pulmonary arterial hypertension [27]; or widening of the vascular pedicle indicating an increase in circulating blood volume [28]. Circulation dynamics is also reflected on fluoroscopic images as changes in X-ray translucency [10, 11, 29] (Fig. 12.1b), which provide functional information. This is because the lungs contain a constant volume of about 500 mL of blood, with 75 mL distributed variably across the vasculature due to cardiac pumping [18].
Figure 12.3 shows changes in pixel value measured in a normal subject, in ROIs as shown in Fig. 12.4. There is a strong correlation between the cardiac cycle and changes in pixel value, which are measured in the ventricles, atria, aortic arch, and pulmonary arteries. The changes in pixel values measured in each ROI can be explained by normal circulation dynamics as indicated below: (1) at the end of the diastole phase, the ventricles are at the maximum volume, as shown by large pixel values in the ventricles. (2) In the early ventricular systole phase, from closure of the atrioventricular (AV) valves to opening of the aortic valve, the ventricular volume remained constant, shown as the absence of a significant change in pixel values during this period. (3) After opening of the aortic arch, blood is pumped from the ventricles into the aortic arch and pulmonary arteries. This was shown as a decrease in pixel values in the ventricles and an increase in pixel values in the aortic arch and pulmonary arteries. (4) In the late ventricular systole phase, ventricular volume and aortic blood flow decrease, shown as a continuous decrease in pixel values. (5) In the early ventricular diastole phase, from closure of the aortic valve to opening of the AV valves, the ventricular volume remains constant. Thus, there is no significant change in the pixel value. (6) Blood rapidly moves from the atria to the ventricles in response to opening of the AV valves; this is why the pixel values in the ventricles increase while, in contrast, those in the atria and pulmonary veins decrease.
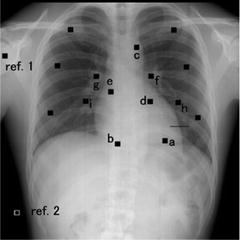
Fig. 12.3
Relationship between cardiac cycle and changes in pixel values. (a) Normal circulation determined by cardiac physiology, (b) measured pixel values in each ROI in the present study (normal, 22-year-old man)
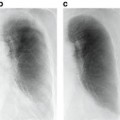
Fig. 12.4
Measurement location. Small squares show ROIs for measuring average pixel value, and the horizontal line shows a profile for measuring left-ventricle motion [a, left ventricle (LV); b, right ventricle (RV); c, aortic arch (AA); d, left atrium (LA); e, right atrium (RA); f, left pulmonary artery (LPA); g, right pulmonary artery (RPA); h, left pulmonary veins (LPV); i, right pulmonary veins (RPV); other ROIs, peripheral vessel; ref. 1, shoulder; ref. 2, air]
Figure 12.5 shows the average rate of change in pixel value for all subjects. The results measured in each ROI decrease in the following order: left ventricle > left atrium > aortic arch > right atrium > right ventricle > left pulmonary artery. These findings indicate that pulmonary blood circulation is reflected on dynamic chest radiographs and that the present method has the potential to evaluate local blood circulation.
Fig. 12.5
Average changes in pixel values measured in each ROI. Error bars show ±SD (n = 7) (SD: standard deviation, N.S.: not significant)
Dynamic Chest Radiography
Sequential chest radiographs during respiration are obtained using a dynamic FPD system. Imaging is performed in the standing position and PA direction. For accurate evaluation of cardiopulmonary function, it is crucial to include the entire series of motions within a limited amount of time with good reproducibility. Therefore, it is recommended to use an automatic voice system and conduct pre-training for patients. The total patient dose can be less than the dose limit for lateral chest radiography recommended by the International Atomic Energy Agency (IAEA) (1.5 mGy) [30], and it can be set by adjusting the imaging time, imaging rate, and source to image distance (SID) [21, 29, 31–37]. Cardiopulmonary function is evaluated separately in each respiratory phase, inspiratory, expiratory, and breath-holding phase. The imaging rate should be greater than 7.5 frames per seconds (FPS) to permit accurate evaluation of cardiac function. If the focus is on the evaluation of respiratory function, a lower imaging rate is acceptable by taking into account the patient dose. However, an imaging time of greater than 10 s is required to induce maximum voluntary respiration.
Quantification of Cardiopulmonary Function
Analysis of dynamic chest radiographs comprises quantification, visualization, and detection of abnormal findings. Such processing permits the quantitative evaluation of diaphragm motion, cardiac function, pulmonary ventilation, and blood circulation. Figure 12.6 depicts the overall image analysis. The process in detail is outlined in the following sections. Low pixel values were related to dark areas in the images, and these in turn were related to high X-ray translucency in this chapter.
Fig. 12.6
Overall scheme of image analysis
Measurement of Diaphragm Motion
Lung area was determined by edge detection using the first derivative technique and iterative contour-smoothing algorithm [38, 39]. Figure 12.7 depicts the measurement points for assessing diaphragm motion. The lung apex and diaphragm are determined in the first frame and traced by the template-matching technique after the second frame. The distance between the lung apex to the diaphragm is measured, and excursion of the diaphragm is then calculated by subtracting the distance at the maximum inspiratory level from that at the expiratory level [36, 37]. Abnormalities are detected by comparison with normal excursion or side-by-side comparison in each individual.
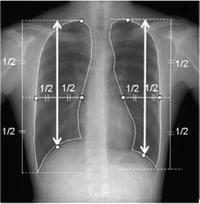
Fig. 12.7
Measurement points for evaluating diaphragm motion
Measurement of Cardiac Wall Motion
Temporal–spatial cross-section images interpolated linearly are created from dynamic chest radiographs (Fig. 12.8) [34, 37]. These images could be obtained at any position of chest image and provide a visual observation of heart wall and diaphragm motion. Cardiac wall motion is also assessed by the profile curve analysis as shown in Figs. 12.3 and 12.4.
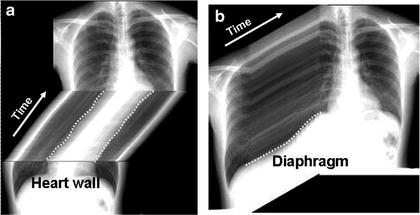
Fig. 12.8
Temporal cross-section images created from dynamic chest radiographs. (a) sagittal and (b) axial section images, respectively
Determination of the Respiratory Phase
Determination of Cardiac Phase
The cardiac phase can be estimated on the basis of the change in pixel values measured near the left heart wall. Average pixel value is measured in an ROI located just outside of the left ventricular wall throughout all frames [31]. Increase in pixel values is determined as the diastole phase and decrease in pixel values as the systole phase. The frames composing a whole cardiac phase are determined and the first complete cycle is selected for evaluation of cardiac function. The cardiac phase is also determined using the results of profile curve analysis as shown in Fig. 12.3.
Measurement of Change in Pixel Value
Pulmonary function is assessed in images during respiration, whereas cardiac function is assessed in images during breath-holding. Pulmonary ventilation and blood circulation are indicated as changes in pixel values on the dynamic chest radiographs. However, it is difficult to evaluate the slight changes by observing images. Furthermore, accurate interpretation requires a great deal of knowledge regarding respiratory and cardiac physiology. Interframe subtraction is useful to identify slight changes in pixel value. There are two main approaches for the evaluation and visualization of pulmonary ventilation and blood circulation: a velocity-based approach by interframe subtraction and a distribution-based approach that accumulate differences in pixel values. The analysis algorithm is presented as follows.
Analysis of Pulmonary Air Flow
The velocity-based approach consists of an interframe subtraction and mapping technique [21, 32, 33]. First, smoothing of pixel values is performed in the time axis direction to reduce the change due to the heartbeat and artifacts due to rib movement (Fig. 12.9a, b). To evaluate respiratory changes in pixel values in each lung unit, average pixel value is calculated in each lung, the interframe differences of the average pixel value are calculated, then superimposed on dynamic chest radiographs in the form of color display as shown in Fig. 12.9c. The color display uses a color table in which negative changes (X-ray translucency ↑) are shown in warm colors and positive changes (X-ray translucency ↓) are shown in cold colors.
Fig. 12.9
Noise rejection and color table. (a) Measured pixel value and electrocardiogram (ECG). (b) Smoothed pixel value in the time axis direction. (c) Interframe difference of smoothed pixel value and color bar used to create functional images
Analysis of Ventilation Distribution
Chest radiographs are divided into blocks to measure average pixel value in each local area (Fig. 12.10). The measurement in block units is to reduce the influence of slight movement, dilation, and contraction of lung structures, and also to facilitate comparison of local changes and statistical analysis. In Fig. 12.10, the block size is set to be slightly smaller than the intercostal space, so that each block is deformed in response to the changes in texture resulting from dilation and contraction of the pulmonary blood vessels and bronchi. The displacement of lung structures at the imaging rate of 7.5 fps is quite small, 0–3 pixels per frame, mainly in the craniocaudal direction. Thus, each block can be deformed geometrically using the affine transformation algorithm based on magnification percentages calculated from differences in displacement between adjacent blocks, as described elsewhere in detail [32, 40].
Fig. 12.10
One frame of sequential chest radiographs divided into 32 × 32 blocks that were slightly smaller than the intercostal space in size. (a) The black lines show the lung area determined for measurement of pixel values. The hilar regions are excluded from the lung area manually. (b) The bold vertical line shows the center of symmetry. “Symmetric positions” are pairs of blocks the same distance from the center of symmetry. The small black and white squares show the blocks with and without a pair for comparison, respectively
Average pixel values are measured in each block, tracking and deforming the region of interest (ROI). Interframe differences are then calculated, and the absolute values are summed in each block through all the frames. Interframe subtraction and summation of the absolute values are performed instead of subtraction between the maximum inspiration and expiration frames to reduce the influence of errors in image tracking and deformation.
The percentage of interframe differences of the pixel values to the summation of the results in all blocks is then calculated as below:
where M and N are the number of blocks in the horizontal and vertical directions, respectively. In addition, m and n represent the coordinates of the blocks in the horizontal and vertical directions, respectively. P total (m, n) is the summation of the absolute interframe differences in each block. To facilitate visual evaluation, P % (m, n) is mapped on the original image using a grayscale (hereafter called “Distribution map”).
(12.1)
Analysis of Pulmonary Blood Flow
Velocity maps of blood circulation are created by interframe differences in pixel values due to cardiac pumping. Thus, these images can provide information on blood flow velocities during each cardiac phase. Figure 12.11 shows the overall scheme of the computer algorithm for quantifying changes in pixel value due to pulmonary blood circulation. After determination of the lung area, the interframe difference is determined throughout all frames. Velocity maps of blood circulation are then created by superimposing of difference values on dynamic chest radiographs in the form of a color display, by use of a color table in which positive changes (lower X-ray translucency) are shown in warm colors and negative changes (higher X-ray translucency) are shown in cool colors.
Fig. 12.11
Computer scheme for creating velocity and distribution maps of blood circulation. (a) ECG and pulse-wave, (b) processing process
Analysis of Circulation Distribution
Distribution maps of blood circulation are created by differences in pixel values between a frame in the minimum blood volume during one cardiac cycle and a frame at the end of the systole phase. Thus, the image can provide information on relative blood volumes during one cardiac cycle. Dilation and contraction of vessels would not be considered to affect the measurement of pixel values in projected images with a relatively large size because the rate of change is reported to be approximately ±10 % [18]. In addition, a minimum-intensity projection (MINIP) image is created in one cardiac cycle, which is composed of pixel values showing the least blood during one cardiac cycle. Temporal subtraction is performed between a MINIP image and a frame at the end of the systole phase. The blood distribution in one cardiac cycle is also created by superimposing of the difference values on dynamic chest radiographs in the form of a color display.
To reduce the influence of movement, dilation, contraction of vessels as well as the influence of image noise, analysis in block units is recommended. A velocity-based approach in block units was reported by Tanaka et al. [32]. First, the images are divided into block units, and the average pixel value in each block P k (m, n) is calculated, as shown in Fig. 12.12. Here, m and n are the coordinates of blocks in the horizontal and vertical directions, respectively, and k is the frame number. The block size is the smallest determined experimentally in which defects in the blood flow could be detected by the present method under ideal conditions without the influence of the ribs [29]. When fluctuation is noted in adjacent frames in P k (m, n) due to X-ray output and image noise, it can be eliminated by smoothing pixel values, averaging adjacent values, in the time axis direction, as shown in Fig. 12.12. P ave (m, n), the average pixel value of P k (m, n) in one cardiac cycle, is then calculated, and the differences between P k (m, n) and P ave
 Computational Intelligent Image Analysis for Assisting Radiation Oncologists’ Decision Making in Radiation Treatment Planning
 The Role of Content-Based Image Retrieval in Mammography CAD
 Liver Volumetry in MRI by Using Fast Marching Algorithm Coupled with 3D Geodesic Active Contour Segmentation
 Subtraction Techniques for CT and DSA and Automated Detection of Lung Nodules in 3D CT
 Bone Suppression in Chest Radiographs by Means of Anatomically Specific Multiple Massive-Training ANNs Combined with Total Variation Minimization Smoothing and Consistency Processing
 Image Segmentation for Connectomics Using Machine Learning


Related posts:
Computational Intelligent Image Analysis for Assisting Radiation Oncologists’ Decision Making in Radiation Treatment Planning
The Role of Content-Based Image Retrieval in Mammography CAD
Liver Volumetry in MRI by Using Fast Marching Algorithm Coupled with 3D Geodesic Active Contour Segmentation
Subtraction Techniques for CT and DSA and Automated Detection of Lung Nodules in 3D CT
Bone Suppression in Chest Radiographs by Means of Anatomically Specific Multiple Massive-Training ANNs Combined with Total Variation Minimization Smoothing and Consistency Processing
Image Segmentation for Connectomics Using Machine Learning
Stay updated, free articles. Join our Telegram channel
Full access? Get Clinical Tree
