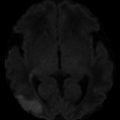
Fig. 1
A 38-year-old woman with SCD, presenting with altered mental status. (a) Axial FLAIR image shows multiple high signal intensity lesions of the bilateral periventricular white matter (arrows). (b, c) Corresponding axial DWI (b = 1,000) (b) with ADC map (c) shows multiple foci of restricted diffusion in the left periventricular white matter consistent with acute infarcts (arrows). Right periventricular lesions suggest chronic ischemia or prior infarcts
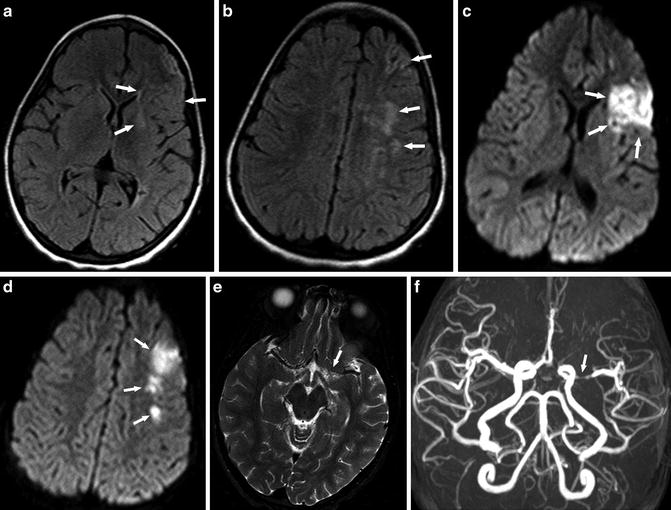
Fig. 2
A 6-year-old girl presenting with right-sided weakness. (a, b) Axial FLAIR images show multiple high-signal-intensity lesions at the left frontal border zone (watershed) areas (arrows). (c, d) Corresponding axial DWI (b = 1,000) shows restricted diffusion in the left MCA territory and border zone larger than that shown on FLAIR images consistent with acute infarct (arrows). (e) Axial T2-WI image shows loss of flow voids in the left proximal MCA (arrow). (f) MRA shows obvious stenosis of left MCA (arrow) and decrease of flow-related signal distally
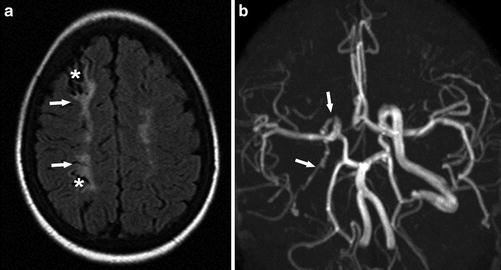
Fig. 3
A 16-year-old woman presenting with headache and syncope. (a) Axial FLAIR image demonstrates encephalomalacia (asterisks) with surrounding gliosis (arrows) in the right frontoparietal ACA-MCA border zone (watershed) distribution indicating old ischemic changes. (b) MRA shows decreased caliber and flow-related signal with wall irregularity of the visualized right extracranial ICA (arrows)
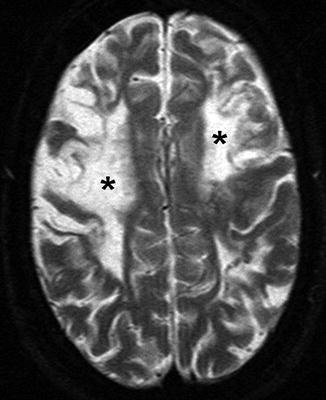
Fig. 4
A 22-year-old woman presenting with seizure. Axial T2-WI image shows bilateral frontal high signal intensity, indicating chronic ischemic changes and encephalomalacia (asterisks), predominantly in ACA-MCA border zone (watershed) distribution
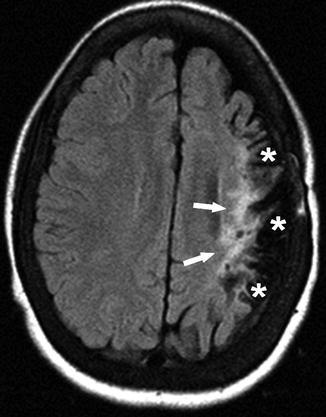
Fig. 5
A 14-year-old girl presenting with past episode of right hemiplegia. Axial FLAIR image shows high signal (arrows) and prominent sulci (asterisks), indicating volume loss and gliosis with cortical involvement in the left cerebral hemisphere
Arterial stenosis or occlusion is often seen in conjunction with infarcts of the cerebral gray matter (the cortex, basal ganglia, and thalamus) (Fig. 2). However, white matter infarcts can be seen in the setting of arterial stenosis or occlusion as well, particularly in border (watershed) zones [8] (Fig. 3). The anterior circulation is more often involved than the posterior circulation. The radiologist should screen for loss of vascular flow voids on T2-WI images, which may indicate vasculopathy (Fig. 2e). FLAIR imaging can show high signal in cortical vessels in the setting of altered flow velocities, such as slow distal flow of a stenotic arterial branch or leptomeningeal collaterals [37] (Fig. 6). In these cases, the radiologist may decide to add brain MRA or recommend other angiographic imaging such as CTA or catheter angiogram for further evaluations regarding diagnosis, treatment, and management.
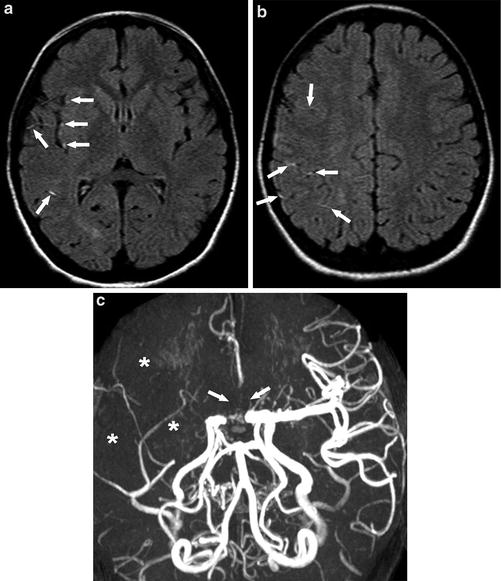
Fig. 6
A 10-year-old girl presenting with left facial droop, drooling, and hand tingling. (a) (b) Axial FLAIR images show multiple high signal intensity vessels in the Sylvian fissure and frontoparietal sulci (arrows), indicating slow flow or thrombosis. (c) MRA shows loss of flow-related signal in the right MCA distribution (asterisks) and bilateral proximal ACAs (arrows)
Hemorrhagic Stroke
Hemorrhagic stroke in SCD is relatively more common in adults than in children. Although it is rare, primary hemorrhagic stroke, such as subarachnoid and parenchymal hemorrhage, is frequently fatal in SCD patients. Aneurysms are the most common identified cause of subarachnoid hemorrhage in adult patients with SCD [27], although their exact prevalence is unknown. Compared with patients without SCD, aneurysms in SCD patients are often multiple, have an increased propensity for the posterior cerebral circulation, and may be prone to rupture at smaller sizes [38]. Moyamoya syndrome is a common cause of parenchymal hemorrhage in SCD in children [8], which will be discussed later in more detail.
Non-contrast CT is the first imaging modality of choice in the diagnosis of acute hemorrhagic stroke (Figs. 7 and 8). In the current clinical practice, MRI may occasionally be obtained prior to CT when there is high suspicion for acute stroke based on clinical symptoms. Radiologists should be familiar with the MR imaging features of acute hemorrhage that are the same as non-SCD patients, to avoid delayed diagnosis of hemorrhagic strokes. The accuracy of MRI in detecting acute parenchymal hemorrhage is similar to CT, especially when gradient echo sequences, such as T2*-WI imaging and SWI, are used [39]. Catheter angiogram using three-dimensional (3D) digital subtraction angiography is still the gold standard for the diagnosis and preoperative delineation of intracranial aneurysms. Noninvasive techniques such as MRA and CTA are more commonly used, and recently their accuracy is considered satisfactory [40, 41]. CTA is often the first-line modality to search for underlying aneurysms in the setting of acute subarachnoid hemorrhage, while MRA is commonly used in the non-acute setting (Figs. 9 and 10).
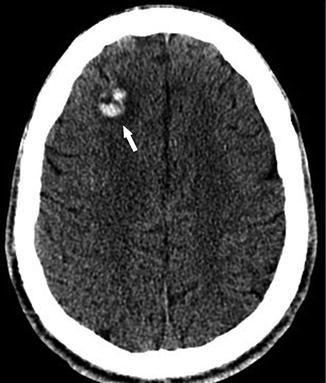
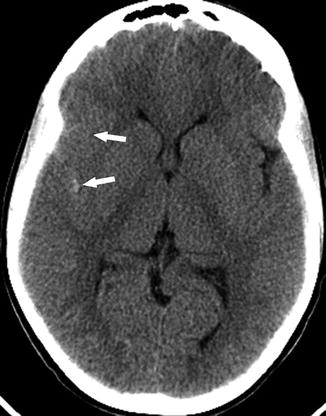
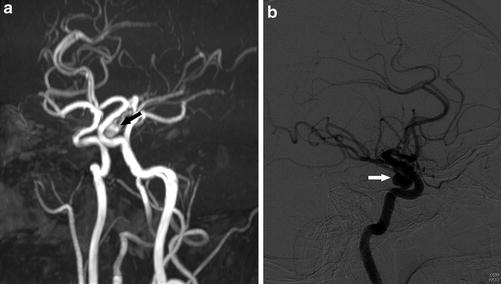
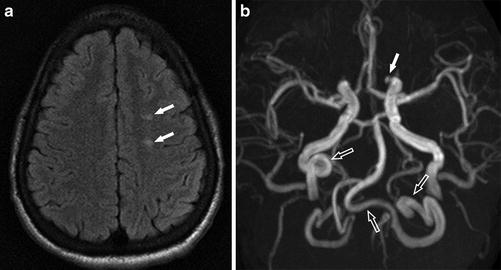
Fig. 7
A 20-year-old man presenting with altered mental status. Axial non-contrast CT shows a high density area in the right frontal lobe white matter with surrounding low density indicating edema (arrow), compatible with acute hemorrhage
Fig. 8
A 14-year-old boy presenting with severe headache. Axial non-contrast CT shows high density in the right Sylvian fissure consistent with acute subarachnoid hemorrhage (arrows)
Fig. 9
A 34-year-old man presenting with headache. (a) MRA shows an ovoid focus of flow-related signal arising from the junction of the cavernous–clinoid segments of the left ICA extending inferiorly, consistent with an aneurysm (arrow). (b) Catheter angiogram of the left ICA lateral view confirmed the aneurysm (arrow)
Fig. 10
A 22-year-old man presenting with headache and vertigo. (a) Axial FLAIR image shows multiple high signal foci (arrows) in the left frontal white matter without abnormal diffusion restriction (not shown) consistent with silent cerebral infarcts. (b) MRA shows a 3 mm aneurysm at the medial portion of the left IC-ophthalmic segment (arrow). Tortuous extracranial right internal carotid artery and bilateral vertebral arteries are also noted (open arrows)
Silent Cerebral Infarct (SCI)
SCI is the most common neurovascular complication in both pediatric and adult patients with SCD. SCIs have been seen in children under the age of 6 years [42]. They may represent a different pathogenesis from either ischemic or hemorrhagic strokes as they involve small vessels in watershed distributions instead of the larger cerebral vessels [43]. Measurement of arterial velocities with transcranial Doppler (TCD) ultrasound are not predictive of SCI risk, unlike with overt ischemic stroke, which supports a different pathophysiology between overt stroke and SCI [44]. Several studies showed that SCIs are more frequent in patients with arterial stenosis and intracranial arterial tortuosity, suggesting that large vessel disease may play a role in the pathophysiology of these lesions [42, 45, 46]. Children with arterial stenosis are at higher risk of brain parenchymal injury as they have more SCIs [47] (Fig. 10).
The presence of SCI is considered a predictor of future strokes [17, 48, 49]. SCIs have been shown to progress in both number and size over time [49]. Associated neurocognitive abnormalities also may be progressive [50]. Small foci of acute SCI may be found in asymptomatic children with SCD [42]. SCIs may continue to progress in spite of initiation of chronic transfusion therapy after a stroke [51]; however, a recent study showed that in patients without a stroke and not at high risk of a stroke, chronic transfusions reduced the occurrence of new SCIs by 56 % over a median observation period of 3 years [23].
SCIs are defined as T2 high signal intensity lesions of at least 3 mm in the greatest linear dimension in children and 5 mm in adults, visible on at least two planes of T2-WI images [20, 52] (Figs. 11 and 12). Because of their small size, detection of SCI depends largely on the MR imaging technique, such as the use of FLAIR, slice thickness, multiplanar acquisitions, and the magnetic field strength [53]. With further advances in imaging and more utilization of 3.0-T or higher magnet field units, it is likely that more cases of SCI will be detected in individuals with SCD [49].
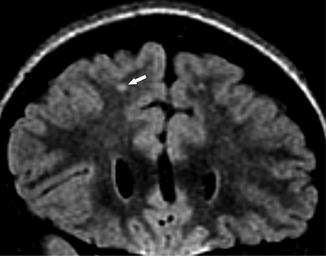
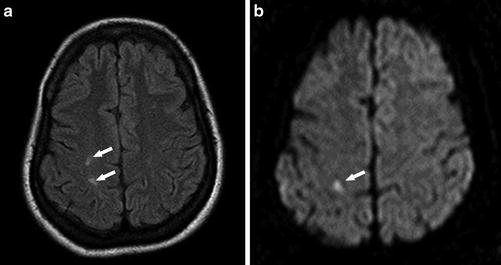
Fig. 11
A 6-year-old girl presenting with SCD for screening MRI. Coronal FLAIR image shows high signal foci in the right frontal subcortical white matter (arrow), compatible with silent cerebral infarct
Fig. 12
A 42-year-old woman presenting with left facial numbness. (a) Axial FLAIR image shows multiple high signal intensity lesions in the right frontoparietal white matter (arrows). (b) DWI (b = 1,000) shows corresponding restricted diffusion in the postcentral gyrus consistent with acute infarct (arrow)
Cerebral Fat Embolism
Fat embolism syndrome is a very rare but potentially lethal complication of SCD that is not widely recognized [54]. In non-SCD patients, fat embolism syndrome is usually a complication of long bone fractures. The pathogenesis of fat embolism syndrome in SCD remains controversial. It is thought to be caused by bone marrow infarcts and necrosis, with subsequent embolization through osseous venous channels into the venous circulation. Neurologic dysfunction in the setting of fat embolism syndrome may result directly from vessel occlusion by fat emboli, from disruption of the blood–brain barrier by toxic free fatty acids, or both [54, 55].
Typical MR imaging findings of cerebral fat embolism include tiny foci of restricted diffusion and corresponding T2 high signal intensities representing microinfarcts. Lesions can involve the cerebral white matter, basal ganglia, thalamus, brain stem, and cerebellum. This MR imaging pattern, sometimes called a “starfield” pattern, is not very specific and can also be seen in cardiogenic or septic emboli, vasculitis, and tiny hemorrhagic metastases [54]. T2*-WI images and SWI frequently demonstrate microhemorrhages in cerebral fat embolism [55].
Moyamoya Syndrome
Vascular pathology in SCD includes arterial tortuosity, stenosis, occlusion, and aneurysm formation. A special form of cerebrovascular manifestation in SCD patients is “moyamoya syndrome,” a progressive stenosis of major intracranial arteries with formation of numerous collateral circulations, typically via lenticulostriate and thalamoperforating arteries (Fig. 13). Moyamoya syndrome typically involves the distal ICA (internal carotid artery) and proximal ACA (anterior cerebral artery) and MCA, with relative sparing of the posterior circulation. The name moyamoya syndrome is derived from moyamoya disease, a rare, presumed genetic, progressive cerebrovascular disorder. The term “moyamoya” means “puff of smoke” in Japanese and refers to the appearance of collateral vessels on cerebral angiogram [56]. The pathophysiology of moyamoya syndrome in SCD is poorly understood. It is hypothesized that sickle-shaped RBCs occlude the vasa vasorum of the carotid arteries [31], leading to intimal hyperplasia [57]. The prevalence of moyamoya syndrome in SCD patients has been reported for 35 % of conventional catheter angiogram studies [7] and in 20–40 % of MRA studies [8, 58]. It was shown that 75 % of patients with moyamoya syndrome demonstrated radiographic progression of arteriopathy and 65 % of patients showed clinical progression during follow-up [59] (Fig. 14).
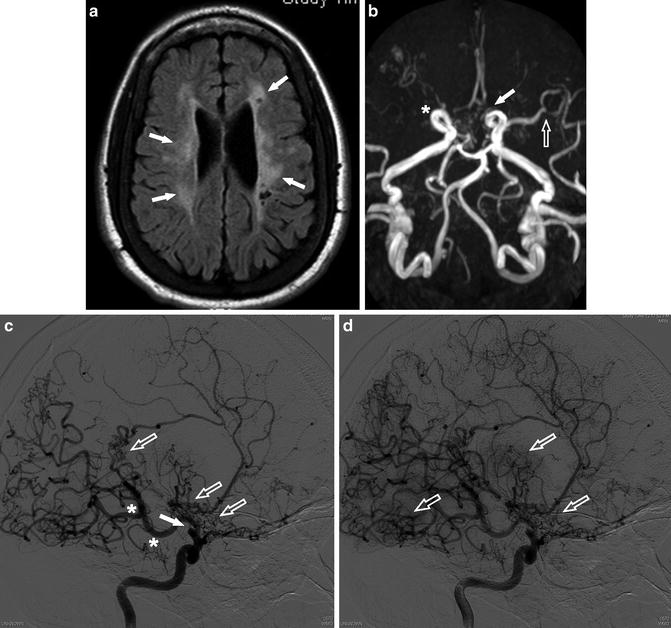
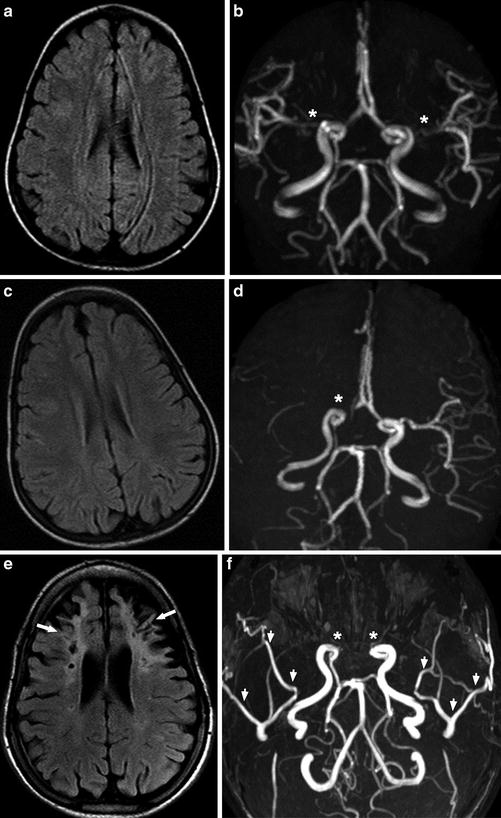
Fig. 13
A 24-year-old man presenting with multiple episodes of ischemic infarct. (a) Axial FLAIR image shows bilateral periventricular high signal intensity with cystic foci compatible with old ischemic change (arrows). (b) MRA shows occlusion of the right ICA terminus (asterisk) and severe stenosis of the left ACA (arrow) and distal MCA (open arrow). (c) Catheter angiogram of the right ICA shows occlusion of the supraclinoid ICA (arrow). Posterior communicating artery (PComm) is markedly prominent (asterisk) and diffuse moyamoya-like collateral vessels are noted (open arrows). (d) Subsequent image of the ICA catheter angiogram shows more apparent “moyamoya” (puff-of-smoke) appearance of the collateral vessels (open arrows)
Fig. 14
A 15-year-old man presenting with recurrent headache. (a, b) In 2005, Axial FLAIR image (a) shows normal brain and MRA (b) shows possible stenosis of the right proximal ACA and bilateral proximal MCA (asterisk). (c, d) In 2006, axial FLAIR image (c) still shows normal brain, but MRA (d) shows obvious occlusion of the right terminal ICA (asterisk). The patient received bilateral pial synangiosis for cerebral revascularization in 2007. (e, f) In 2013, axial FLAIR image (e) shows bilateral frontal old infarcts with encephalomalacia and gliosis (arrows). MRA (f) shows bilateral occlusion of the terminal ICAs (asterisks) and bilateral prominent superficial temporal arteries (arrowheads) after revascularization. Serial FLAIR images and MRA images over 8 years demonstrate progression of arterial stenosis, bilateral frontal lobe infarcts, and atrophy in spite of revascularization
Moyamoya syndrome can be detected on MRA as progressive large vessel occlusions and major collateral flow patterns, the so-called moyamoya vessels. On T2-WI images, moyamoya syndrome presents with loss of flow voids in the circle of Willis (Fig. 15) and on time-of-flight MRA as a loss of flow-related signal (Fig. 16). Collaterals typically present as multiple flow voids on T2-WI and T1-WI images in the thalamoperforate and lenticulostriate territories. High signal intensity vessels within the cortical sulci on FLAIR images can indicate a decreased flow of cortical arteries [37] (Fig. 6).
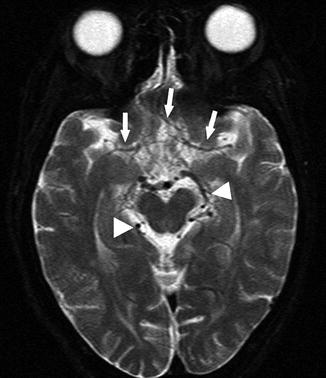
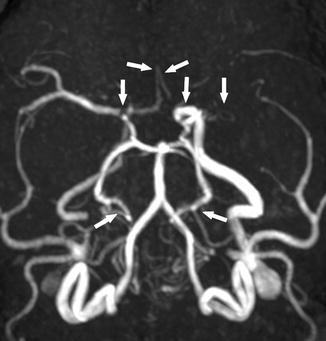
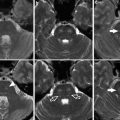
Fig. 15
A 22-year-old woman presenting with seizure. Axial T2-WI image shows loss of normal flow voids of the bilateral MCA and ACA (arrows). In contrast, prominent posterior circulation flow voids are noted (arrowheads)
Fig. 16
A 38-year-old woman with SCD presenting with altered mental status. MRA shows multiple stenoses and occlusions of the right ICA terminus, bilateral ACAs, bilateral PCAs (posterior cerebral artery), and left MCA (arrows)
Incidentally discovered asymptomatic moyamoya syndrome in children has the potential to progress, both radiographically and clinically. Monitoring and screening with imaging in high-risk patients facilitates early referral to neurosurgery and allows for timely revascularization therapy [59]. Patients with moyamoya syndrome may have a particularly poor prognosis and may benefit from revascularization of ischemic brain parenchyma by establishing collaterals from the external carotid artery (ECA) branches to the ICA territories [60]. Superficial temporal artery (STA) to middle cerebral artery (MCA) bypass is a direct revascularization procedure, which is technically difficult. Indirect revascularization procedures such as encephaloduroarteriosynangiosis (EDAS) and pial synangiosis are becoming popular for the surgical treatment of moyamoya syndrome [61]. Pial synangiosis is a technique in which the dura and the arachnoid are opened and the STA adventitia is sutured directly to the pia [62], and it has a relatively low risk of complications [63]. Pial synangiosis typically results in an increase in collaterals from the STA or middle meningeal artery (MMA) to the brain [62]. MRA or CTA can be used to monitor the patency of synangiosis between STA branches and pial arterial branches after cerebral revascularization (Fig. 14) .
Extracranial Vasculopathy
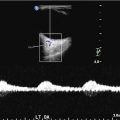
Extracranial ICA stenosis is rare, but it has been reported that there is an association between the presence of extracranial internal carotid arteriopathy and stroke risk in SCD [64–66]. Doppler ultrasound screening studies found stenosis or occlusion of the cervical ICA in 3–6 % of the children, and the majority of these also had strokes [65]. One MRA study reported that patients with an acute neurologic event, TCD abnormalities, and previous history of stroke also showed cervical ICA stenosis and/or occlusion. The most commonly involved artery is the proximal ICA, within 1 cm from its origin from the CCA [66] (Fig. 17). In addition, a recent study showed that the high velocity of extracranial ICA detected with submandibular Doppler ultrasound is highly predictive of intracranial arterial stenosis seen on MRA [67]. The differential diagnosis of extracranial ICA stenosis and/or occlusion includes atherosclerosis, arteritis, and fibromuscular dysplasia. Age, location, and lack of systemic inflammation or hypercoagulability help differentiate SCD-related extracranial internal carotid arteriopathy from other conditions [68].
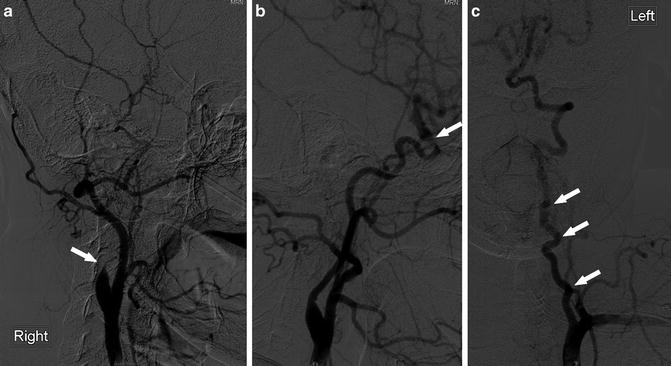
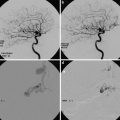
Fig. 17
A 30-year-old woman with SCD, evaluation for revascularization. (a) Catheter angiogram of the right CCA (lateral view) shows complete occlusion of the extracranial ICA near its origin (arrow). (b) Catheter angiogram of the left CCA (lateral view) shows stenosis of the ICA at the ophthalmic segment (arrow). (c) Catheter angiogram of the left subclavian artery shows tortuosity of the left VA (arrows)
Arterial tortuosity is considered to be an adaptive response to chronic anemia in patients with SCD. Chronic anemia is associated with increased cardiac output and high blood flow velocity due to the increased need for blood supply, which can lead to arterial tortuosity and can occur in all cervical arteries [68]. Cerebrovascular tortuosity may serve as a predictor of chronic brain hypoxia [53]. On imaging, tortuosity can be diagnosed when the following features are present: dilatation or ectasia of an artery segment, abnormal increase in length of an arterial segment, and obvious bowing of an artery [53, 69] (Figs. 17, 18, and 19) .
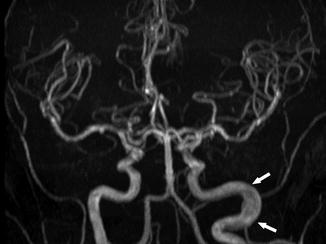
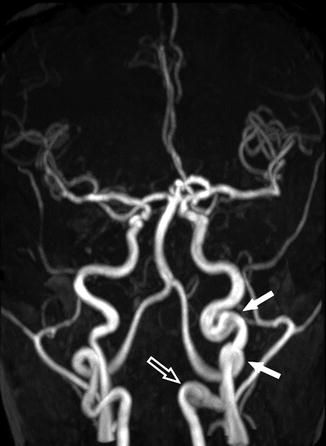
Fig. 18
A 34-year-old woman with SCD, presenting for annual MRI follow-up. MRA shows no significant stenosis or occlusion of the intracranial arteries; however, dilatation and elongation of the extracranial left ICA are seen (arrows)
Fig. 19
A 20-year-old man with SCD. MRA shows tortuous left extracranial ICA (arrows) and aneurysmal dilatation of the extracranial segment of the left VA (open arrow)
Posterior Reversible Encephalopathy Syndrome (PRES)
There have been several case reports of posterior reversible encephalopathy syndrome (PRES), also known as reversible posterior leukoencephalopathy syndrome (RPLS), in patients with SCD [70–74]. The vast majority of the patients are in the pediatric population [71]. It is believed that there are two major pathomechanisms in PRES: a cytotoxic event after an increase in blood pressure that causes vasoconstriction and cerebral ischemia or a vasogenic etiology where hypertension in combination with endothelial dysfunction and failure of cerebral autoregulation causes vasodilation [70]. Studies have identified PRES as a common neurological complication of SCD, and this entity needs to be considered when evaluating a child with acute neurological deterioration, especially if the patient is hypertensive, has history of ACS, and has received systemic steroid therapy or blood transfusion [72–74]. A diagnosis of PRES may predict a high risk for morbidity and mortality [73]. On MR imaging, PRES usually presents as symmetrical areas of high signal intensities on T2-WI and FLAIR images without associated restricted diffusion, suggesting vasogenic edema, which is the same as non-SCD patients [73] (Fig. 20) .
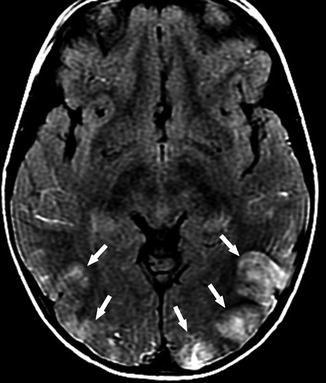
Fig. 20
A 5-year-old girl with SCD, presenting with headache and hypertensive status. Axial FLAIR image shows high signal intensity lesions in the bilateral occipital lobes (arrows). Given the distribution, clinical course, and documented hypertension, the findings are compatible with PRES
Other Sickle Cell Disease Imaging Manifestations
There are several osseous complications related to SCD. These include chronic bone marrow changes in response to long-standing anemia and acute bone infarcts as well as osteomyelitis. Osteoporosis and iron deposition in the bone marrow due to repeated transfusions can also be seen [13, 15, 68, 75, 76].
Craniofacial Bone
Bone Marrow Hyperplasia
As a result of chronic anemia in SCD patients, the red marrow in bony erythrocyte production never undergoes the conversion to fatty yellow marrow [68, 75]. Furthermore, as the anemia becomes more severe and long-standing, the bone marrow spaces expand secondary to increased RBC production [68, 75]. This marrow expansion is most frequently noted clinically in the skull and facial bones. The non-conversion of the bone marrow is demonstrated by diffuse low signal intensity on T1-WI images relative to the signal in the intervertebral disks [15] (Figs. 21 and 22).
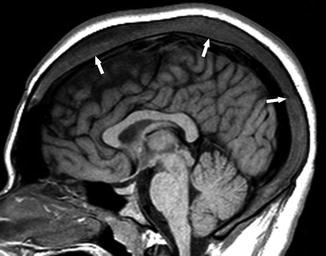
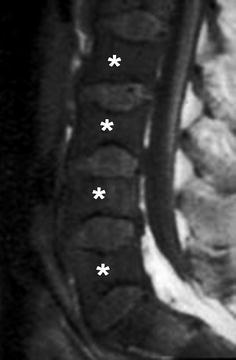
Fig. 21
An 18-year-old man with SCD. Sagittal T1-WI image shows the diffuse expansion of the marrow space of the skull (arrows)
Fig. 22
A 10-year-old boy with SCD, presenting with back pain. Sagittal T1-WI image of the lumbar spine shows low signal in the vertebral bodies (asterisks) relative to the intervertebral disk, compatible with an activated bone marrow triggered by chronic anemia. Note also the “H”-shaped deformity of vertebral bodies, compatible with end-plate infarcts and subsequent height loss
Bone Infarct
Bone infarcts are more common than osteomyelitis among children with SCD. Ischemia causes pain, even before infarct occurs. For SCD patients presenting with headache or localizing facial pain, acute craniofacial bone infarct should be a major diagnostic consideration [13, 15]. The orbital walls, mandible, cranial vault, and skull base are commonly affected by bone infarcts in SCD patients [13, 15] (Fig. 23). In the spine, it is hypothesized that bone infarcts contribute to the characteristic “letter H” deformity of vertebral bodies that is typical of patients with SCD [77] (Fig. 22).
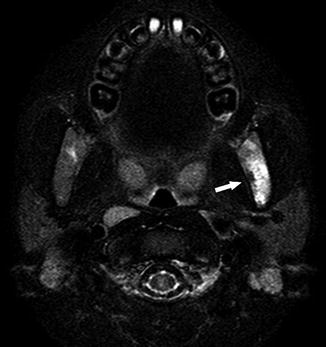
Fig. 23
A 6-year-old boy presenting with temporomandibular joint pain and headache. Axial fat-suppressed T2-WI image demonstrates high signal intensity in the left mandibular ramus (arrow), compatible with bone infarct
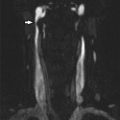
MR imaging is more sensitive than CT in detecting bone infarcts. MR imaging findings of acute bone infarcts include increased signal on T2-WI images, particularly with fat-suppression techniques such as STIR, and associated high signal intensity on DWI with corresponding low signal intensity on ADC map (Fig. 24). There may also be subperiosteal hemorrhage. The high signal intensity of the affected bones on fat-suppressed T1-WI images, which may represent the sequestered RBCs in the infarcted marrow [13, 78], can be very helpful in the differentiation of bone infarcts from osteomyelitis (Fig. 25).
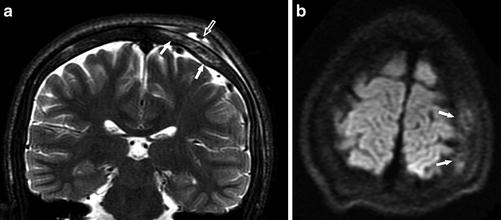
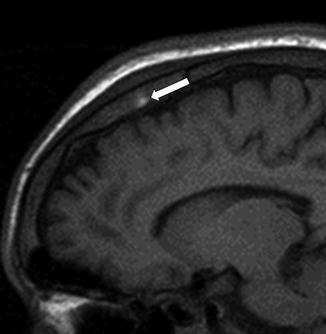
Fig. 24
A 15-year-old boy with SCD, presenting with headache. (a) Coronal T2-WI image shows high signal intensity in the skull consistent with bone marrow edema (arrows), as well as mixed abnormal signal intensity in the subgaleal fluid collection consistent with hemorrhage (open arrow). (b) Axial DWI (b = 1,000) shows an area of increased signal in the skull, compatible with bone infarct (arrows)
Fig. 25
A 17-year-old man presenting with headache. Sagittal T1-WI image shows high signal intensity of the bone marrow in the parietal bone consistent with bone infarct with hemorrhage (arrow) (Adapted with permission from Lippincott Williams and Wilkins/Wolters Kluwer Health: Journal of Computer Assisted Tomography [13], copyright (2013))
Osteomyelitis
Osteomyelitis is less common than bone infarcts and typically affects long bones. However, osteomyelitis may also occur in craniofacial bones, particularly the mandible, because of its relatively poor blood supply [13, 68] (Fig. 26). Differentiation between infarct and osteomyelitis in early presentation with imaging alone can be quite challenging. The typical MR imaging findings, including bone marrow edema, heterogeneous bone marrow enhancement, and soft tissue swelling, can be seen in osteomyelitis as well as bone infarcts. In the presence of fluid collections, MR susceptibility artifact is suggestive of blood products from subperiosteal hematoma, which is more commonly seen with bone infarcts. Infectious fluid collections may exhibit restricted diffusion [13].
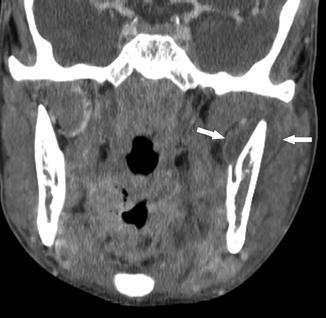
Fig. 26


A 25-year-old man presenting with left jaw swelling and pain. Coronal contrast-enhanced CT shows peripherally enhancing low density fluid collections medial and lateral to the left mandibular ramus (arrows), consistent with subperiosteal abscess formation
Related posts:
Stay updated, free articles. Join our Telegram channel
Full access? Get Clinical Tree
