Presence of normal vessels coursing through “lesion” (fatty infiltration)
• NECT: Liver attenuation < spleen
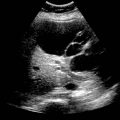
• US: ↑ echogenicity, ↑ attenuation of sound beam
• Best imaging clue
Decreased signal intensity of liver on T1 opposed-phase GRE images
• Nonalcoholic steatohepatitis (NASH) looks similar to simple steatosis and alcoholic steatohepatitis
TOP DIFFERENTIAL DIAGNOSES
• Lymphoma or metastases
Diffuse or multifocal lesions can be seen with steatosis or tumor
• Hepatitis
Viral or other toxic etiologies
• Opportunistic infection, hepatic
PATHOLOGY
• Focal steatosis or sparing: Most commonly due to variations in hepatic venous drainage
CLINICAL ISSUES
• Most common cause of chronic liver disease in Western countries
Increasing in prevalence with epidemic of obesity and metabolic syndrome
• NASH will likely become leading cause of cirrhosis and hepatocellular carcinoma in Western countries
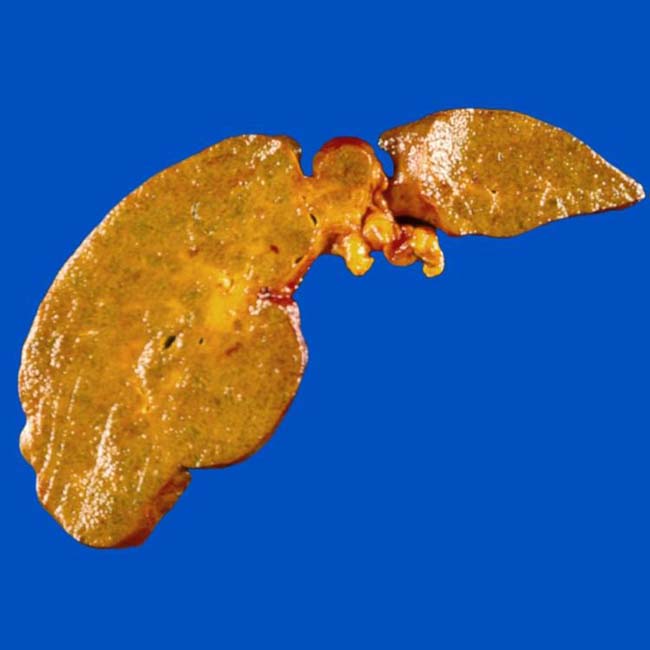
(Left) Cut section of an explanted liver shows a yellowish, greasy, pale appearance due to steatosis. Steatohepatitis can lead to progressive and irreversible liver failure.
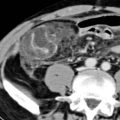
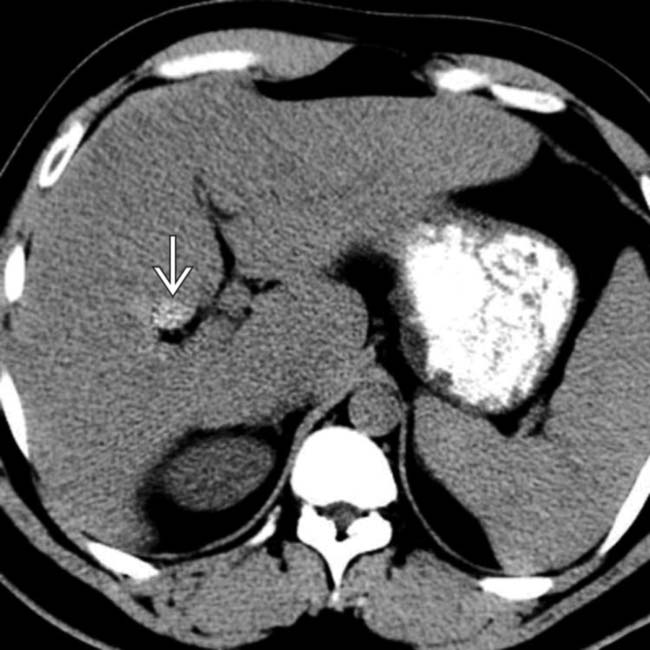
(Right) Axial NECT in the same patient shows diffuse low attenuation of the liver relative to the spleen and muscle. Note the area of fatty sparing around the gallbladder fossa . The liver also shows signs of cirrhosis, with widened fissures and a prominent caudate lobe.
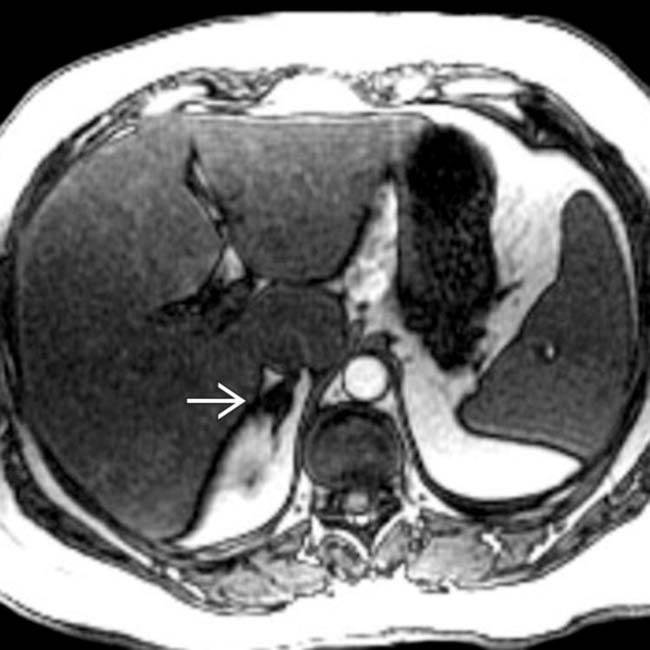
(Left) T1WI GRE in-phase MR of diffuse steatosis shows no apparent hepatic abnormality. Note the small right adrenal nodule .
(Right) T1WI GRE opposed-phase MR in the same patient shows selective drop-out of signal from the liver, indicating the presence of excess lipid within the liver and also within an adrenal adenoma . The most specific imaging test to detect hepatic steatosis is MR, especially GRE in- and opposed-phase images.
TERMINOLOGY
Synonyms
• Hepatic steatosis or hepatic fatty metamorphosis
• Nonalcoholic steatohepatitis (NASH)
Definitions
• Characterized by accumulation of increasing amounts of triglycerides within hepatocytes
• Steatosis is a metabolic complication of a variety of toxic, ischemic, and infectious insults to liver
IMAGING
General Features
• Best diagnostic clue
Decreased signal intensity of liver on T1WI opposed-phase GRE images
• Location
Focal, multifocal, or diffuse
• Key concepts
Diffuse (more common) or focal fatty infiltration
Often lobar, segmental, or wedge shaped
– More common along hepatic vessels, ligaments, and fissures
Rarely, unifocal or multifocal spherical lesions, simulating metastases or primary tumor
Fatty replacement occurs where glycogen is depleted from liver
Key on all imaging modalities
– Presence of normal vessels coursing through “lesion” (fatty infiltration)
Variable imaging features of fatty liver based on
– Amount of fat deposited in liver
– Fat distribution within liver
– Presence of associated hepatic disease
e.g., porta hepatic lymphadenopathy and lymphedema in viral hepatitis
In general, imaging cannot determine etiology of steatosis
Nonalcoholic steatohepatitis (NASH) looks similar to simple steatosis and alcoholic steatohepatitis
CT Findings
• NECT
Diffuse or focal
– Decreased attenuation of liver compared to spleen
Hepatic attenuation is inversely proportional to degree of steatosis
– Normal: Liver 8-10 HU more than spleen on NECT
High sensitivity (88-95%) and specificity (90-99%)
In severe steatosis (> 30%), attenuation of hepatic vessels may be ≥ that of liver
– Normal liver attenuation: 50-65 HU
Attenuation < 48 HU = steatosis
– Hepatic attenuation index: Calculation of ratio of hepatic to splenic attenuation
< 0.8 = severe (> 30%) steatosis
Focal fatty infiltration: Low attenuation
– Common location: Adjacent to falciform ligament
– Due to nutritional ischemia at vascular watershed
Lobar, segmental, or wedge-shaped fatty infiltration
– May have straight-line margin
– Extending to liver capsule, usually without mass effect
– Often greater in right than left lobe
Reflects greater portal venous flow to right lobe
• CECT
Attenuation measurements and comparisons are less reliable than for NECT
– Dependent on timing relative to contrast administration
Accuracy only ∼ 75-80% for mild to moderate steatosis
– Due to earlier enhancement of spleen (lack of portal blood supply)
Arterial phase imaging is very unreliable
– On venous phase or delayed CECT, steatotic liver is usually > 35 HU less dense than spleen
Normal vessels course through “lesion” (fatty infiltration)
Dual-energy CT
– Scan at different tube currents (e.g., 80 + 140 kVp)
– Steatosis will be accentuated on lower kVp sequence
MR Findings
• T1WI in-phase gradient echo (chemical shift)
Increased signal intensity of fatty liver > spleen
On 1.5 Tesla (T) TEs of ∼ 4.6 (in phase) and 2.3 msec (opposed phase)
On 3 T magnets, shorter TEs can be used
– Can detect + quantitate steatosis better than on 1.5 T MR or CT
• T1WI out-of-phase gradient echo
Loss of signal intensity from foci of steatosis
Signal is lost from voxels that contain both fat and water
• T1 C+ out-of-phase GRE image
Paradoxical decreased signal intensity of liver
• Short T1 inversion recovery (STIR)
Shows fatty areas as low signal intensity
• MR spectroscopy (MRS)
Fatty liver demonstrates increase in intensity of lipid resonance peak
Used for quantitative assessment of fatty infiltration of liver
• Multi-echo gradient echo MR
Emerging method for reliable quantification of hepatic fat content
Ultrasonographic Findings
• Grayscale ultrasound
Diffuse fatty infiltration
– Diffuse increased hepatic echogenicity
– Increased attenuation of ultrasound beam
– Normal liver echogenicity is slightly > that of kidney or spleen
– Steatosis may obscure visualization of diaphragm and intrahepatic vessels
– US grading of steatosis is subjective and prone to interobserver variation
Hepatic steatosis and fibrosis frequently coexist
– Produce similar sonographic findings
Limits value of US in quantification and surveillance of steatosis
Only gold members can continue reading. Log In or Register to continue


 . The liver also shows signs of cirrhosis, with widened fissures and a prominent caudate lobe.
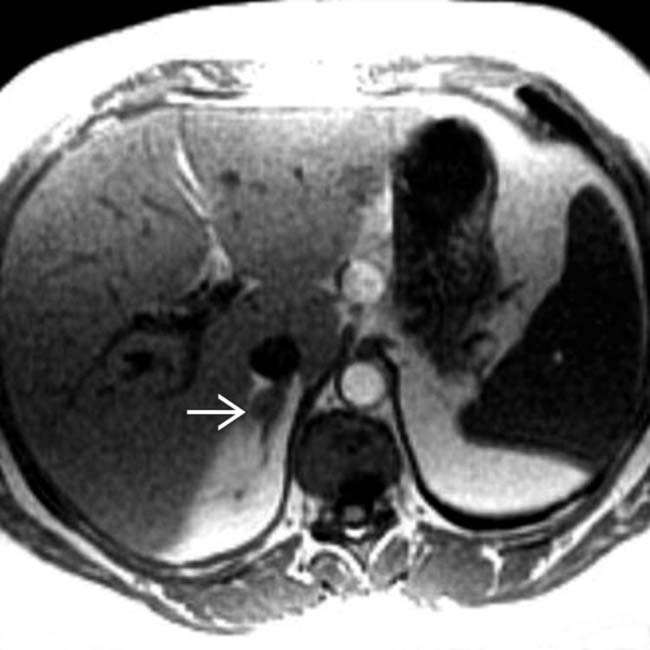
 .
.
 . The most specific imaging test to detect hepatic steatosis is MR, especially GRE in- and opposed-phase images.


 Diffuse or focal


 Hepatic steatosis and fibrosis frequently coexist