Techniques and Tricks for Optimizing Transesophageal Images
INTRODUCTION
The accuracy and diagnostic confidence of a transesophageal echocardiographic (TEE) study depends greatly on the quality of the ultrasound image. Image quality is affected by several factors, including patient anatomy, the quality of the ultrasound system, and the skill of the echocardiographer. This chapter discusses the controls on the echocardiography machine and the process of optimizing their settings to obtain images of the highest quality.
TWO-DIMENSIONAL CONTROLS
Preprocessing Versus Postprocessing Controls
Preprocessing controls adjust the transmission and acquisition of the ultrasound signals. Preprocessing settings control the formatting of the ultrasound signal for conversion into an electric signal. Changes in the preprocessing controls affect the information that the scanner will access to create an image (1), and this formatted information is the basis on which an image is created. Postprocessing settings affect the manner in which the formatted information is displayed on the monitor. Simply put, postprocessing defines the “cosmetic appearance” of the ultrasound data displayed on the monitor.
Transmit Power
Transmit power controls the amplitude (acoustic power) of the transmitted ultrasound signal. Modern echocardiography systems default to a high power setting to maximize the signal-to-noise ratio. A theoretic concern is that high power ultrasound can have deleterious effects on tissue, particularly in fetal echocardiography. Federal standards restrict the maximal intensities allowed for transmit power settings on commercially available ultrasound systems. Typically, echocardiography systems default to the maximum transmit power; however, proper adjustment of transmit power becomes critical when echo contrast studies are performed.
Gain
Increasing the gain increases the amplitude of the electric signal generated by returning ultrasound signals received at all depths. Unfortunately, any noise present is also amplified. Setting the gain too high or too low affects the ability to read the image correctly. When the gain is set too high, the image appears bright, and linear structures, such as the mitral valve, appear thickened. Increases in the gain also increase the amount of visible noise. For instance, with moderately excessive gain settings, the left ventricular (LV) cavity acquires a speckled appearance, which can make it difficult to differentiate the LV cavity from the myocardium. With further increases in the gain, the entire LV takes on a whitened appearance and the ability to differentiate structures is lost.
When the gain is set too low, only bright signals, such as those from the pericardium, are visible, and very low-amplitude signals, such as the signal from an LV thrombus or “smoke” in the LV, are lost (2). Therefore, the gain should be adjusted to obtain an image with a gray scale ranging from low-amplitude (dark gray) to high-amplitude (white) signals. The gray scale, displayed as a bar graph on the right side of the image, is useful for guiding adjustments. Figure 23.1 (Video 23.1a–c) demonstrates the effect of three separate gain settings on the same midesophageal two-chamber view.
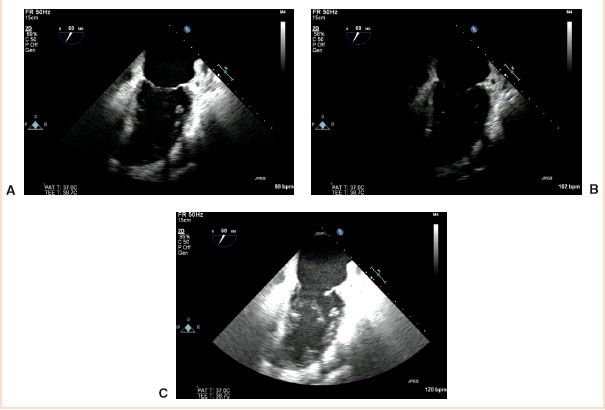
FIGURE 23.1 The midesophageal two-chamber view with the gain setting normal (A), too low (B), and too high (C). (Video 23.1a–c).
Clinical Pearl
The bright ambient lighting of the operating room often misleads the echocardiographer to use excessive gain settings. This problem can be overcome by eliminating the operating room lights briefly during the examination or shielding the screen with a hood.
Time Gain Compensation
Attenuation results in the signals returning from the far field being weaker than signals from the near field. Therefore, the ability to selectively adjust the gain setting at each depth is essential to optimize the image and is commonly referred to time gain compensation (3). For example, the echocardiographer can use the time gain compensation to amplify the weaker signals returning from the far field more than the signals returning from shallower depths (near field). The echocardiographer should be careful when adjusting the time gain compensation. If it is set too low, the elimination of true tissue signals is a risk. The time gain compensation should be used to eliminate gain-related artifacts and optimize far-field structures. The effects of time gain compensation settings on image quality are shown in Figure 23.2 (Video 23.2b, c).
Clinical Pearl
In a normal examination, the time gain compensation controls are set lower in the near field and higher in the far field. However, for imaging pathology in the near field with low echogenicity (e.g., thrombus in the aorta or left atrium), the near-field time gain compensation should be increased.
Lateral Gain Compensation
Ultrasound beams transmitted through tissue side by side can be subject to different levels of attenuation. Lateral gain compensation is used to counter this effect by amplifying the weaker signals to a greater extent and ensures brightness is uniform across the entire width of the image display. The effects of lateral gain compensation can be used to amplify weaker lateral signals and aid in detection of endocardial borders. The effects of lateral gain compensation on image quality are shown in Figure 23.3 (Video 23.3b, c).
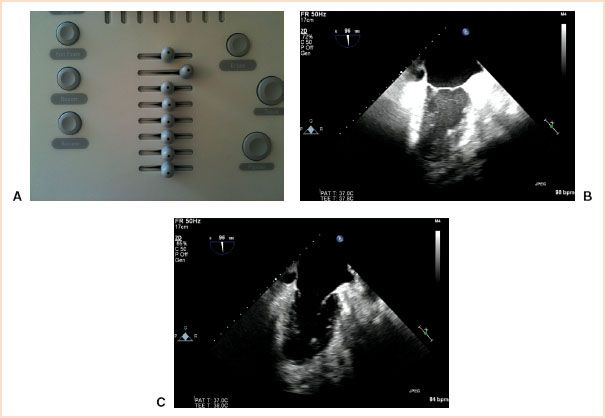
FIGURE 23.2 A: The time gain compensation is determined by a series of sliding controls. The upper controls affect the near field and the lower controls the far field. Note the high setting of the second control and its effect on the midfield in (B). B: The mitral valve apparatus is obscured by specular noise. C: The time gain compensation controls were subsequently reduced, after which the image quality improved markedly. Video 23.2b, c.
Depth
This control selects the maximal distance to be displayed. Increasing depth beyond the structure of interest has several negative consequences.
1. The image size is reduced. The most obvious consequence is that the image size is reduced because a larger area of the cardiac anatomy must be displayed on a screen of fixed size. The display of the cardiac structure of interest will be smaller and therefore more difficult to evaluate.
2. The frame rate is lower. In addition, as the depth is increased, the frame rate of the two-dimensional ultrasound is slowed because the system must wait longer for signals to be received. Doubling the depth of penetration doubles the wait time before another pulse can be sent, so that the pulse repetition frequency and subsequently the frame rate are decreased (4).
Therefore, to optimize image display and temporal resolution, the depth should be set just beyond the structure of interest, as shown in Figure 23.4.
It must also be appreciated that the lateral resolution of the ultrasound system is inversely proportional to the depth. Therefore, it is practical to have the position of the probe as close as possible to the structure of interest. For example, when the leaflets of the aortic valve are being evaluated, the ME aortic valve short-axis view is preferable to the deep transgastric (TG) long-axis view because the probe is closer to the aortic valve and lateral resolution is improved.
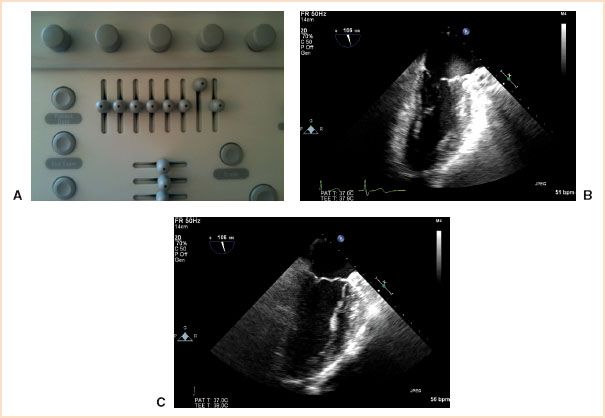
FIGURE 23.3 A: The lateral gain compensation is determined by a series of sliding controls. The left controls affect the left of the image sector while the right controls affect the right. Note the high setting on the second control from the right and its effect on visualizing the anterior wall in (B). B: The anterior wall is obscured by specular noise. C: The lateral gain compensation controls were subsequently reduced, after which the image quality improved. Video 23.3b, c.
Clinical Pearl
Resist increasing the depth beyond the setting that displays the structure of interest.
Focus
The focus control enables the operator to focus the ultrasound beam at a selected distance from the transducer. This is achieved by altering the sequences of electric impulses sent to the transducer elements. The goal of focusing is to have the beam narrowest at the location of the structure being evaluated because a thinner beam improves lateral resolution (5). The user must be cognizant of the focus depth of the system, which is typically marked on the edge of the sector (Fig. 23.4).
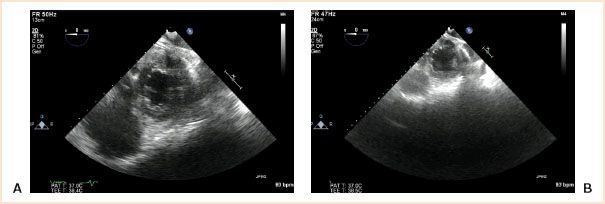
FIGURE 23.4 The transgastric mid short-axis view with too much depth (A) and with the depth correctly set (B). Note the focal point in image (B) is located at 6 cm, exactly in the center of the left ventricle. The focal point is marked by a bar with a green circle in the middle. Also note the frame rate has decreased from 50 Hz to 47 Hz (shown in upper left hand corner) with increasing the depth. Video 23.4a, b.
If the focal zone is located too far from the area of interest, the image resolution may not be sufficient for proper evaluation. When the atrial septum is being evaluated for a patent foramen ovale, the focus should be placed at this level. Remember that structures distal to the focal point lie in the far field and may appear “fuzzy” or abnormally thick. Avoid evaluating small structures distal to the focal point until the focal point is moved to that level.
Clinical Pearl
Adjust the focus point to the level of the structure of interest for high-resolution imaging.
Frequency
A feature of modern TEE systems is that they are capable of multiple frequencies, so that the transmitted ultrasound frequency can be adjusted. This can be especially important in TEE applications. The basic principle is that higher frequency beams maximize the length of the near field. When the structures being evaluated are in close proximity to the transducer (atria, aorta), higher frequencies are used to optimize resolution (6). When the structures being evaluated are farther from the transducer (deep TG views), higher frequencies may not be adequate because penetration is poor and attenuation is greater. In these situations, the frequency should be reduced until a satisfactory image is produced.
Clinical Pearl
Use higher frequencies when evaluating shallow structures and lower frequencies when evaluating deep structures (i.e., TG views).
Dynamic Range
Modern ultrasound transducers are capable of detecting reflected ultrasound signals with amplitudes over a range of approximately 100 dB (7). Unfortunately, the monitors used in these systems are capable of displaying only a much smaller range (~30 dB). Therefore, to display the range of ultrasound signals detected by the transducer, the dynamic range control allows the wide spectrum of ultrasound amplitudes to be compressed. The compressed signals are then displayed on the monitor as varying shades of gray.
Ultrasound systems have both a fixed dynamic range, which is limited by the hardware of the system, and a selectable dynamic range, which can be changed according to the echocardiographer’s preference. Increasing the dynamic range of the system increases the number of shades of gray between black and white within the image and therefore increases image detail, so that a smoother image appears on the display screen. Decreasing the dynamic range of the system increases the contrast of the image, with more black and white areas than shades of gray. The effect of dynamic range on image quality is shown in Figure 23.5.
Compression
Compression is a postprocessing tool that in conjunction with the preprocessing dynamic range control setting alters the range of the displayed gray scale (8). The compression control changes how the given dynamic range of ultrasound data is displayed. When the compression control is reduced, the given dynamic range is displayed with the largest range of allowable shades of gray. The lowest intensity signal is displayed as black, and the highest intensity signal is displayed as white. As the compression control is increased, the range of shades of gray used to produce the image is reduced to produce a softer, smoother image. The gray scale is therefore compressed by eliminating the display of shades of gray at each end of the spectrum. Compression settings are a personal preference of the echocardiographer.
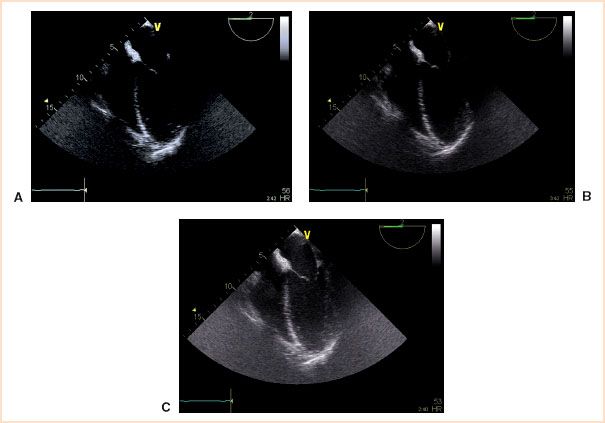
FIGURE 23.5 A midesophageal four-chamber view concentrating on the left atrium and left ventricle. With the dynamic range too low (A), normal (B), and too high (C). Note the increasing shades of gray as the dynamic range is increased. Video 23.5a–c.
Stay updated, free articles. Join our Telegram channel

Full access? Get Clinical Tree


