Radiotracer
Function
[18F]FDG
Glycolysis
18F-FLT
Proliferation
[11C]MET, 18F-FACBC
Amino acid transport
18F-FDHT
Androgen receptor
18F-FES
Estrogen receptor
Na124I
NIS
[11C]acetate
Kreb’s cycle, FA syn
18F-MISO
Hypoxia
Hallmarks of Cancer
There is growing acceptance of the view that cancer is “a complex collection of distinct genetic diseases, united by common hallmarks.” Thus, a general and uniting property of cancer is a common phenotype of set of “hallmarks,” i.e., the biologic characteristics of malignant tissues that distinguish them from the tissues from which they arise, are summarized in Fig. 1.1 [1]. Distinguishing features of cancer cells include rapid proliferation, immortality, resistance to apoptosis, resistance to suppression of proliferation, metastatic behavior, and a variety of stress responses; stress responses include a characteristic pattern of metabolism, such as the Warburg effect, and resistance to immunologic attack that allow cancer cells to better survive in hostile environment. The characteristic behaviors that make a cancer cell malignant are now generally believed to occur through a series of step-wise genetic alterations. In principle, the phenotypic alterations of each of these characteristics are associated with underlying key molecules that can be targeted with selective tracers and imaged.
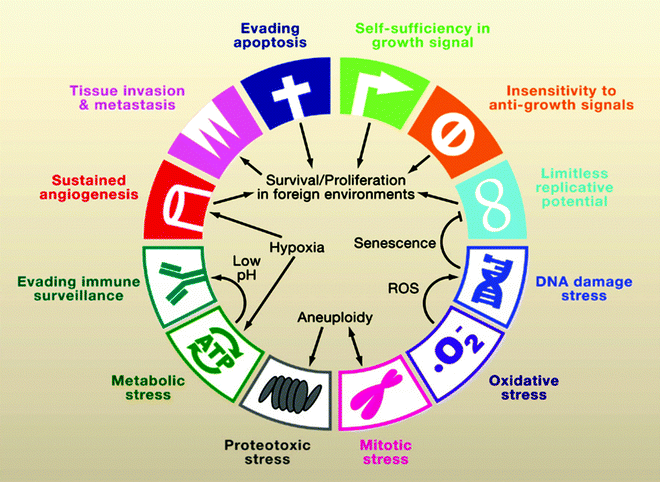

Fig. 1.1
The biologic characteristics of malignant tissues that distinguish them from the tissues from which they arise (From [1], with permission)
The Tumor Mass
A second general and uniting property of cancer that is essential to the long-term viability of individual cancer cells is its ability to recruit a large number of cell types as a supporting framework to create the mass that characterizes clinical malignancies (Fig. 1.2). For example, fibrocytes, endothelial cells that form vessels that provide nutrients, and immune cells are common constituents of the tumor mass that are typically imaged with CT. Prior to recruiting blood vessels, the tumor mass size is limited by the diffusion distance of oxygen in tissues, which is about 100–200 μm. Once a blood supply is established, the tumor mass can grow [2].
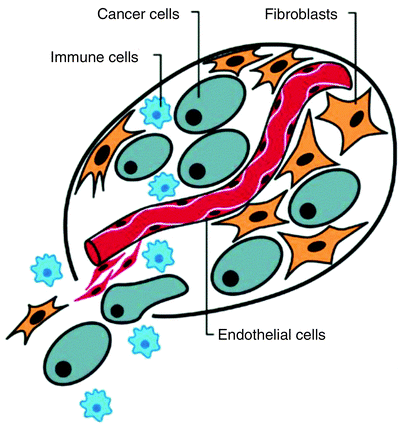

Fig. 1.2
Fibrocytes, endothelial cells to form vessels which provide nutrients, and immune cells are common constituents of the tumor mass. Once a blood supply is established, the tumor mass can grow (From [2], with permission)
Imaging the Tumor Mass
For several decades, observing changes in the size of the tumor masses has been the basis for monitoring treatment response. At first, this was done using palpation, but high-resolution cross-sectional CT imaging rapidly became the gold standard for treatment monitoring once it was developed. At present, clinical imaging criteria have serious limitations for the detection of masses, and in most situations, 1 g of tissue or about 108 cells is a practical limit. The current criteria depend on the measurement of two perpendicular diameters in up to five soft-tissue masses (RECIST 1.1). For a partial response (PR), >30% reduction is required in the sum of long dimensions of up to 2 per organ, and for complete response (CR) disappearance of all lesions is required. Progressive disease is >20% increase in sum of long diameters, validated at 4 weeks after treatment.
With the widespread introduction of [18F]FDG positron emission tomography (PET) imaging, there is recognition that metabolic change should also be incorporated into the measurement of tumor treatment response. Initial assessment was based on the EORTC recommendation and employed standardized uptake values for [18F]FDG uptake, normalized to body weight (SUVmax) [3]. Expert opinion offers alternative response parameters for making this assessment, such as PERCIST, which incorporates PET SUV measurements into treatment response. PERCIST uses an SUV measure, SUVpeak, which is based on lean body mass, and uses a circular region of 1.2 cm in diameter (with an approximate mass of 1 g) centered around the hottest voxel, over which the SUV is averaged. In order for PERCIST criteria to be applied to measure tumor response to treatment, the SUVpeak must be >/SUV average liver, +2 standard deviation SUV liver. In this way, tumor and liver SUVs are compared. An alternative that takes advantage of semiautomated lesion tracking software to look at all the lesions simultaneously in advanced patients has recently been proposed by Fox and colleagues; clearly the size and metabolism of the mass in some combination appears likely to be an important measure of treatment response [4]. It is important to keep in mind that when imaging a tumor mass, changes in a particular parameter involves all of the cells in the mass, both malignant and benign; this is true whether imaging gross anatomic measures obtained by CT or a more tumor cell-associated hallmark such as [18F]FDG uptake due to the Warburg effect.
Neovasculature
Once cancer cells are collected into a mass, the cells must recruit blood vessels to be able to grow further. The blood vessel system that develops in a tumor is called “neovasculature,” which is short hand for vasculature associated with neoplasia. Folkman was the first to recognize that inhibition of angiogenesis could inhibit tumor growth; he coined the tumor “angiogenic switch,” for the moment when a small collection of tumor cells began the vascularization process [5]. Ferrara discovered that vascular endothelial growth factor (VEGF) played a crucial role in the development of neovasculature. In response to VEGF produced at the site of the tumor cells, stem cells are recruited from the bone marrow and migrate to the tumor mass, where they serve an essential role in the production of neovasculature.
Antiangiogenesis therapy has been developed that targets the proangiogenic factor, VEGF, including the antibody bevacizumab, which binds VEGF and shows strong antitumor activity against some highly vascular tumors. Targeted drugs such as sorafenib and sunitinib exert their antitumor effects by inhibiting the VEGF receptor expressed on tumor cells. The response of tumors to therapy such as single high dose fraction radiation has been linked by some to endothelial damage, whereby radiation induces catastrophic apoptosis in endothelial cells that result in irreversible damage to tumors.
In contrast to normal vessels, neovasculature has special features that may be exploited to image the tumor mass. First and foremost, neovasculature is “leaky” with incomplete endothelium, so that gaps between cells may be exploited to allow the passage and retention of large molecules and nanoparticles into tumors. This process is called “extravasation and passive retention (EPR) effect,” and is thought to occur because the larger molecules and nanoparticles enter into the perivascular space through relatively large pores, but have difficulty getting back out into the vasculature, much like a lobster has trouble finding its way out of a lobster trap. A second special feature favoring imaging is the expression of special endothelial markers that may serve as a target for molecular imaging. Among these markers is the avb3 integrin, which serves as a high affinity binder for a specific peptide sequence; RGD (Fig. 1.3) [6]. Other endothelial sites for imaging include the antigens PSMA, which can be imaged with the antibody J591; in a review by Schliemann and Neri, nine vascular targets were described for which antibodies have been developed [7].
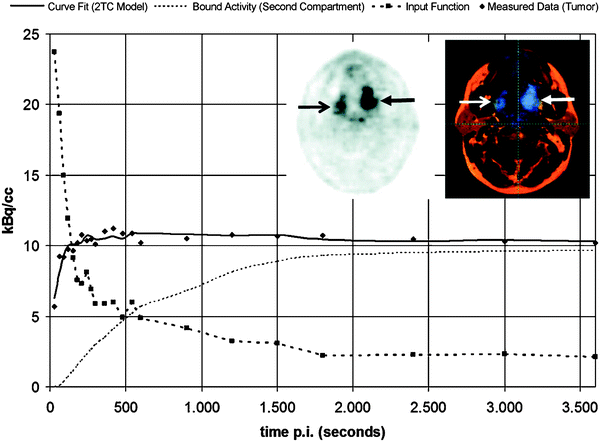

Fig. 1.3
Among endothelial markers that may serve as a target for molecular imaging is the avb3 integrin, which serves as a high affinity binder for a specific peptide sequence
Hypoxia
Solid tumors tend to outgrow their blood supply, causing cancer cells to become hypoxic in the process [8]. The redox state that accompanies hypoxia can be imaged using a class of compounds called Nitroimidazoles. 18F-misonidazole (18F-MISO) is the most commonly used nitroimidazole, although there are numerous alternatives being developed. The principal localization is passive diffusion into the region of hypoxic tumor. However, once the nitroimidazole enters the hypoxic region, it binds tightly to large macromolecules retained within the hypoxic but viable tissue. Hypoxia is a key property of tumors that seriously interferes with radiation damage. Well-oxygenated tissue is about three times more sensitive to radiation damage than hypoxic tissue. Therefore the concept has emerged to use 18F-misonidazole as an agent for imaging hypoxic regions within tumors, so that by using modern three-dimensional dose distribution systems, a boost of radiation to the hot hypoxic region can be achieved, without damaging normal tissues. 18F-MISO is not a perfect radiotracer, because it has relatively low contrast even when imaging regions of hypoxia. For that reason a number of alternative nitroimidazoles are being studied as possible substitutes. Also being studied is 64Cu-ATSM, which has a similar characteristic in some tissues such as cervix.
Physiology of the Tumor Mass Leads to Special Issues of Targeting Drugs to Tumor
The growth of molecular imaging has led to the development of many probes for tumor imaging [9] by various modalities, especially radionuclide tracers. These tracers may range in size from very tiny, such as substrates like [18F]FDG that are a few nM in diameter, up to nanoparticles and viruses that are typically in the 20–200 nM range. An antibody has an effective radius of approximately 10–15 nM. Size is one of the factors determining the rate that tracers move from the blood into the interstitium of the tumor.
As mentioned above, holes in the neovasculature make the tumor relatively leaky, and this is the basis for the extravasation permeability retention (EPR) effect that allows tumors to take up nanomaterials with pore diameter of up to 60 nM or so. Typically the EPR effect will result in a three- to fourfold concentration gradient for tumor vs. normal tissue. The rate of uptake into the tumor mass, especially for large objects like antibodies and viruses, is hampered by the fact that tumors have an abnormally high interstitial fluid pressure because the lymphatics are compressed by the rapidly growing tumor in the center of the mass, so fluid and pressure buildup centrally.
At the edge of the tumor, lymphatics may continue to be effective, causing the tumor to have such a drop of interstitial pressure at the periphery that it effectively sheds fluid, growth factors, and nutrients. This feature of the tumor may facilitate tumor cells to metastasize to remote sites. It may take as long as a week for an IgG antibody to penetrate to antigen binding sites at the middle of the tumor mass. Other parameters being equal, the smaller the antibody fragment, peptide or molecule, the more rapid the penetration into the tumor with binding to the cognate antigen [10].
Cellular Constituents and Cell–Cell Synergism of the Tumor Mass
The tumor mass not only contains tumor cells but also stromal support including fibroblasts, collagen fibrils, and vascular endothelium. The amount of stroma is highly tissue-dependent with some tumors, such as lymphoma having relatively little stroma, with others such as mucinous pancreatic cancers being characterized by very few tumor cells and abundant stromal component. In addition, tissue macrophages and other immune cells are represented in the mass.
The mass cannot grow without the active synergism of each cellular component. This occurs in the obvious way in terms of blood vessels being required as a conduit for supply of oxygen and nutrients. Typically, about 3% of the cellular mass is represented by endothelial cells. However, recent evidence suggests that single dose fraction radiation kills the tumor and ultimately shrinks the mass by selectively damaging the vascular endothelium, as they are the most sensitive cells in the mass [11]. There is also evidence that cells interact with one another in more subtle ways as well. Small molecules, large molecular complexes, and entire pieces of membrane are exchanged between tumor cells and supporting stroma. For example, P-glycoprotein, an ABC transporter protein responsible for multidrug resistance, was shown to transfer from resistant to sensitive cells, as a functional entity, so that sensitive cells could acquire sufficient resistance to resist otherwise lethal levels of anticancer drugs [12].
The tumor mass is an immunologic sanctuary in that neoantigens and oncoproteins manufactured by the malignant cell should be more immunogenic than they are in reality. An area of rapid progress in cancer therapy is the use of immunologic agents, both antibodies and cells to reverse this relative anergy, so that an effective immune attack can be mounted. An important mechanism for the antitumor properties of the anti-CD20 antibody, rituximab, is immunologic, and immune cells invade the tumor, posttreatment [13]. This immunologic invasion of predominantly T-cells is sufficient to cause false positives on [18F]FDG-PET imaging. Similar findings were observed after ipilimumab therapy, where there is an increase in the size of tumor mass because of immune cell infiltration and false positives on PET. For this reason, modified response criteria have been suggested for monitoring the response profile of solid tumors after these powerful immunologic treatments [14].
The Metastatic Process
Massagué and colleagues used a series of passages of human tumors through experimental animals to identify tumor cells with tropism for particular sites of metastases, such as the bone, brain, and adrenals. In breast cancer, the individual cells with this tropism could be cloned, and when studied, were found to express specific molecules that enabled cells to migrate from the primary site and survive in the new environment [15–17].
This group has also developed a conceptualization of the metastatic process that involves a dynamic interaction between tumor sites, such that tumor cells from metastatic sites may reseed the primary tumor, and vice versa, in a continuous exchange [18, 19]. These findings have been observed in animal models of breast, colorectal, lung, and melanoma and involve the circulating tumor cells in blood, including those that appear “differentiated” for tropism to specific tissues. There is reason to believe that this “tumor reseeding” may help explain why the growth of solid tumors follows Gompertzian kinetics: namely an exponentially declining exponential growth in which the tumor doubling times are most rapid at the very earliest stage of tumor growth. Another feature of metastatic growth that supports the concept that tumor cells seed organs via circulation in the blood comes from studies in prostate cancer. The sites of early bone metastases were shown to correlate with the regional distribution within the boney skeleton where active red bone marrow is present and blood flow is particularly rich. It was also observed in these patients that progression of tumor volume as a proportion of the boney skeleton followed a Gompertzian kinetic form (Fig. 1.4a–c) [20, 21].
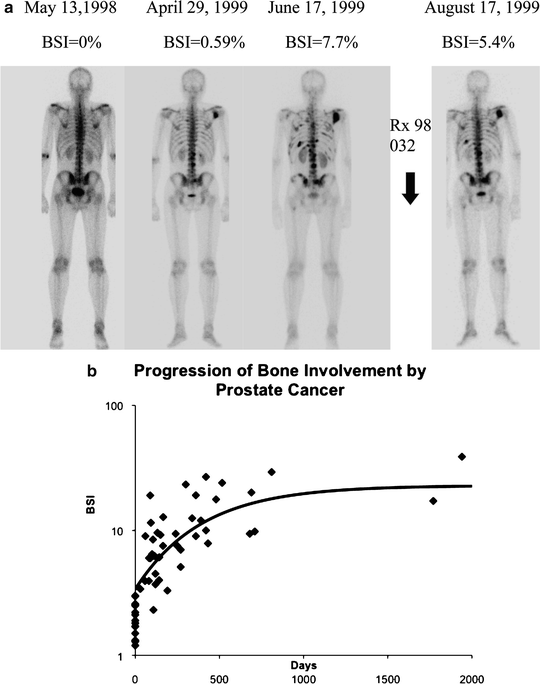

Fig. 1.4
(a) Progression on bone scan of prostate cancer tumor in bone measured using the bone scan index (BSI) technique. (b) The rate of progression of tumor in a group of patients followed a Gompertzian group curve, of the form, BSI(t) = BSI0(exp(a/b)(1−exp(−bt))) with an initial doubling time of 45 days, at 3% BSI involvement. Of note is the characteristic decline in rate of growth until a plateau is reached. The initial metastases in these 27 patients occurred exclusively within the pattern of red marrow distribution in the adult male
Imaging the Cancer Cell
Oncogene and Non-oncogene Addiction
Cells that are nonmalignant reside within a particular tissue and receive growth and other control signals through a network of signal transduction molecules which are illustrated diagrammatically as a series of interconnecting lines (Fig. 1.5). In cancer cells, the process of intracellular communication may be coopted by specific driver mutations in otherwise normal genes, leading to an abnormal gene called the oncogene. The oncogene produces abnormal gene products, oncoproteins, that drive oncogenesis and leads to malignant cell behavior. Driver mutations that are examples of oncogene addiction include overexpression of Her-2 in breast cancer, c-Kit mutation in gastrointestinal stromal tumor (GIST), and abl kinase mutation in leukemias. Mutations can occur in kinases such as EGFR mutations, c-KiT mutations, abl kinase that can disrupt their signal transmitting function. Other commonly mutated oncogenes include genes controlling Rb, P53, and PTEN proteins that suppress a tendency toward tumor formation. In short, cancer occurs when a series of mutations develop that cooperate to create the complex malignant phenotype.
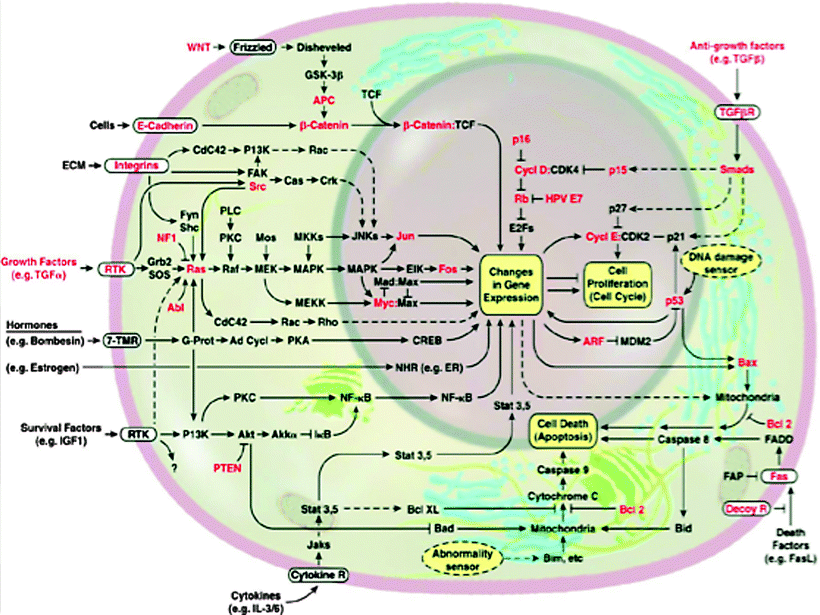

Fig. 1.5
Diagrammatic illustration of a network of signal transduction molecules as a series of interconnected lines. They transmit growth and other control signals to nonmalignant cells that reside within a particular tissue (From [2], with permission)
Driver Mutations in Cancer Cells
There are three categories for the mutations that drive the cancer cell to the malignant state: (1) gain of function mutations, (2) translocations, and (3) amplifications. Treatments and imaging are increasingly being focused on these driver mutations, and the success of kinase inhibitors in particular has validated this concept. Table 1.2 illustrates molecular imaging of targeted drug inhibition in clinical practice of oncology.
Table 1.2
Molecular imaging of targeted drug inhibition in clinical practice of oncology
Disease | Target | Drug | Molecular imaging |
|---|---|---|---|
CML | ABL | Imatiniba | [18F]FDG PET |
GI stromal tumor | KIT | Imatiniba | [18F]FDG PET |
Lung cancer | EGFR | Erlotoniba | [18F]FDG, 18F-FLT PET |
Kidney cancer | VEGFR | Sunitinib, sorafeniba | 124I-cG250 (CA9) |
Resistant CML | Mutant ABL | Dasatiniba | 18F-desatinib |
Breast cancer | Her2 | Lapatiniba, Herceptin | 68Ga-Fab′2 herceptin |
Prostate cancer | AR | MDV3100 | 18F-FDHT, [18F]FDG |
Melanoma | BRAF | PLX4032a | [18F]FDG |
Thyroid cancer | BRAF, MEK | MEK | 124I-NaI |
The PI3K/AKT and RAS/ERK Pathways
From the point of view of targeted drug therapy, the interaction of membrane receptor-based tyrosine kinase and the PI3K/AKT and RAS/ERK pathways illustrate how a variety of drugs may inhibit signaling in specific ways (Fig. 1.6). Molecular imaging is used to image response to the effects of blocking the driver mutation.
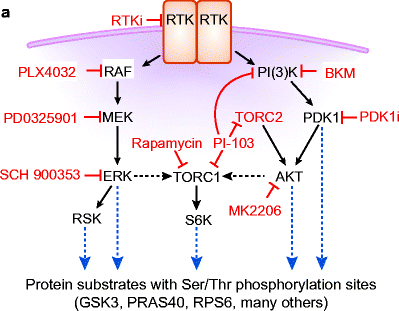

Fig. 1.6
The interaction of membrane receptor-based tyrosine kinase and the PI3K/AKT and the RAS/ERK pathways illustrate how a variety of drugs may inhibit signaling in specific ways
c-Kit Inhibition by Imatinib in Gastrointestinal Stromal Tumor
Early studies with the tyrosine kinase inhibitor imatinib (Gleevec) demonstrated striking activity against GIST. GIST is driven by the oncogenic protein cKit, a transmembrane receptor. Figure 1.7 shows the effect on [18F]FDG uptake of blocking the specific tyrosine kinase activity associated with cKit; within 24 h there is a profound reduction in [18F]FDG metabolism that persists in this patient for more than 5 months.
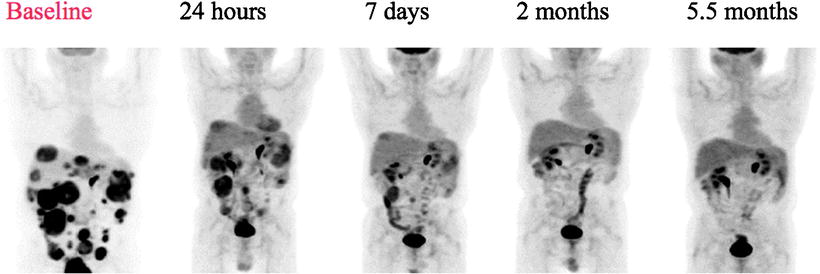

Fig. 1.7
PET scan in GIST treated with Imatinib. There is a rapid reduction in glycolysis as assessed by [18F]FDG uptake beginning at 24 h posttreatment
B-RAF Inhibition in Advanced Melanoma with V600E Mutation
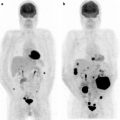
Malignant melanoma may respond to specific tyrosine inhibitor drugs, with rapid reduction in [18F]FDG metabolism, offering new hope for a deadly disease. As is the case for GIST tumors, about 70% of melanomas, will have a significant response based on RECIST 1.1 criteria when treated with a highly specific tyrosine kinase inhibitor PLX 4032. Eighteen patients had a CR and one patient had a PR. The patients had a rapid response to the drug with marked reduction of [18F]FDG uptake. In Fig. 1.8, 3 of the 27 patients are shown. The left hand image shows a baseline study, and on the right is the follow-up at 2 weeks posttreatment. It was also of interest that dose was highly important and more than 80% inhibition of the B-RAF pathway was required for response in these patients [20].
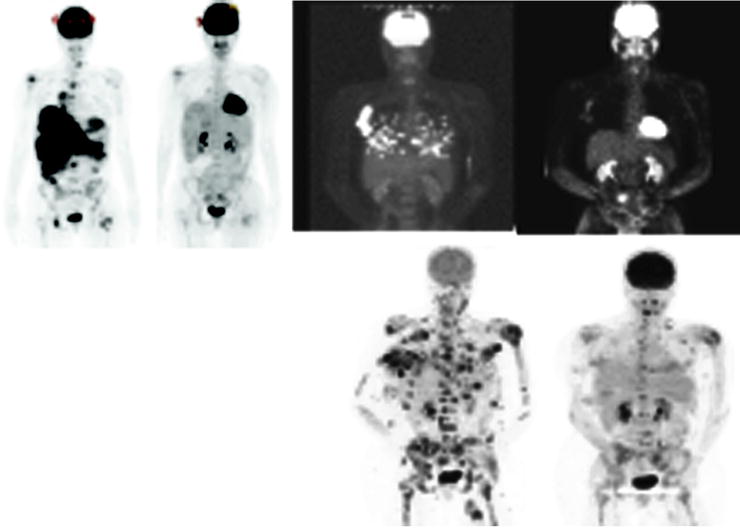

Fig. 1.8
Three of 27 patients are shown. The left hand images show a baseline study and on the right the follow-up at 2 weeks posttreatment (From [47], with permission)
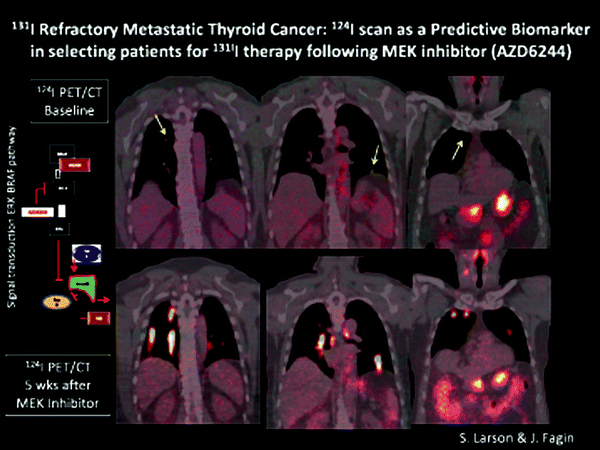
Inhibition of MEK, a Downstream Signal Transduction Molecule in the RAS/BRAF/ERK Pathway, Can Reverse 131I Resistance in Patients with Thyroid Cancer
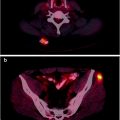
Abnormalities of the BRAF/ERK signaling pathway promote the malignant state in thyroid cancer, and inhibition of MEK leads to re-differentiation of experimental models of human thyroid cancer in animals [22]. Accordingly, a group of patients with 131I-iodide refractory thyroid cancer was studied at MSKCC using the positron emitting form of Iodine, 124I-NaI. Patients were treated with the MEK inhibitor, AZD 6244, for 5 weeks and then restudied with quantitative PET imaging using 124I. Approximately two-thirds of the patients had restoration of radioiodine uptake and went on to be treated with 131I-iodide, with excellent clinical response to treatment (Fig. 1.9).

