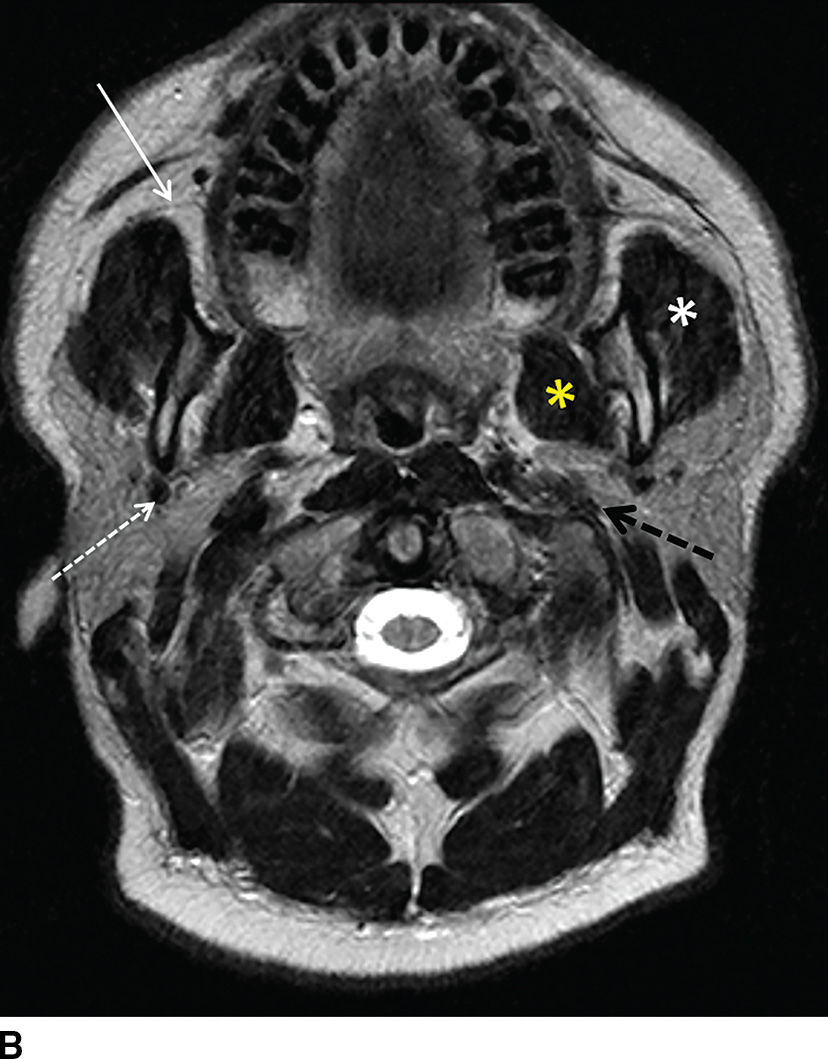
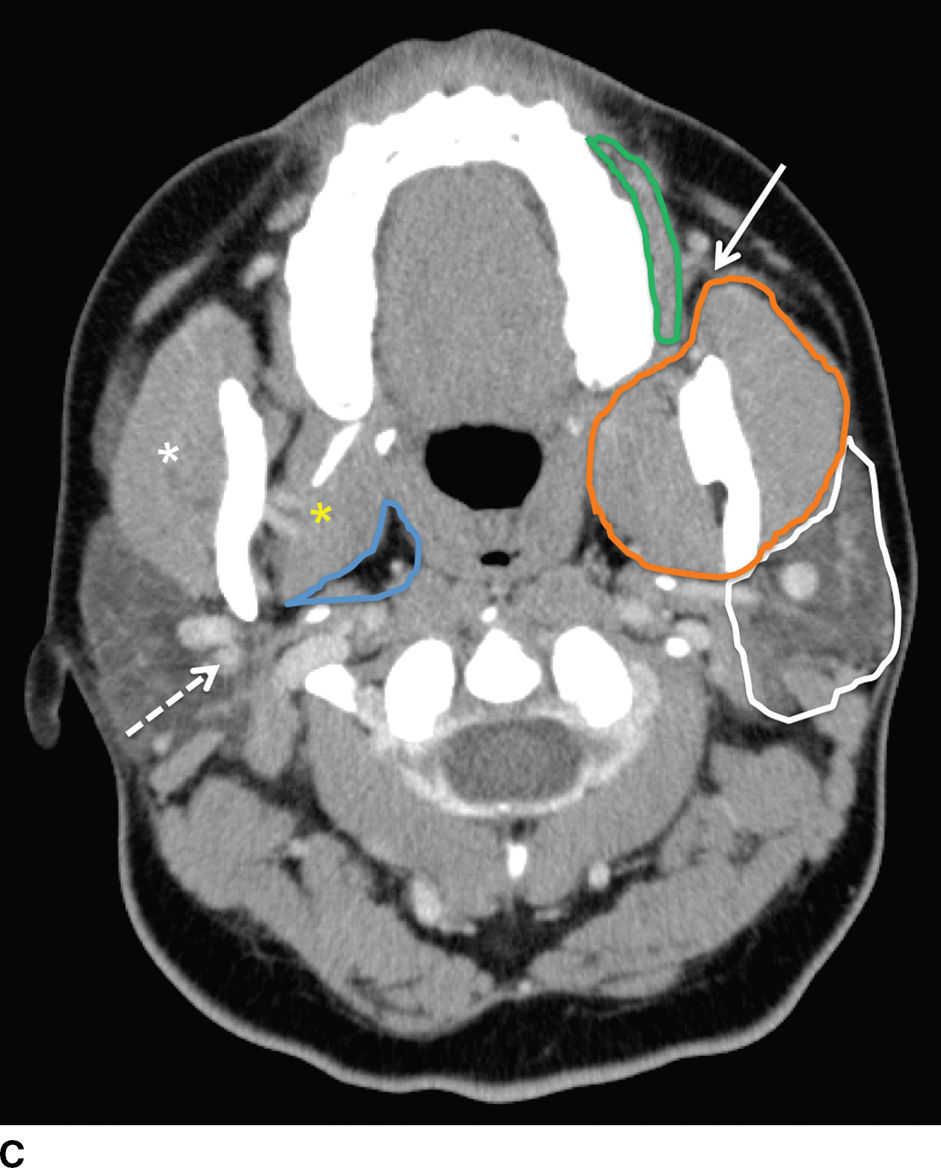
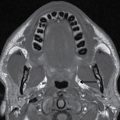
FIG. 23.1 Normal anatomy of the parotid glands. T1-weighted (A) and T2-weighted (B) MR and contrast-enhanced CT (C) images of the upper neck at the level of the parotid glands.A: Normal radiographic anatomy of the relevant spaces is shown, including the parotid (white outline), masticator (orange outline), carotid (red outline), and parapharyngeal (blue outline) spaces. Also demonstrated are the masseter (white asterisk), medial pterygoid (yellow asterisk) and posterior belly of digastric (black arrow) muscles, parotid duct (white arrow), retromandibular vein (dashed white arrow), and styloid process (dashed black arrow). Note the parotid duct pierces the buccinator muscle (green outline) to enter the oral mucosa opposite the 2nd maxillary molar. Because the facial nerve cannot be visualized on imaging, the retromandibular vein (dashed white arrow) is used as a landmark to separate the superficial and deep lobes with the latter shown medial to the stylomandibular notch in (B).
The major excretory duct of the parotid gland is Stensen duct, which courses anteriorly over the masseter muscle, pierces the buccinator muscle at a nearly perpendicular orientation, and terminates in a papilla of the buccal mucosa opposite the second upper molar tooth. The parotid gland is the only salivary gland that contains lymph nodes, which drain to the level II nodes of the neck.
Submandibular glands
The submandibular gland is approximately half the size of the parotid gland and is located in the posterior aspect of the submandibular triangle. While the superficial lobe forms the bulk of the gland in the submandibular space, the deep lobe folds around the posterior free edge of the mylohyoid muscle to reside in the sublingual space. The duct of the submandibular gland is Wharton duct, which emerges from the anterior aspect of the gland and courses anterosuperiorly within the sublingual space to terminate in the sublingual papilla in the anterior floor of the mouth (Fig. 23.2). The gland drains to the level I cervical lymph nodes (1).
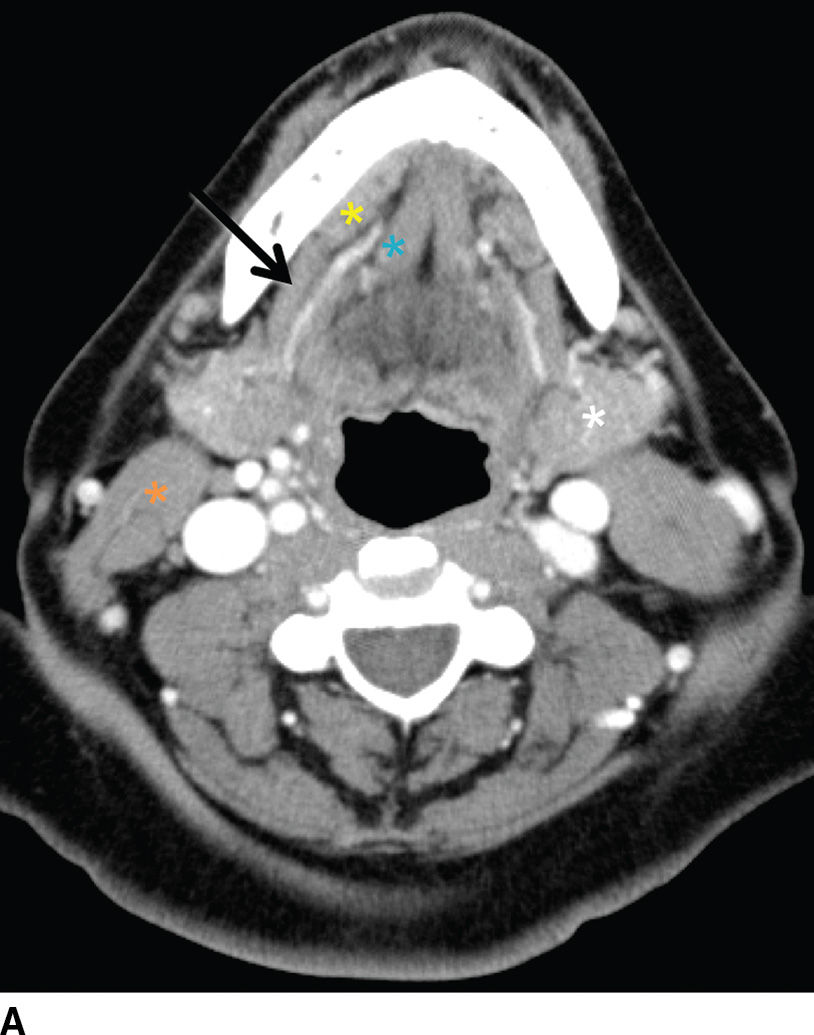
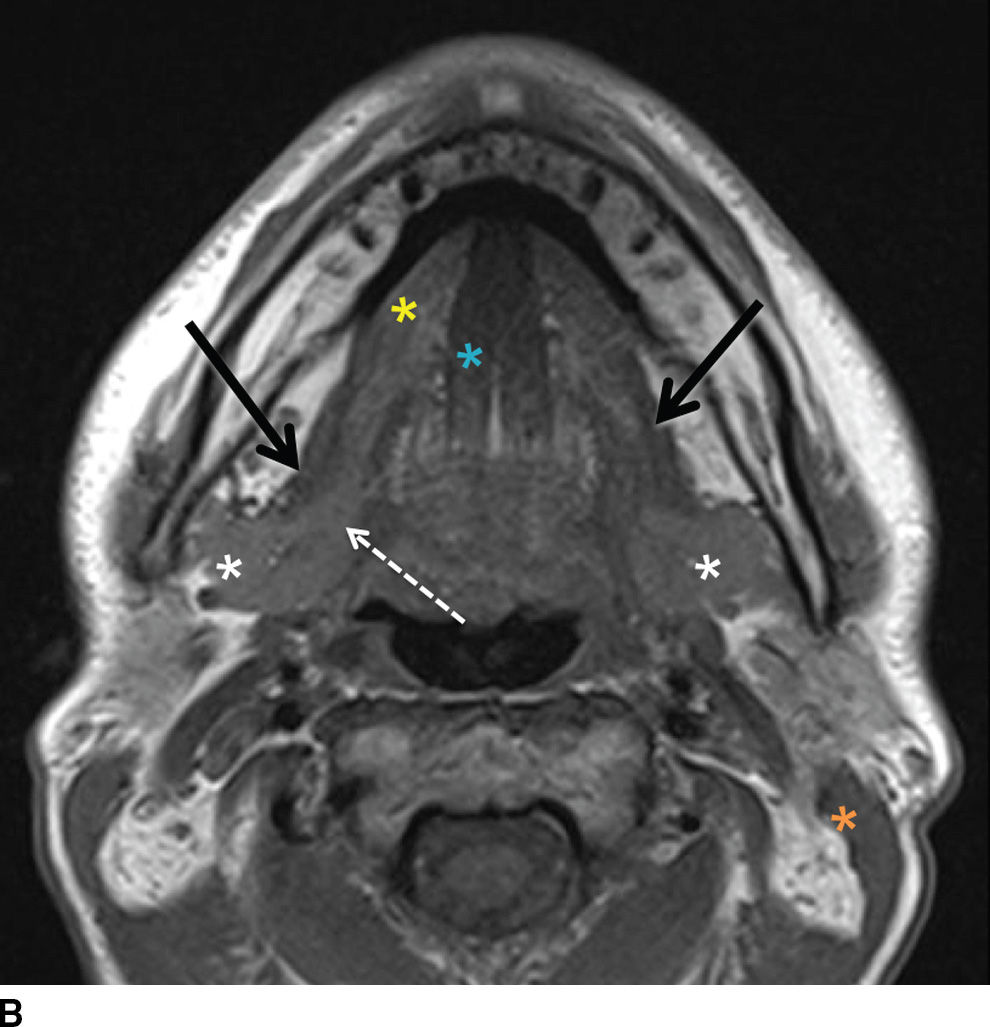
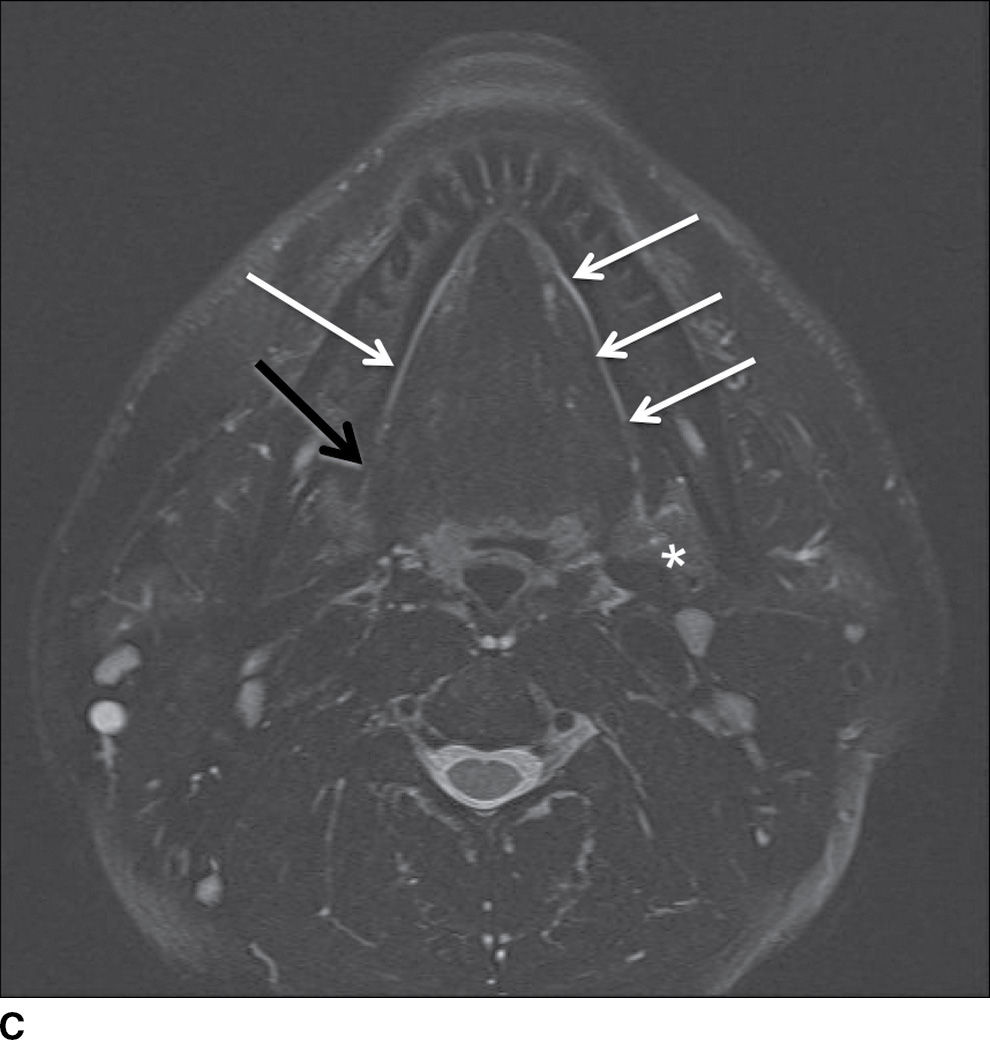
FIG. 23.2 Normal anatomy of the submandibular and sublingual glands. Contrast-enhanced CT (A) and T1-weighted (B) and T2-weighted fat suppressed (C) MR images of the upper neck at the level of the submandibular (white asterisk) and sublingual (yellow asterisk) glands. Note the deep lobe of the submandibular gland (dashed white arrow) courses around the posterior free margin of the mylohyoid muscle (black arrow) to enter the sublingual space. Demonstrated are the genioglossus muscle (blue asterisk) and sternocleidomastoid muscle (orange asterisk). Wharton duct (solid white arrows) is seen coursing anteriorly and medially in the sublingual space (superomedial to the mylohyoid muscle).
Sublingual glands
On average, the sublingual gland is about half the size of the submandibular gland and is the smallest of the major salivary glands. The gland is submucosal in location in the sublingual space, superomedial to the mylohyoid muscle and lateral to the genioglossus muscle (Fig. 23.2). Its many small ducts open directly into the floor of the mouth; some may form Bartholin duct, which joins Wharton duct (1).
Imaging considerations
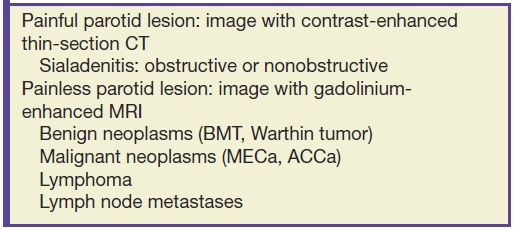
When a patient presents with a painless salivary gland mass, contrast-enhanced MRI is the imaging study of choice, as this technique best delineates the morphology and margins of the mass. Masses centered within the deep lobe of the parotid gland are deep to the retromandibular vein and frequently adopt a pear shape, widening the stylomandibular notch and displacing the parapharyngeal fat anteromedially. While T1-weighted images allow for evaluation of lesion margins and extension, postcontrast T1-weighted imaging is used to assess perineural spread and osseous involvement. The signal characteristics of lesions on T2-weighted images, although not always reliable, may be helpful in differentiating benign from malignant masses. Classically, a T2 intermediate to hypointense mass is thought to be malignant, while T2-hyperintense masses are more likely to be benign.
While a noncontrast CT scan is sufficient to simply identify sialolithiasis, a contrast-enhanced CT scan is the imaging modality of choice in the setting of a painful gland in order to demonstrate sialadenitis. Sialolithiasis can still be identified on a contrast-enhanced CT. In addition to being readily accessible in the acute setting, CT better demonstrates inflammatory changes and sialoliths compared with MR. Although CT is most commonly utilized in imaging systemic inflammatory disorders such as HIV, Sjogren disease, and sarcoidosis, given its easy accessibility (2), MR has proven to be quite useful as well (Table 23.1).
Table 23.1 Clinical Pearls: Parotid Lesions
MR sialography uses heavily T2-weighted fast spin-echo sequences allowing for visualization of the major salivary ducts as well as the major intraglandular ducts. This has largely replaced invasive conventional sialography in the evaluation of sialadenitis and diagnosis of autoimmune sialadenitis in the setting of Sjogren syndrome.
Targeted ultrasound utilizing a high-frequency linear transducer may be used to characterize salivary gland masses as cystic or solid, diagnose sialolithiasis, and identify cystic parotid disease associated with HIV and Sjogren syndrome. The normal salivary glands are typically homogeneous and are slightly to markedly hyperechoic, depending on the fatty tissue content.
Pathology
Neoplasms/masses
Benign Tumors
Benign Mixed Tumor (BMT). BMT, also known as a pleomorphic adenoma, is the most common benign tumor of salivary gland origin and is composed of a mixture of epithelial, myoepithelial, and stromal components. BMT most commonly arises in the parotid gland where it constitutes approximately 80% of intraparotid masses (3). The submandibular gland is the second most common location. BMT has a predilection for the female gender (2:1 ratio) and presents in middle age as a painless mass. BMT is very rarely multicentric. Treatment consists of complete surgical resection requiring meticulous technique to avoid tumor seeding; recurrent tumor has a propensity for multifocality (3).
On imaging, BMT appears as an ovoid, well-delineated homogeneous intraglandular mass. On CT, a BMT is most commonly intrinsically hyperattenuating and shows enhancement with contrast administration. On MRI, these tumors are typically T1 hypointense and T2 hyperintense with variable enhancement (Fig. 23.3). Larger masses may be more heterogeneous due to foci of necrosis and hemorrhage. Ultrasound classically shows a well-circumscribed hypoechoic lesion with posterior acoustic enhancement (4). Color Doppler interrogation may reveal a peripheral “basket-like” pattern of vascularity (5).
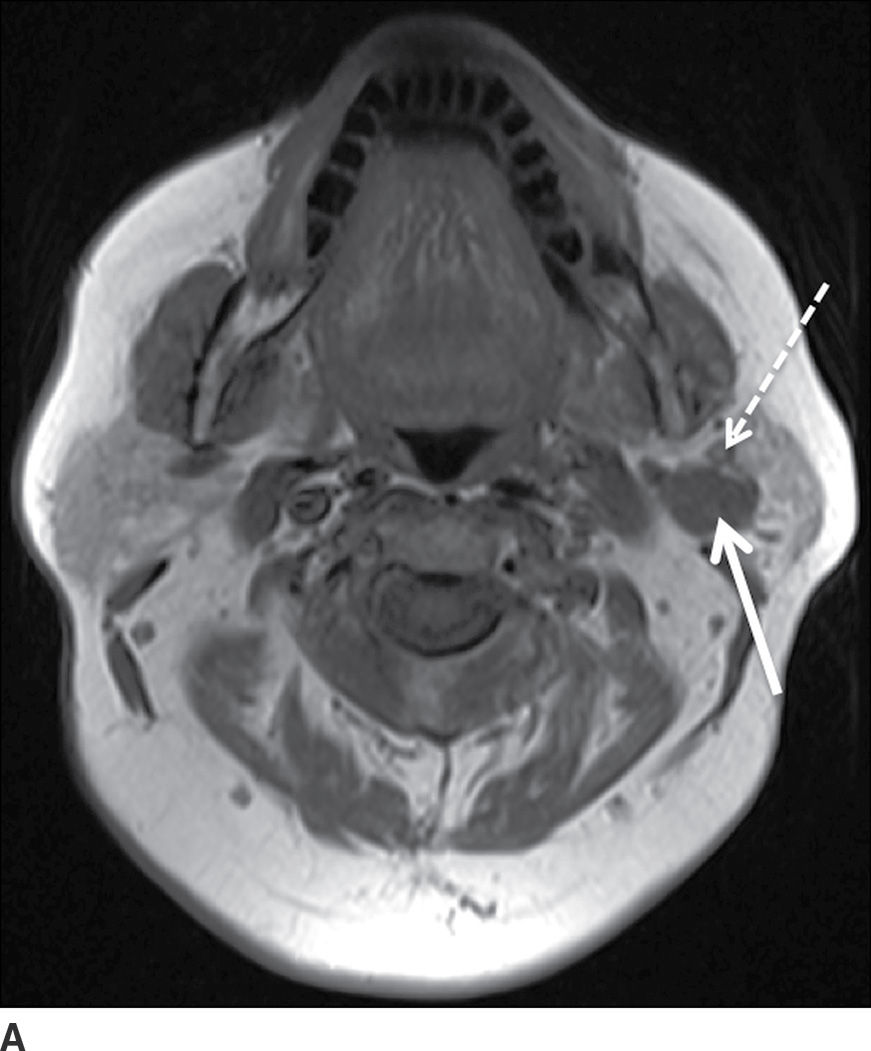
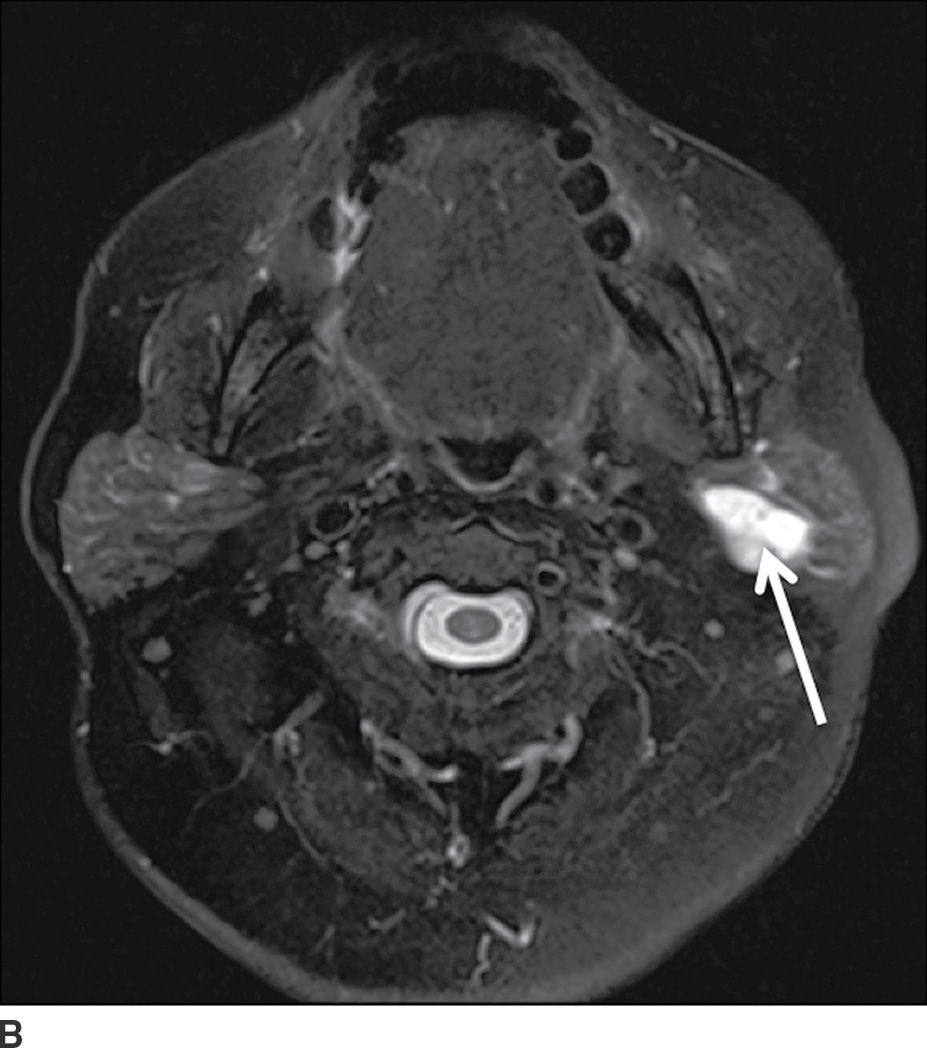
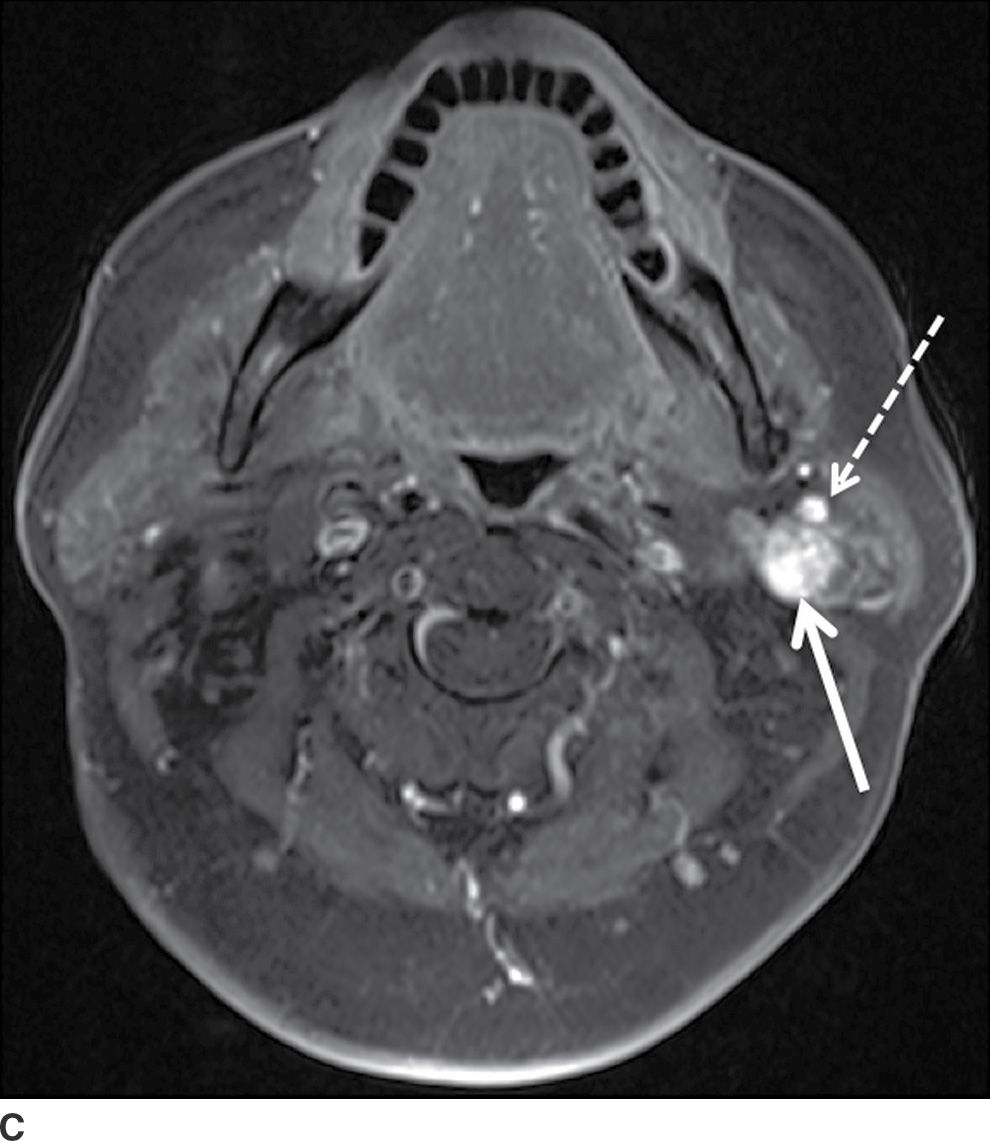
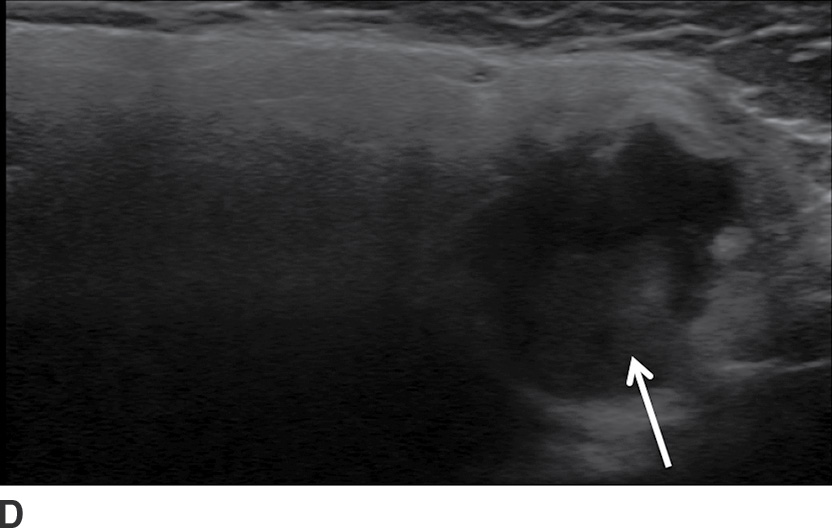
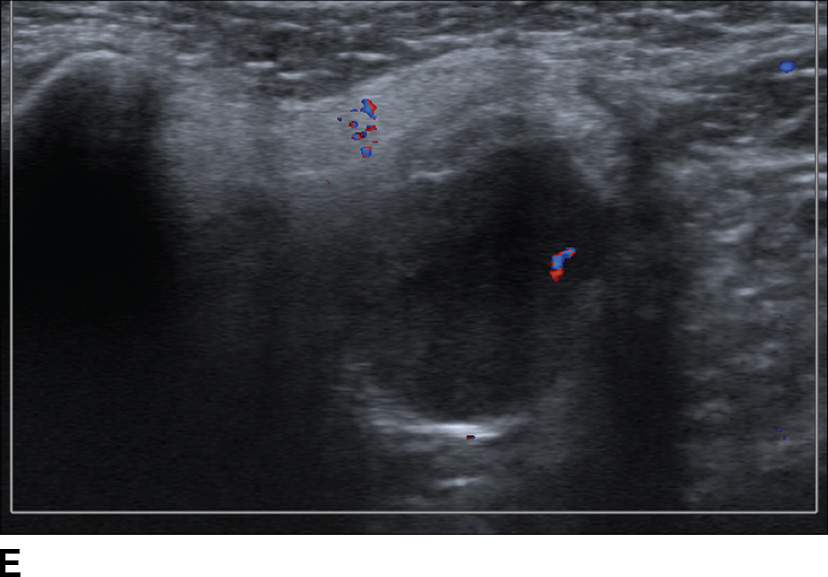
FIG. 23.3 Pleomorphic adenoma. Axial T1-wighted (A), T2-weighted fat-suppressed (B), and T1-weighted fat-saturated contrast-enhanced (C) images of the neck show an avidly enhancing, well-circumscribed T2 hyperintense lesion in the superficial and deep lobes of the left parotid gland (solid arrow). Note the retromandibular vein (dashed arrow), which can be used to demarcate the superficial and deep lobes. Longitudinal gray-scale (D) and transverse color Doppler (E) ultrasound images of the left parotid gland show a hypoechoic lobular mass at the inferior aspect of the parotid gland with posterior acoustic enhancement and little detectable vascularity by color Doppler.
Warthin Tumor. Warthin tumor is composed of papillary structures, mature lymphocytes, and cystic spaces and appears as a sharply marginated intra- or periglandular heterogeneous mass. This tumor most commonly presents as a painless mass most commonly within the parotid gland tail and typically occurs in elderly male smokers. It is multicentric in approximately 20% of cases (3), with 5% to 14% of patients presenting with bilateral masses, 25% of which present simultaneously and 75% metachronously (1). Complete excision is the treatment of choice. Malignant differentiation is exceedingly rare (3).
CT shows a well-circumscribed mass with cystic foci in up to 30% of lesions (Fig. 23.4) (3). On MRI, Warthin tumors frequently demonstrate foci of T1 hyperintensity due to proteinaceous debris and/or hemorrhage. Areas of cystic degeneration, if present, are T2 hyperintense. Postcontrast MR images show enhancement of the solid components. Sonographically, Warthin tumors are well-marginated, lobulated hypoechoic lesions with internal septations and cystic components (4).
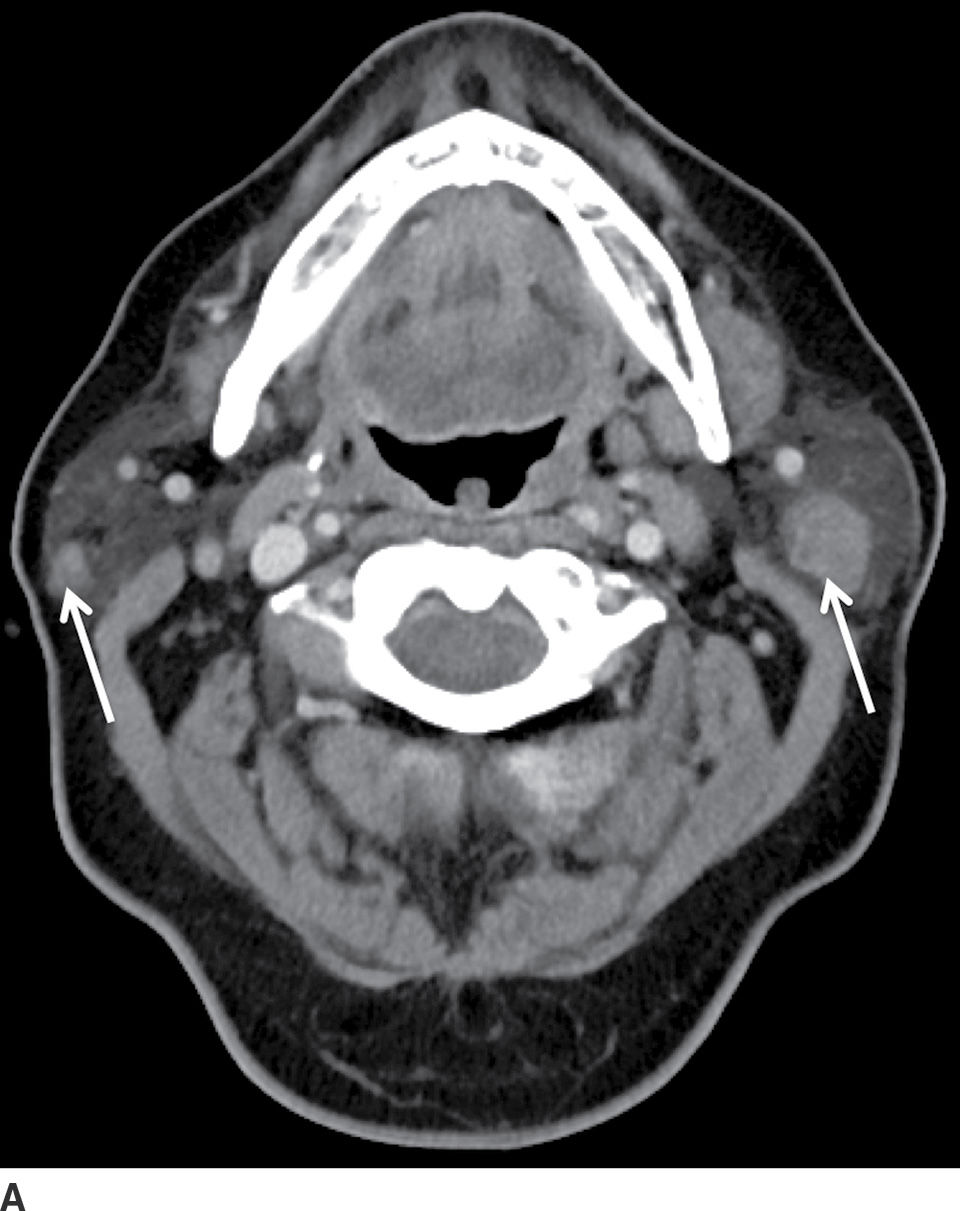
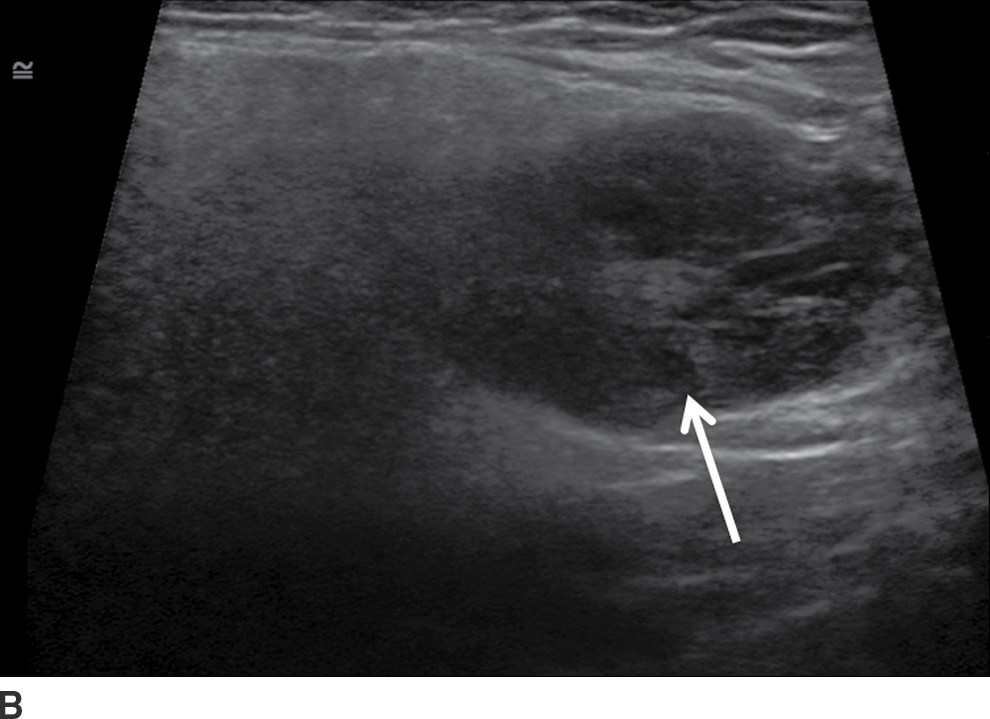
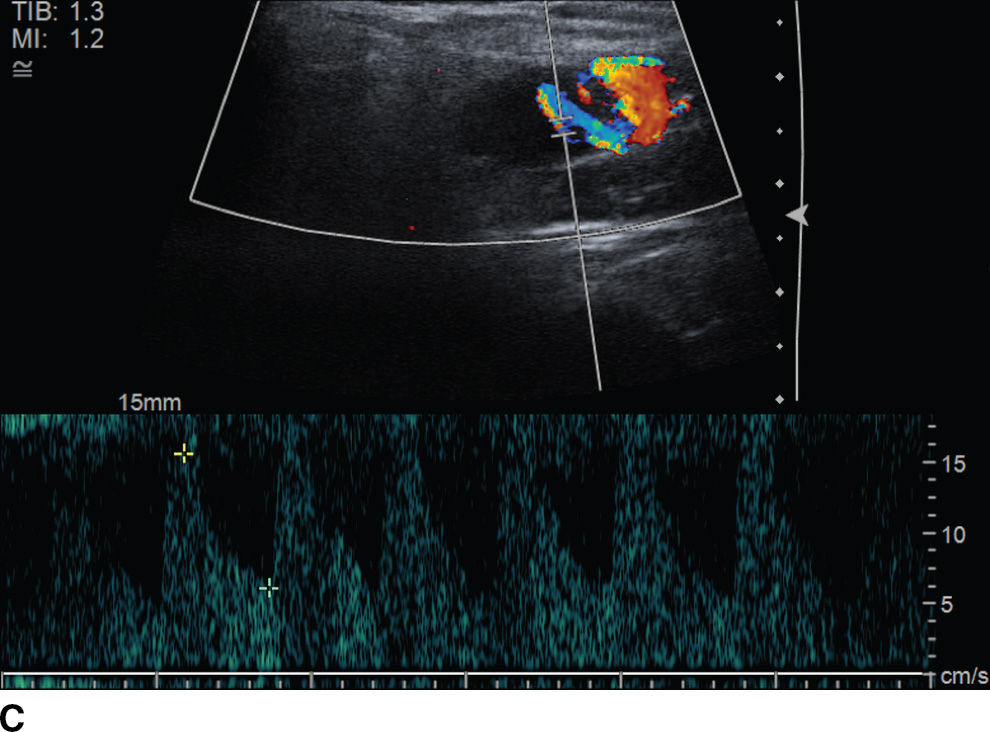
FIG. 23.4 Bilateral Warthin tumors. Axial contrast-enhanced CT scan of the neck (A) shows enhancing fairly well-defined bilateral parotid gland lesions (arrows). Longitudinal gray-scale (B) and color Doppler (C) sonographic images of the inferior aspect of the left parotid gland show a heterogeneously hypoechoic, markedly vascular mass.
Malignant Tumors
Just like benign lesions, salivary gland carcinomas most commonly present with painless swelling; pain, facial nerve paralysis, and nodal masses are worrisome clinical features for malignancy. The rate of the malignancy is higher in neoplasms affecting smaller glands, increasing from 20% to 25% in the parotid gland to 50% to 81% in sublingual glands (1). The most common malignant neoplasms of the major salivary glands are adenoid cystic carcinoma (ACCa) and mucoepidermoid carcinoma (MECa). ACCa and MECa are radiographically indistinguishable invasive masses that exhibit slightly different behavior in dissemination. While ACCa has a propensity for perineural spread, MECa is more frequently associated with malignant lymphadenopathy. Salivary malignancies are usually treated with surgical resection followed by radiation therapy.
On imaging, salivary gland carcinomas can appear as well-defined masses indistinguishable from benign tumors. They can also appear as ill-defined, irregular enhancing masses with infiltrative margins (Fig. 23.5). Noncontrast T1-weighted images are helpful in evaluating the margins of the lesion. It has been shown that T2 hypointensity is highly suggestive of cellularity and malignancy, particularly in the parotid gland (6). Similarly, recent research with diffusion-weighted imaging has demonstrated lower ADC values in malignant tumors compared with benign lesions (7). In the parotid gland, it is important to assess for involvement of the deep lobe and perineural spread along the mastoid segment of the facial nerve superiorly through the stylomastoid foramen (Fig. 23.6). On ultrasound, as lesions enlarge, they adopt a more heterogeneous appearance and exhibit high vascular resistance on color Doppler imaging (4).
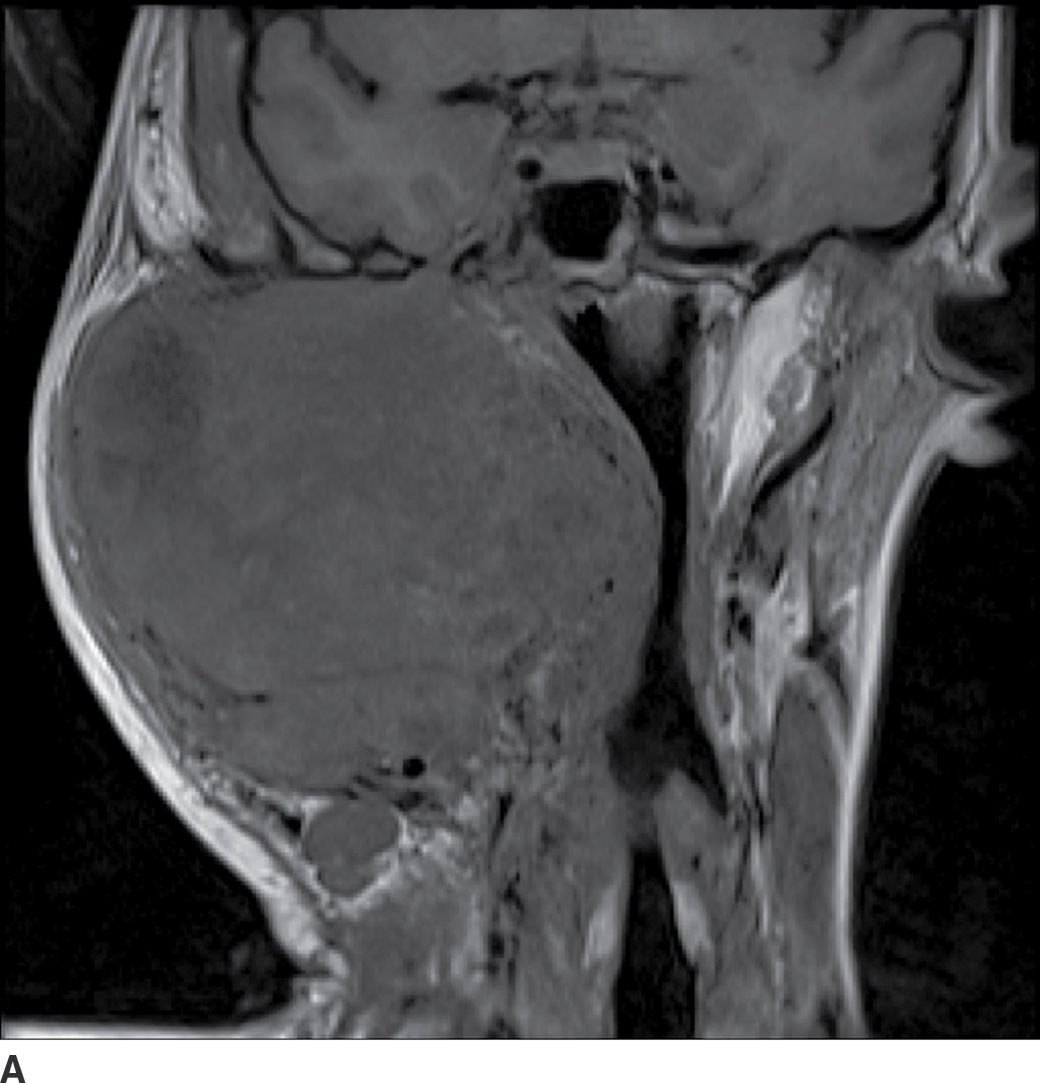
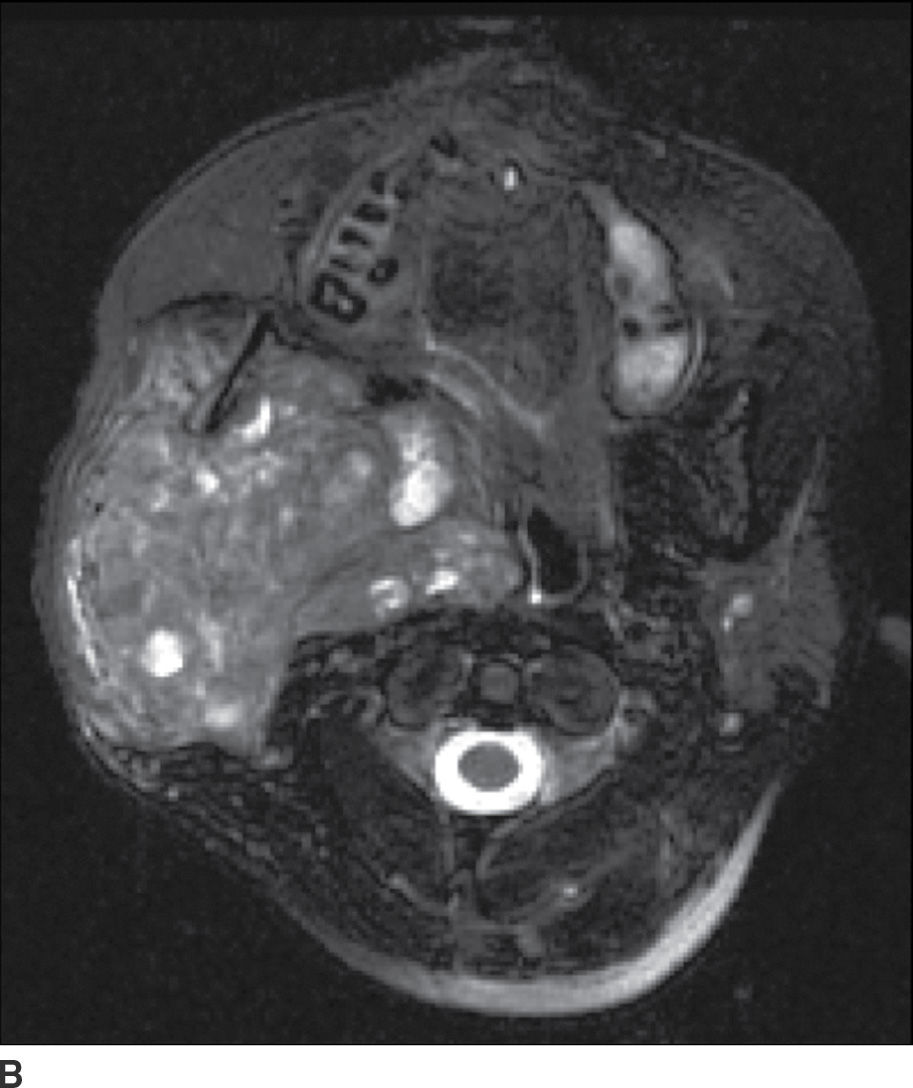
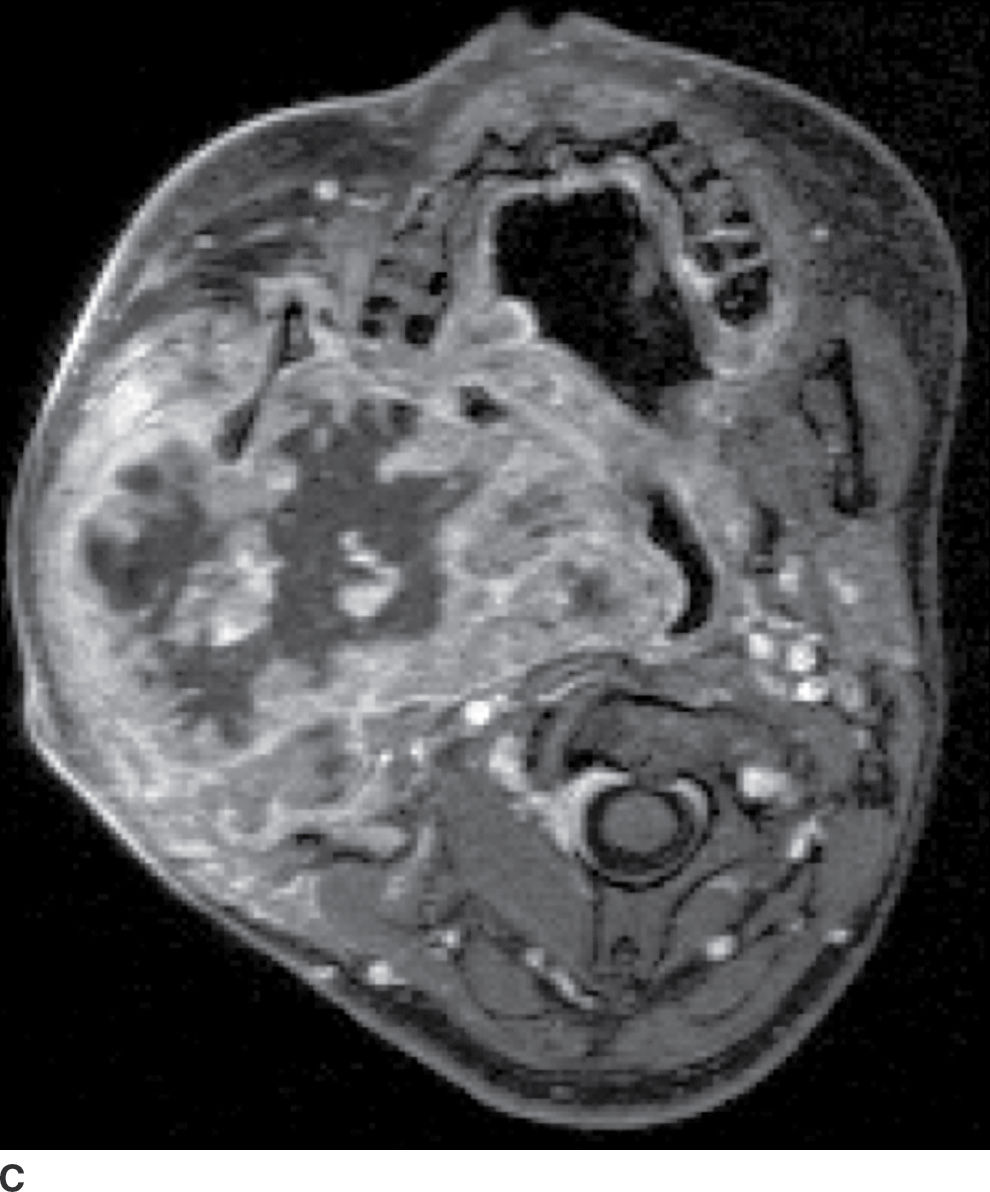
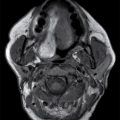
FIG. 23.5 Mucoepidermoid carcinoma. Coronal T1-weighted (A), axial T2-weighted fat-suppressed (B), and axial T1-weighted fat-saturated contrast-enhanced (C) MR images show a large markedly heterogeneous, partially necrotic centered in the right parotid gland with extension into the parapharyngeal and masticator spaces with significant compression and deviation of the airway.
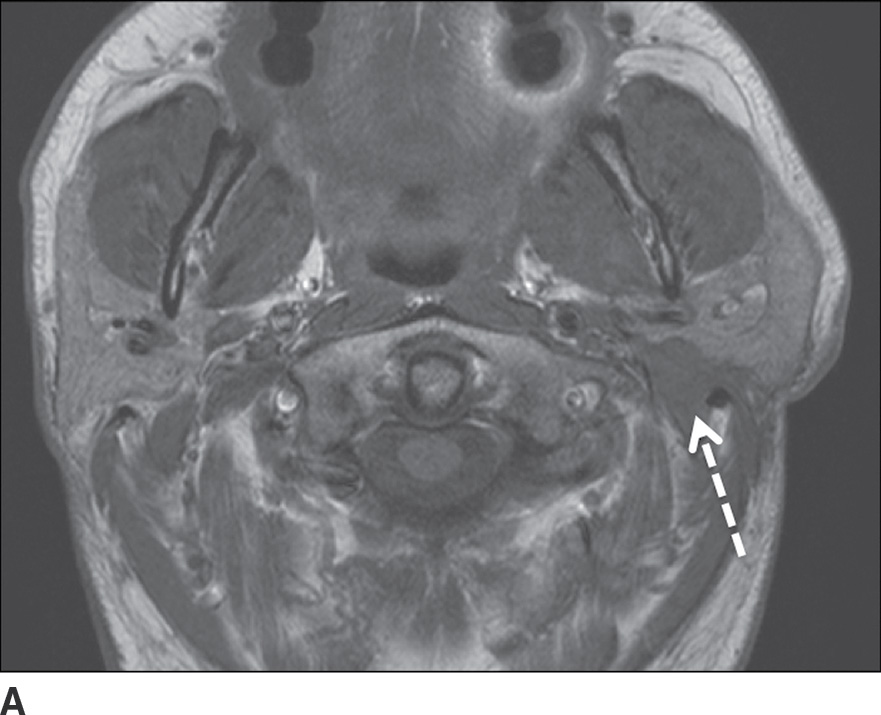
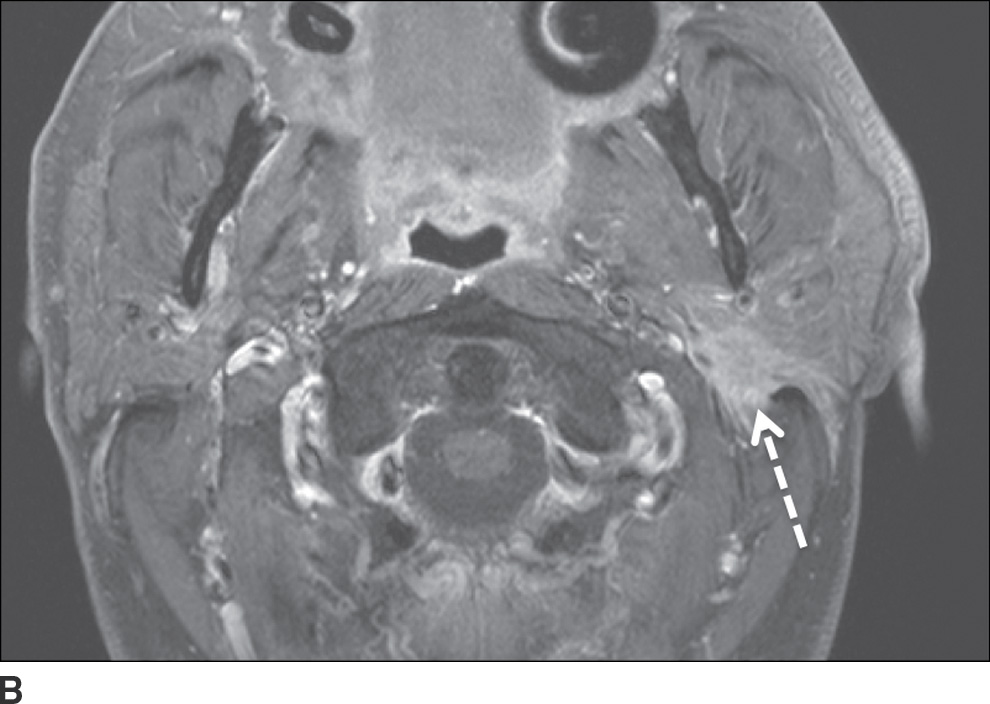
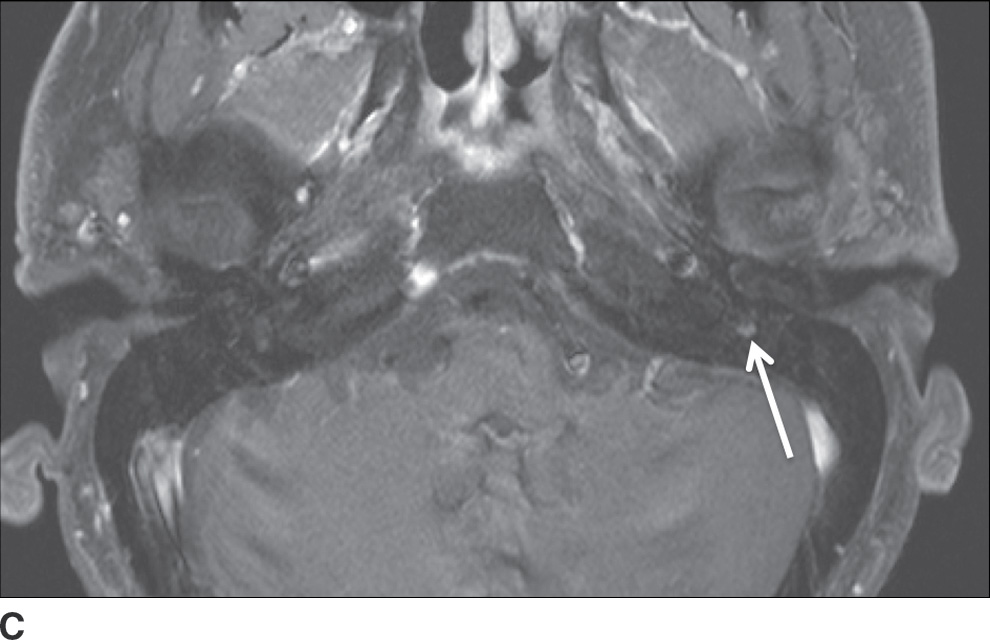
FIG. 23.6 Adenoid cystic carcinoma with perineural tumor spread along CN VII. Axial T1-weighted (A) and axial T1-weighted fat-saturated contrast-enhanced (B) images of the neck at the level of the parotid gland and axial T1-weighted fat-saturated contrast-enhanced (C) image at the level of the nasopharynx more superiorly show an ill-defined enhancing mass within the deep lobe of the parotid gland (dashed arrow) with extension to the superficial lobe and abnormal enhancement within the mastoid segment of the left facial nerve (solid arrow) compatible with perineural spread.
Lymphoma
The rare primary lymphoma arising from the salivary glands is classified as a mucosa-associated lymphoid tissue (MALT) lymphoma and most commonly involves the parotid gland. Secondary involvement of the parotid gland is also rare. CT demonstrates enlarged intraparotid lymph nodes with homogeneous enhancement or an ill-defined diffusely infiltrating parotid lesion. MR shows homogeneous intermediate signal intensity lesions on all sequences with enhancement following gadolinium administration. Sonographic evaluation reveals either defined intraglandular masses or an enlarged gland with altered echotexture and hypervascularity characteristic of an infiltrating tumor (8). The invasive-appearing lesions cannot be radiographically differentiated from leukemic infiltration, which is also rare. (9)
Lymph node metastases
Because the parotid space is the first-order nodal station for squamous cell carcinoma and melanoma of the upper face, scalp, auricle, and external auditory canal, it is not infrequently involved by metastatic disease. These lesions most commonly appear as unilateral well-defined intraparotid masses, though they may appear infiltrative later on in the disease course due to extracapsular spread. The lesions may show necrosis on CT and MR. Associated preauricular and cervical lymphadenopathy may be present (3). Table 23.2 is a summary of parotid masses and their distribution.
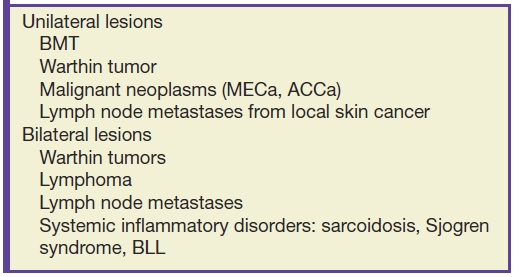
Table 23.2 Unilateral and Bilateral Parotid Masses
Systemic and autoimmune disorders
One of the early manifestations of HIV disease is the formation of benign lymphoepithelial lesions (BLLs) in the parotid glands. Thought to arise due to obstruction of terminal intraglandular ducts resulting from lymphoid hypertrophy, BLL is a reactive phenomenon seen in approximately 5% of patients with HIV. Although they most commonly appear on CT, MRI, and US as well-defined cystic masses (Fig. 23.7), they may manifest as solid masses as well. The lesions are frequently associated with cervical lymphadenopathy (10).
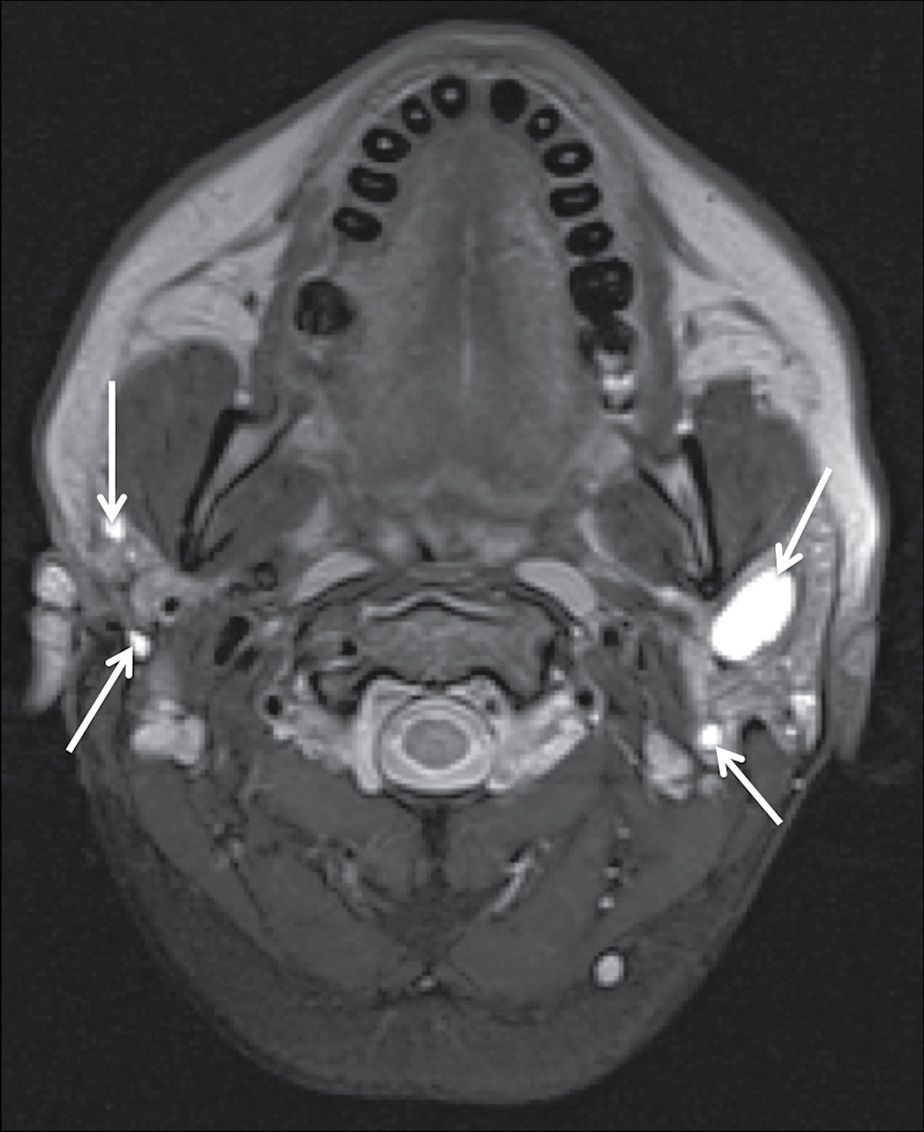
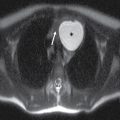
FIG. 23.7 Benign lymphoepithelial lesions of HIV. A fat-saturated T2-weighted image of the neck demonstrates multiple cystic lesions within both parotid glands (arrows) in a patient with findings of prominent nasopharyngeal soft tissues and cervical lymphadenopathy (not shown).
Sjogren syndrome (SS) is an autoimmune disorder characterized by dense lymphocytic and plasma cell infiltration and acinar destruction of the salivary and lacrimal glands. This results in xerostomia and xerophthalmia, and patients may present with tender or nontender glandular enlargement. While normal in radiologic appearance early on, the parotid glands develop a hyperdense appearance followed by a “honeycomb” or “salt-and-pepper” appearance on CT. These globular lesions are T1 hypointense and T2 hyperintense due to the watery saliva (Fig. 23.8) and appear on MR sialography as a “leafless fruit-laden tree” or “mulberry tree.” Eventually, progressive acinar destruction leads to central duct dilatation (1). Ultrasound demonstrates an inhomogeneous gland with multiple scattered oval hypoechoic or anechoic foci and increased vascularity. Because SS increases the odds of development of lymphoma within the salivary glands by 44-fold (11), biopsy is recommended for fast-growing nodal lesions or those exceeding 2 cm in size (12).
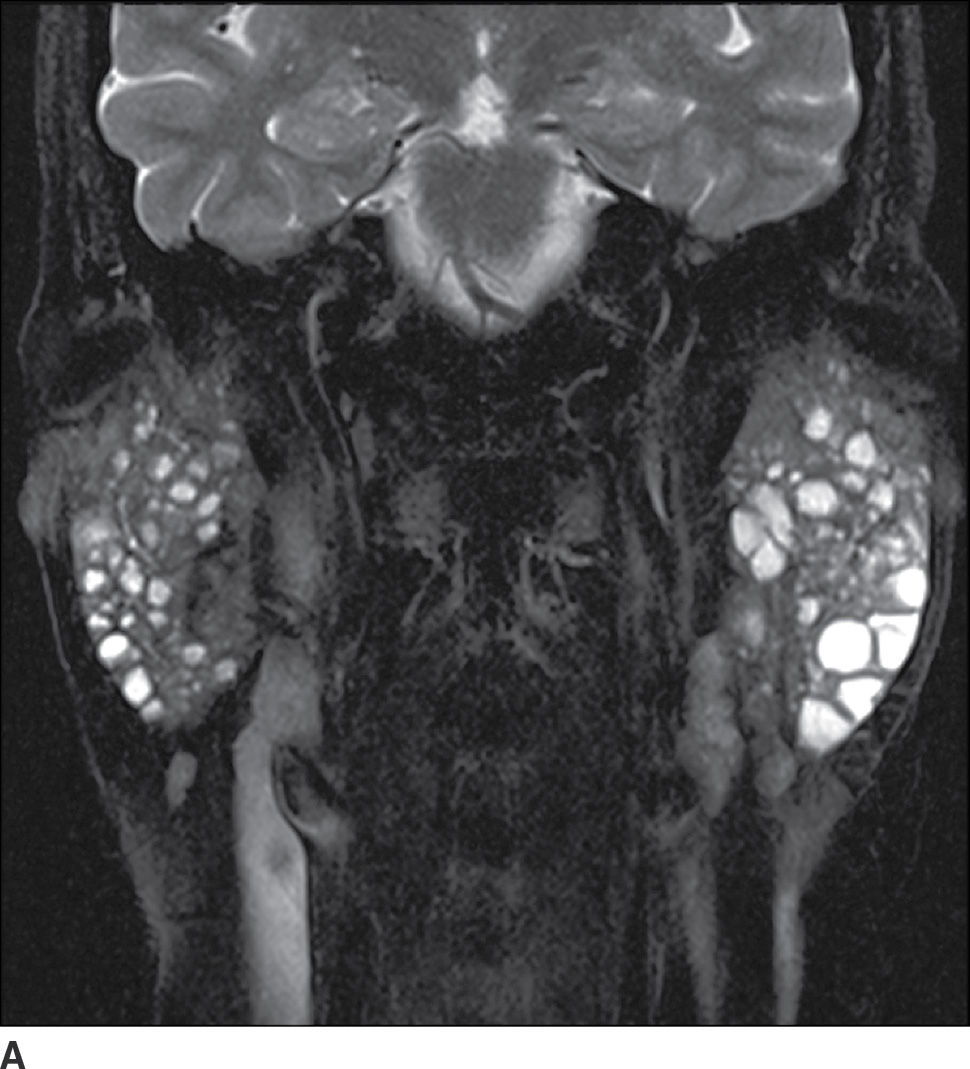
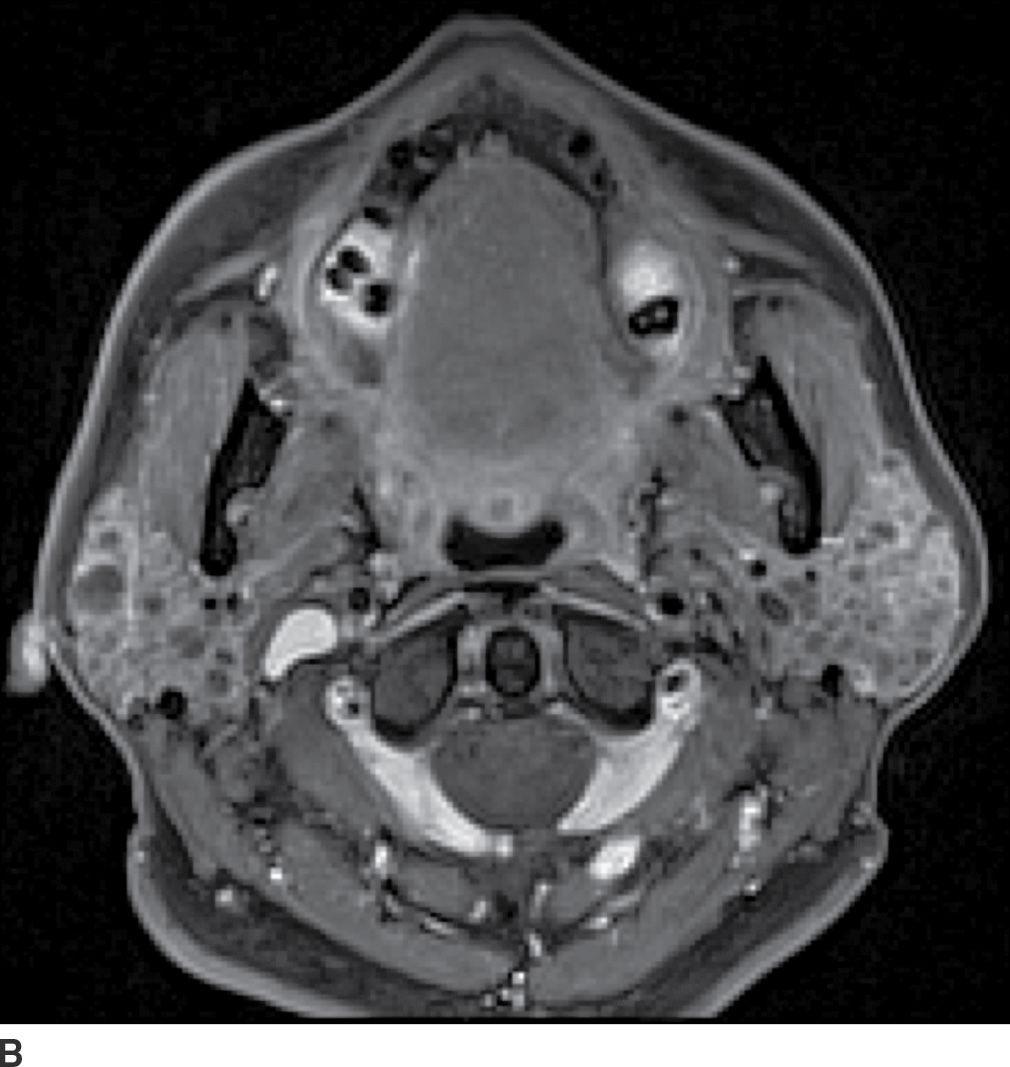
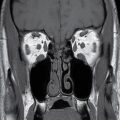
FIG. 23.8 Sjogren syndrome. Coronal T2-weighted fat-saturated (A) and axial T1-weighted fat-saturated postcontrast (B) images of the neck demonstrate innumerable globular nonenhancing cystic lesions within the parotid glands bilaterally.
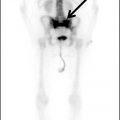
Sarcoidosis is an idiopathic systemic disorder characterized by formation of noncaseating granulomas and involves the parotid glands in 6% of patients (13). It is commonly bilateral and is a manifestation of advanced disease. Patients may present with Heerfordt syndrome, defined as a constellation of fever, parotid gland enlargement, facial palsy, and ocular involvement. On imaging, the parotid glands are typically enlarged with increased enhancement and may demonstrate well-defined noncavitating masses corresponding to granulomas that cannot be radiographically differentiated from lymphoma (1). MRI shows diffusely increased T2 signal within the gland (14). Cervical lymphadenopathy is often present. Nuclear scintigraphy with gallium 67 citrate (Ga-67) classically shows radionuclide accumulation within the parotid and lacrimal glands as well as the nasopharynx producing the appearance of the face of a panda (the “panda sign”) (Fig. 23.9) (15).
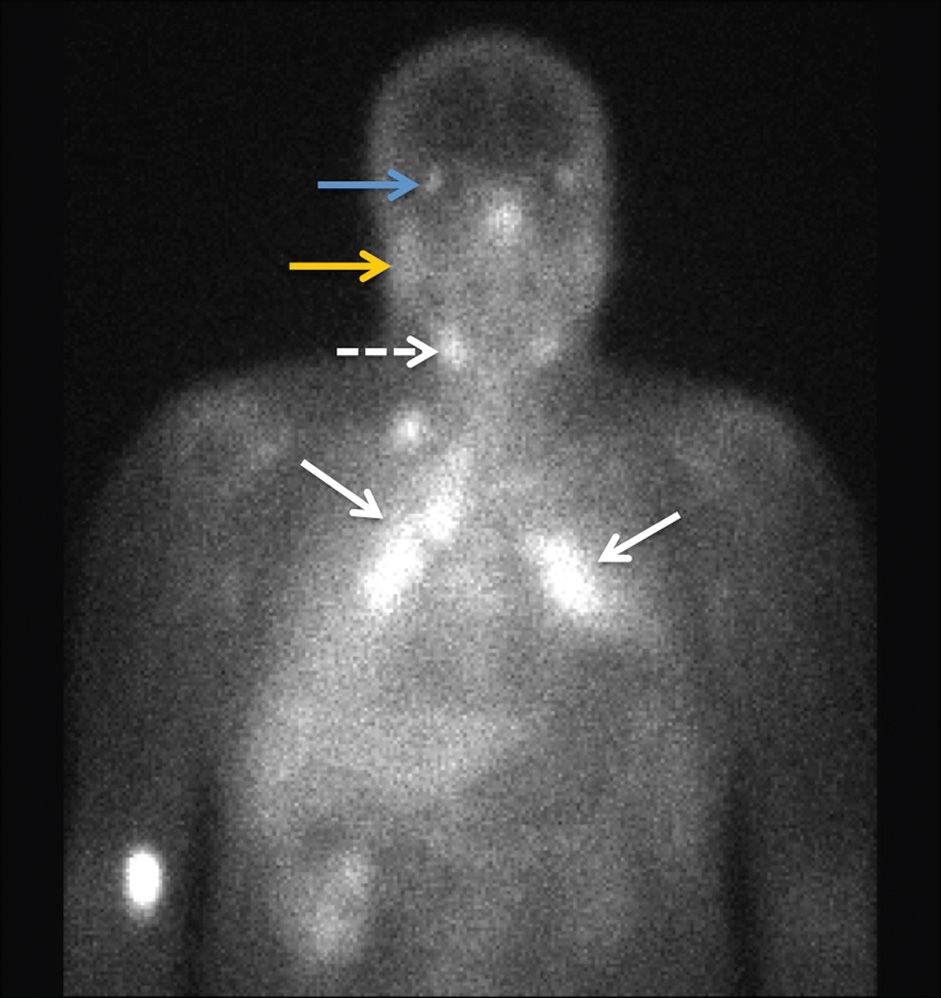
FIG. 23.9 Sarcoidosis. A 24-hour planar image from a gallium 67 citrate nuclear scan shows increased activity within the bilateral paratracheal and hilar regions demonstrating the “lambda sign” (solid arrows) as well as increased uptake in the submandibular (dashed arrow), parotid (yellow arrow), and lacrimal (blue arrow) glands compatible with the “panda sign.” There is mild diffusely increased activity in bilateral lungs, as compared to the liver, indicative of disease activity.
Sialadenitis
The vast majority (90%) of sialadenitis cases occurs secondary to an obstructing calculus or ductal stenosis, most frequently affecting the submandibular ductal system (85%) followed by the parotid system (3). Sialadenitis may also be secondary to an obstructing floor of mouth tumor. Rarely, Sjogren syndrome, AIDS, and bacterial (Staphylococcus aureus, oral flora) or viral (mumps, cytomegalovirus) infections may cause sialadenitis. Patients present with salivary colic, or unilateral painful gland swelling associated with eating.
Contrast-enhanced CT is the imaging modality of choice given easy accessibility in the acute setting and better depiction of calculi and soft tissue inflammatory changes. In acute or subacute sialadenitis, CT and MR imaging show an enlarged affected gland with increased asymmetric enhancement (Figs. 23.10 and 23.11). In contrast, the affected gland is atrophic in chronic sialadenitis. Coexistent cellulitis and myositis may be evident. In cases of obstructive sialadenitis, ductal dilatation will be present, with a transition zone at the site of obstruction; a search for an obstructing calculus or tumor should be undertaken. MR sialography utilizing heavily T2-weighted sequences shows the ducts to great advantage and is able to demonstrate strictures and sialolithiasis.
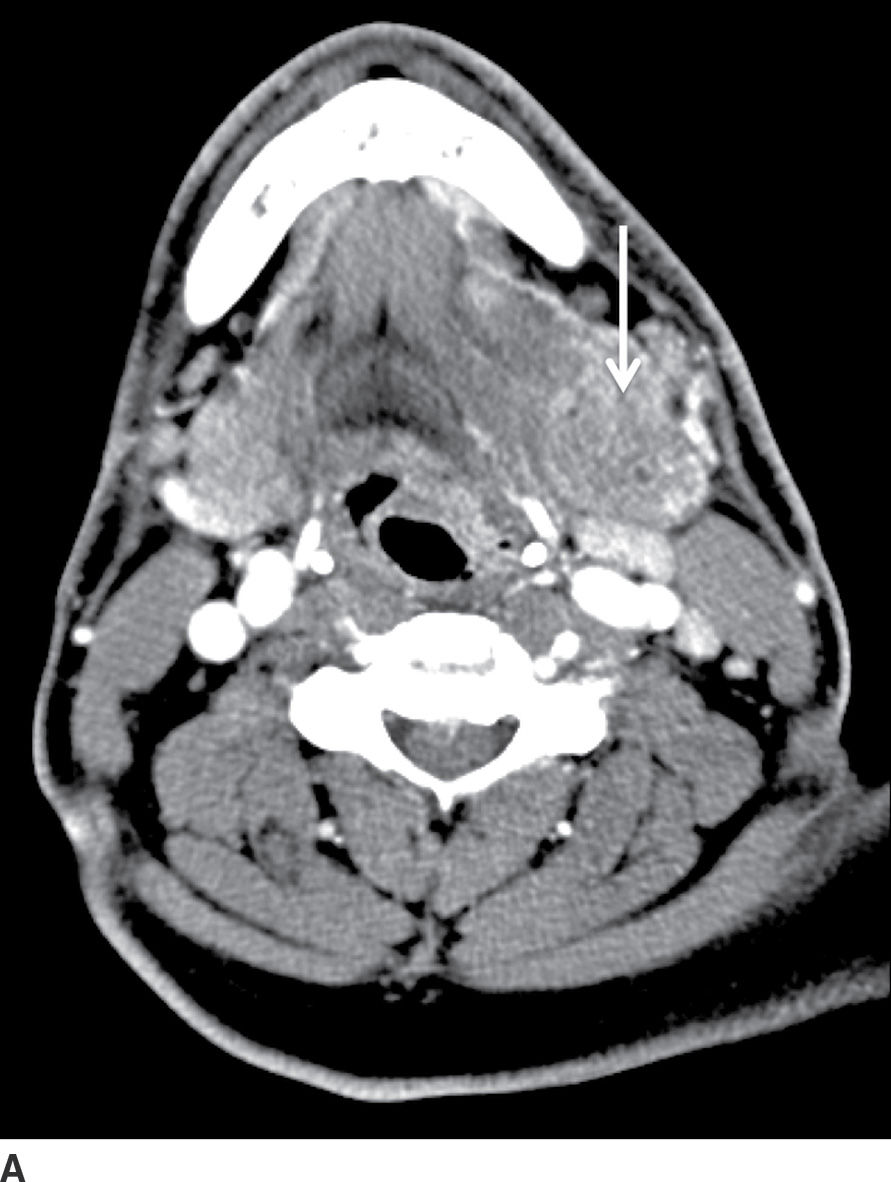
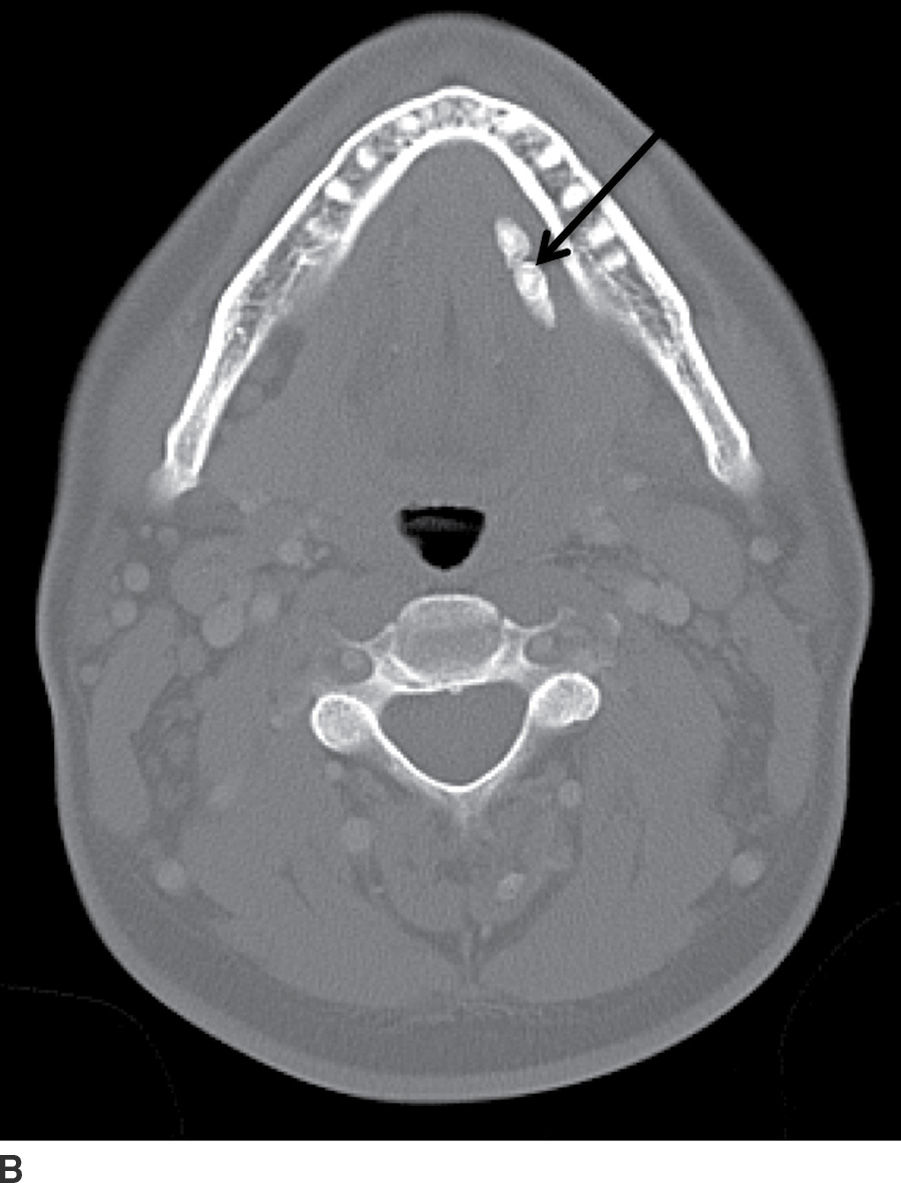
FIG. 23.10 Acute calculous sialadenitis. Contrast-enhanced CT images of the neck in soft tissue (A) and bone windows (B) demonstrate an enlarged hyperenhancing left submandibular gland (white arrow), with two calculi seen distally within the left Wharton duct (black arrow).
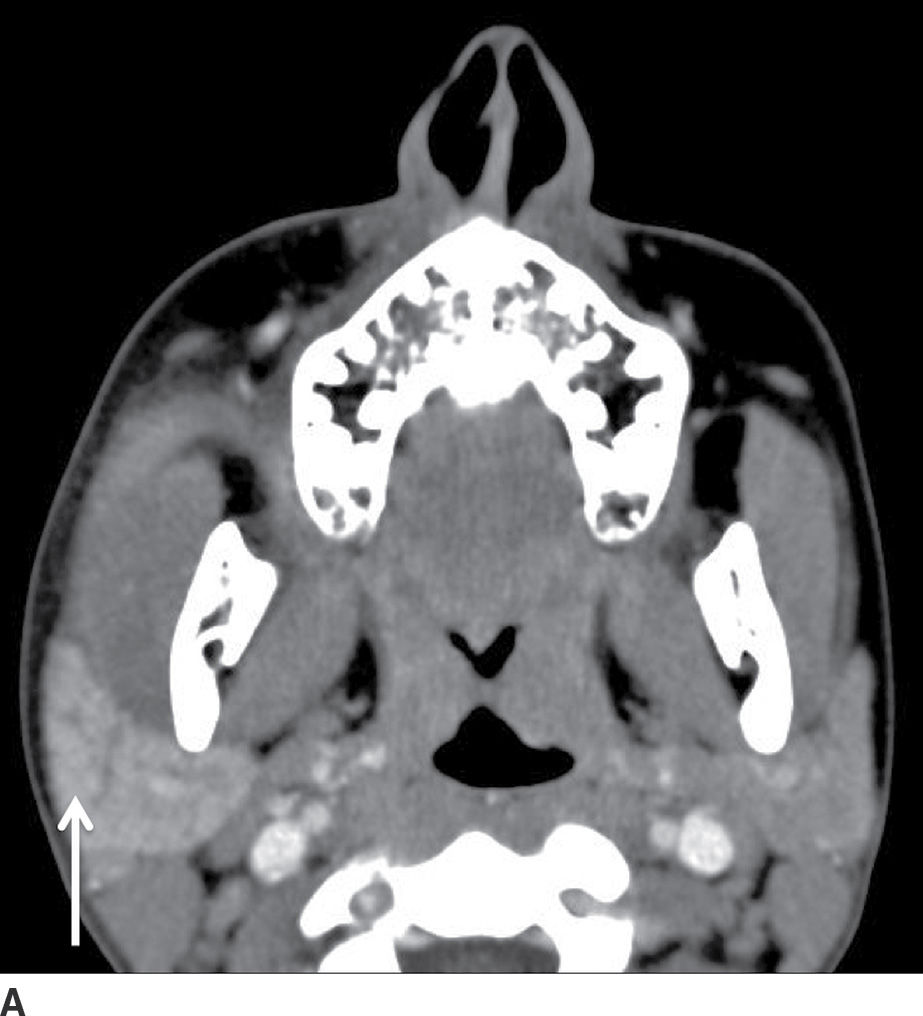
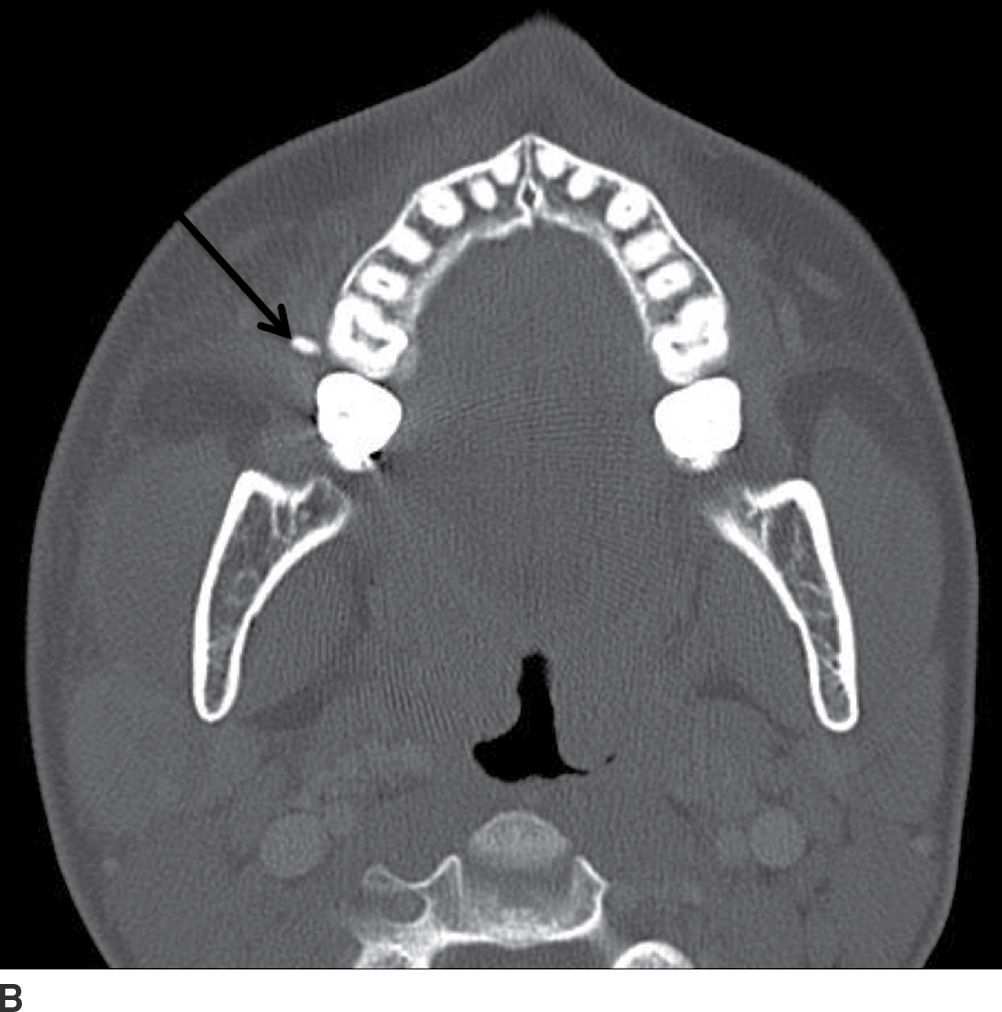
FIG. 23.11 Acute parotitis with obstructing stone. Contrast-enhanced CT images of the neck in soft tissue (A) and bone windows (B) demonstrate an enlarged hyperenhancing right parotid gland (white arrow), with a calculus seen distally within the parotid duct (black arrow).
Related posts:
Stay updated, free articles. Join our Telegram channel

Full access? Get Clinical Tree


