Fig. 1
Drawing depicting the relative size of a Definity® microbubble (in blue) compared to an erythrocyte within a large capillary
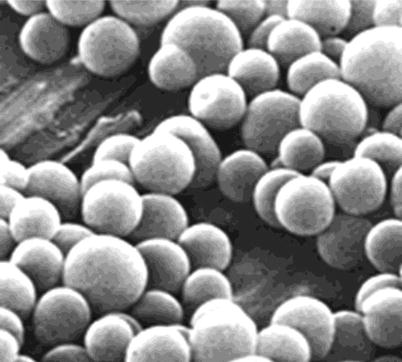
Fig. 2
Picture of Definity® microbubbles showing relative uniformity of size between 2 and 3 μm
Microbubbles have also been routinely utilized in echocardiography and have many other potential applications in vascular disorder such in the evaluations of endovascular stent leaks. In addition, several potential therapeutic applications for microbubbles such as clot lysis and enhanced drug delivery are under active investigation.
Instrumentation and Technique
Contrast-enhanced transvaginal sonography requires the use of microbubble contrast and specialized software for image processing. Most high-end scanners are equipped with various contrast-visualization tools. Additionally, a specialized image processing software is needed for quantification of enhancement kinetics. Scanning and image analysis can be performed within one-half to one hour, making the procedure a reasonable time commitment in a clinical setting.
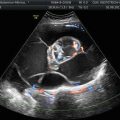
Before contrast is administered, a complete transvaginal sonogram of the adnexa followed by color and spectral Doppler examination is performed. A detailed morphologic analysis of an adnexa mass for papillary excrescence, irregular wall or septations, as well as any internal content is required prior to contrast administration. This morphologic analysis can be further enhanced using 3D imaging. Following morphologic assessment, color Doppler sonography is performed with particular attention to the vessel distribution and caliber in areas of morphologic abnormality. Color Doppler sonography provides information regarding overall vascularity and vessel distribution. Selected vessels can be interrogated with spectral Doppler for their relative resistance as quantitated by waveform analysis.
Once the preliminary morphologic and color Doppler portions are completed, the contrast-enhanced part of examination can be performed. Microbubble contrast is prepared by either reconstituting lyophilized powder composed of polyethylene glycol, phospholipids, and palmitic acid with normal saline (SonoVue, Bracco Imaging S.p.A.) or activating the contrast by shaking the vial for 45 s using a mechanical agitator (Lantheus Medical Imaging, N. Billerica, MA) (Fig. 3). Using a 3-way stop cock, the contrast is slowly injected into an intravenous line within an antecubital vein, followed by a 10 cc bolus of normal saline. Very tiny amount of contrast (2–3 μl of Definity or 2.4 ml of SonoVue) is needed to provide adequate contrast. Flow of microbubbles within the ovary usually is observed within 30 s of injection.
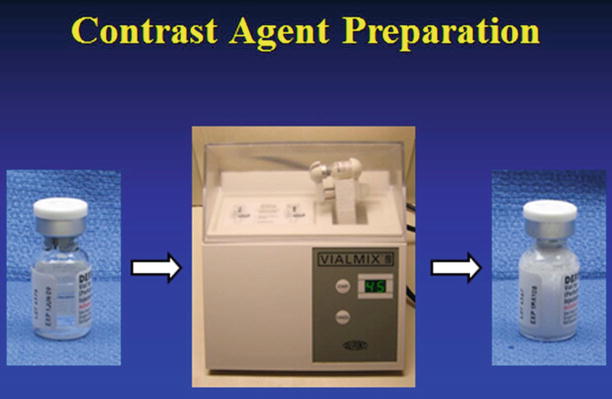
Fig. 3
Picture showing a vial containing microbubbles before (left) and after (right) their suspension in solution. The fluid appears milky once they are suspended in solution and ready for injection
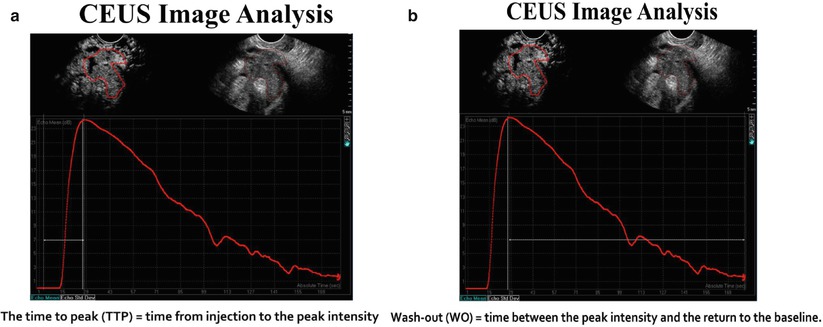
Harmonic imaging is performed with particular attention to areas of increased vascularity seen on a color Doppler sonography. Once the microbubbles have been injected, a 3-min cine loop is recorded using a dedicated off-line software system specifically designed to quantitate enhancement parameters.
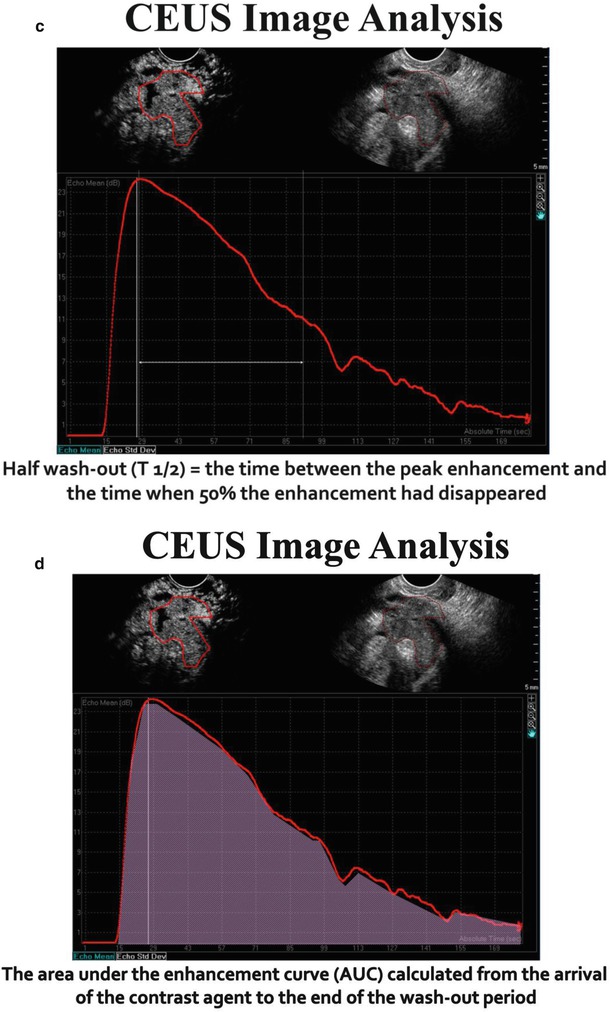
The time-intensity curves that represent enhancement patterns can be quantitated in selected regions of interest. The following parameters can be quantitated:
Wash-in time (s)
Peak enhancement (dB)
Washout time (s)
Area under curve (s−1)
The microvascularity of selected region of interest within an ovarian mass can be characterized by enhancement patterns depicted on time-intensity curves. The arrival of contrast to adnexa typically occurs approximately 30 s after IV administration of contrast. Time to peak reflects cardiac output and tone as well as intratumoral pressure, whereas peak intensity and area under curve (AUC) reflect vascular volume. The washout time reflects the complexity of the vascular network which in tumors is characterized by numerous micro- and macroscopic arteriovenous malformations.
Our series has utilized Definity® which is a perflutren gas microbubbles with a lipid shell (Lantheus Medical Imaging, N. Billerica, MA) where others have used SonoVue® (Bracco Imaging S.p.A.), which is a sulfur hexafluoride microbubbles with a phospholipid shell. Both sonographic contrast agents have been found to be safe with no reports of significant toxicity after many thousands of patients receiving the pharmaceutical. Although our research is considered “off-label” as conducted with Institutional Review Board approval, it is envisioned that these agents will receive approval for general use soon.
Clinical Studies
The initial reports describing the use of microbubble contrast sonography for ovarian mass evaluation utilized color Doppler sonography [4, 5]. The temporal resolution of color Doppler sonography is limited due to blooming artifacts. Even with this limitation, several initial investigations showed that malignant ovarian masses had greater vascularity than benign ones [4, 5].
The development of harmonic imaging greatly enhanced the accuracy of sonography depiction of tumor vascularity. Marret’s study of 101 adnexal masses, 23 malignancies and 78 benign ones, reported a significant difference in the washout times and area under curve with sensitivity between 96 and 100 % and specifically between 83 and 98 %. In a similar study, Testa’s initial report described improved accuracy in distinguishing benign from malignant ovarian masses over morphologic analysis [6].
Our group’s study of 57 ovarian masses, 13 of which were malignant, focused on difference in enhancement kinetics in benign vs. malignant ovarian lesions [7, 8]. Significant differences are observed in peak enhancement, washout time, and area under curve (Figs. 4, 5, 6, 7, and 8). Even though there was no statistically significant difference in time to peak (wash-in time) 20.2 ± 5.9 s vs. 29.8 ± 13.4 s p = 0.4, there were statistically significant differences in greater peak enhancement (21.3 ± 4.7 vs. 8.3 ± 5.7 dB (p < 0.01) and one-half washout time (104.2 ± 48.1 vs. 413.8 ± 294.8 s) (p < 0.001) in malignancies. After the data was analyzed using receiver-operator curves, it was determined that and AUC > 787 s−1 was the most accurate diagnostic criterion for ovarian cancer with 100 % sensitivity and 96.2 % specificity. Similar calculations showed that peak enhancement >17.2 dB had a 90 % sensitivity and 98.3 % specificity and a one-half washout time of 741.0 s had a 100 % sensitivity and 92.3 % specificity (Figs. 9, 10, and 11). In a follow-up study comparing CE-TVS to 2D and 3D color Doppler sonography, CE-TVS was shown to have greater sensitivity and specificity (Fig. 12).
 Benign Sex Cord-Stromal Tumors: Clinical and Ultrasound Features
 Ovarian Tumors: Computed Tomography and Magnetic Resonance
 Cord-Stromal Tumors: Computed Tomography and Magnetic Resonance
 and MR of Benign Ovarian Germ Cell Tumours
 Ovarian Tumors (Serous/Mucinous/Endometrioid/Clear Cell Carcinoma): Clinical Setting and Ultrasound Appearance
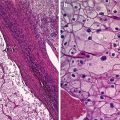 Histopathology


Related posts:
Benign Sex Cord-Stromal Tumors: Clinical and Ultrasound Features
Ovarian Tumors: Computed Tomography and Magnetic Resonance
Cord-Stromal Tumors: Computed Tomography and Magnetic Resonance
and MR of Benign Ovarian Germ Cell Tumours
Ovarian Tumors (Serous/Mucinous/Endometrioid/Clear Cell Carcinoma): Clinical Setting and Ultrasound Appearance
Histopathology
Stay updated, free articles. Join our Telegram channel
Full access? Get Clinical Tree
