Fig. 21.1
Strain elastography can be explained simply by the following example. An almond is present within a bowl of gelatin. If we apply pressure with a spoon (strain), the gelatin changes shape because it has high strain (soft), while the almond remains unchanged because it has low strain (stiff). The algorithm used in strain elastography evaluates the frame-to-frame changes of tissue occurring when a compression/decompression force is applied. A gray-scale or color map is used to display the relative stiffness of the tissues in the FOV
SE is performed on standard ultrasound equipment with software that evaluates the frame-to-frame differences in deformation in tissue when a force (stress) is applied. The force can be from patient movement, such as breathing, heartbeat, or external compression with rhythmic motion of the ultrasound transducer as the source of the movement [2–4]. In SE the absolute strain modulus value cannot be calculated because the amount of the push (force) cannot be accurately measured. The real-time SE image is displayed with a scale based on the relative strain of the tissues within the FOV.
The technique required to obtain the optimal images varies with the algorithm used by the manufacturer of the system [2–4]. For SE the amount of external displacement needed varies depending on the algorithm used. With some manufactures very little if any manual compression is needed; with others a rhythmic compression release cycle is required. With experience and practice the optimum compression technique to obtain optimal image quality can be learned.
The algorithm used in SE requires the strain changes remain within the imaging plane. The same slice of the lesion needs to remain in the imaging plane during the compression/release cycle. Monitoring of the B-mode image to confirm the lesion is only displaced in depth during scanning, and only moving in the field of view will allow for optimal images. With the displacement technique one cannot be surveying an organ, scanning must be done in one stationary position.
Results can be displayed in gray scale or with various color displays; preference is often determined by the user’s exposure to elastography and preference in interpretation. In the gray-scale map, soft is coded white, while hard is coded black. It is important to remember that in SE a relative scale is displayed and should not be confused with shear wave imaging where an absolute stiffness value is obtained and color coded on a per pixel basis.
Because SE is a relative technique, a lesion may appear a different shade of gray (or color) depending on the other tissues in the field of view. For example, in a patient with normal dense breast tissue and fat, the fat will appear white (soft) as it is the softest tissue in the field of view. However, if only fat is in the field of view, some of the fat will appear black (hard) because it is the stiffest tissue in the field of view (Fig. 21.2). This can cause difficulty in interpretation. Therefore, a large FOV with multiple tissue types is helpful in image interpretation.
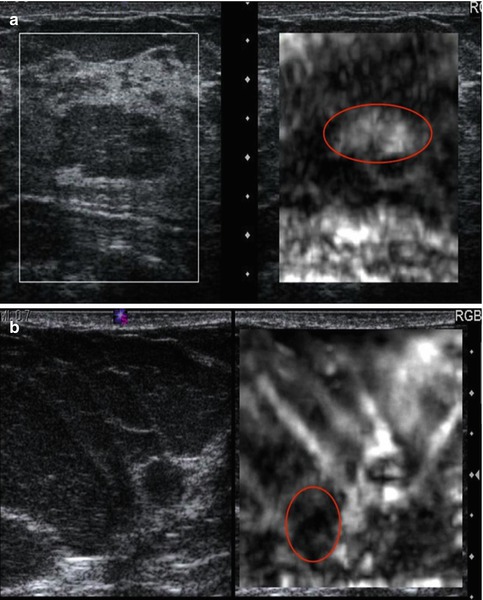
Fig. 21.2
Elastogram of a fat lobule (red circle) in fibroglandular breast tissue is presented in (a). The conventional B-mode image is on the left and the elastogram is on the right. The fat lobule is white (soft) on the elastogram, while the fibroglandular tissue is black (hard). The scale on the elastogram is based on the stiffness of the tissues in the FOV. In this case the fat is the softest tissue and therefore white, while the fibroglandular tissue is black since it is the stiffest tissue present. In (b) almost the entire FOV is fat. Therefore, the algorithm codes the stiffest fat as black (red circle) even though it is a very soft tissue. These two cases demonstrate the relative scale used in strain. A given tissue can appear a different shade of gray depending on the other tissues present in the FOV
A critical factor in generating a diagnostic elastogram is the amount of pressure you apply when scanning [5]. This is called pre-compression. This is different than the amount of displacement used in generating the elastogram. Scanning with a “heavy hand” compresses the tissues and changes their elastic properties. This pre-compression markedly changes the image quality and can significantly affect results (Fig. 21.3). This is confirmed with SWE where the speed of the shear wave can change by a factor of 10 based on pre-compression. As pre-compression increases the differences in shear wave speed between tissues decrease leading to less conspicuity between tissues. If enough pre-compression is applied, all tissues are similar and the elastogram changes are mostly noise.
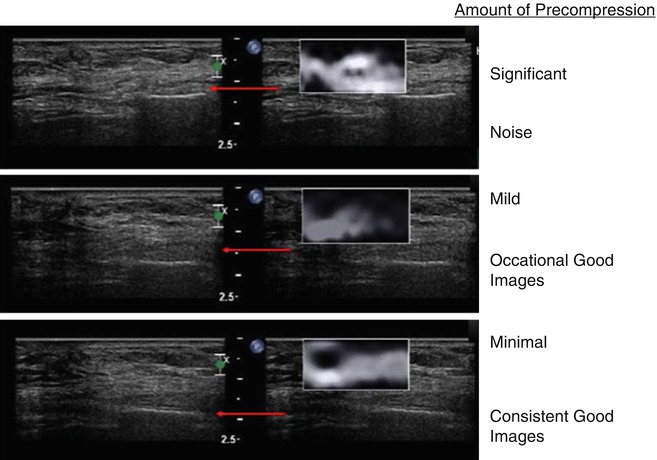
Fig. 21.3
When pre-compression is applied to tissues they become stiffer. The increase in stiffness varies with different tissues. Therefore, the relative stiffness changes between tissues affect the strain elastogram. The increase stiffness is also detected as increased shear wave velocities in shear wave elastography. The effects on ES are demonstrated in this example of a epidermoid cyst. When significant pre-compression is applied, all tissues (upper frame) have similar strain and the image is all noise. When mild pre-compression is applied, there are frame-to-frame differences in the appearance of the lesion (middle frame). When minimal pre-compression is applied (lower frame), the lesion is similar in all frames of the elastogram
A technique to apply minimal amount of pre-compression reproducibly has been described [5]. Usually a mild amount of pre-compression is used to obtain B-mode images as it improves B-mode image quality. The “quality factor” or “compression bar” used in some manufactures equipment does not assess the amount of pre-compression being applied. It only evaluates the amount of displacement of tissues during the compression and release cycle.
21.1.2.1 Strain Elastography Using an ARFI Pulse
The use of a low-frequency ultrasound pulse (a push pulse) can be used as the source of the displacement. This technique is called acoustic radiation force impulse (ARFI) [6–8]. Using ARFI to create the displacement of tissue and analyzing the displacement changes with the same strain algorithm, an SE image is obtained. Note that this is different than SWE where the speed of the shear wave (Vs) generated from the ARFI pulse is measured. The ARFI pulse power is limited by guidelines of energy input into a body, thus can be limited by depth penetration.
If an ARFI push pulse is used to generate the tissue displacement, no manual displacement should be used. The probe should be held steady and the patient asked to hold their breath and remain motionless during the acquisition. The algorithm used to generate the elastogram is similar to SE on the same system. In general the ARFI push pulse is limited in producing displacement deeper than 4 cm with the breast imaging transducer and up to 9 cm in abdominal applications.
21.1.3 Shear Wave Elastography
A second technique to determine the elastic properties of a tissue is SWE. In this technique an initial ultrasound pulse (push pulse) or ARFI is applied to the tissue that induces a shear wave perpendicular to the ultrasound beam. This is similar to dropping a stone (the push pulse) into a pond of water. The ripples generated correspond to the shear waves. Conventional B-mode ultrasound sampling techniques are used to calculate the speed of the shear wave generated through the tissues. This is diagramed in Fig. 21.4. From the speed of sound through the tissues, the strain modulus can be estimated. The velocity of the shear wave is proportional to stiffness. The hardness of a lesion can be displayed as the speed of the shear wave (Vs, meters/second (m/s)) through the tissue or the strain modulus (kilopascals (kPa)). With SWE a quantitative measure of the lesion stiffness is obtained either in point of interest or in an FOV with pixel-by-pixel color coding of the Vs.
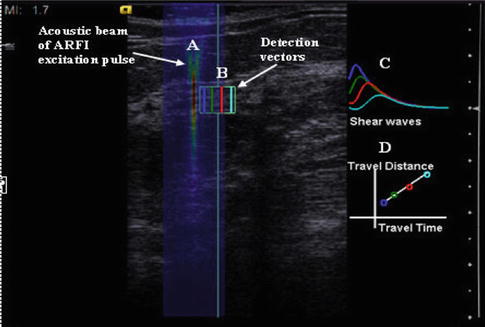
Fig. 21.4
Shear wave elastography is performed by applying a push pulse (ARFI). This high-energy pulse (A) generates shear waves which propagate perpendicular to the push pulse. Conventional ultrasound is used to monitor the shear waves within the tissue (B). The shear waves have higher signal intensity closer to the push pulse and the amplitude of the peak decreases with distance from the push pulse (C). (D) By plotting the time to peak and the distance from the push pulse, the velocity of the shear wave can be calculated. It can be expressed either as the velocity in m/s or with some assumptions the Young’s modulus in kPa
Two shear wave systems are presently available. In the ACUSON S3000TM ultrasound system (Siemens, Mountain View, CA.), a measurement in a small ROI can be obtained (Virtual Touch tissue quantification, VTq) as well as a pixel-by-pixel evaluation of a larger FOV using a color map (Virtual Touch IQTM, VTiq). In VTiq after the initial push pulse, tracking signal vectors are used to detect the tissue displacement as the shear wave passes and thus reconstruct its velocity in a region of interest, which can be displayed as a qualitative image of elasticity or a quantitative image displayed as shear wave speed. A single image is obtained. The tracking vectors with focused transmit results in less noisy and more stable shear wave signal detection. In the Aixplorer (SuperSonic Imagine (SSI), Aix-en-Provence, France), the effect of the push pulses is amplified by sending a series of pulses successively focused at increasing depths faster than the shear wave’s velocity, so that a Mach cone front is generated. A high imaging frame rate is achieved by transmitting a plane wave that insonates the entire field of view in a single burst. The result is that the shear wave velocity can be measured and displayed (in m/s or kPa) as a quantitative color overlay image at a frame rate of around 1 frame/s. The SSI technique has been shown to be highly qualitatively reproducible based on shape, homogeneity and color distribution with only 1.6 % of cases being very dissimilar [9]. Lesion size measurements were highly reproducible (>0.9) and inter-observer reliability for maximum and mean elasticity values were also highly reproducible (>0.8). The E mean value is the most reproducible elasticity measurement [9].
The principles of scanning using SE also pertain to SWE. Pre-compression can change results and it is recommended the same technique discussed above be used to acquire shear wave images. On some systems SWE can be performed in real time; however, to obtain optimal images, remaining in the same plane for several seconds is required for accurate measurements. Shear wave propagation by an ARFI pulse is depth limited. If a shear wave is not generated, a value will not be obtained in the point quantification method and there is no color coding of the area in the FOV method. Repositioning the patient to make the lesion closer to the skin surface can help in these cases. For small parts a 3D probe is now available which allows for a volumetric elastogram (Fig. 21.5).
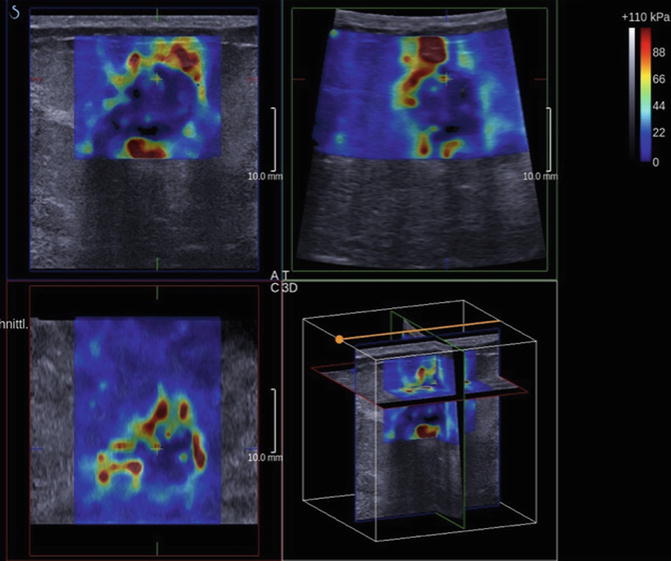
Fig. 21.5
Shear wave imaging can be performed with a 3D technique. The data can be displaced as a volume or selected slices. This example is an invasive ductal cancer. Note the high shear wave velocities surrounding and within the tumor (Courtesy of Dr. D. Amy, Aix-en-Provence, FR)
21.2 Breast
21.2.1 Overview
Although current modalities of breast imaging, including MRI, ultrasound, and mammography, have high sensitivities for detecting breast lesions, they do not have high specificities [10, 11]. This has resulted in close monitoring or unnecessary biopsies of many benign lesions. An imaging modality with a high specificity for detecting malignant lesions would significantly decrease the amount of unnecessary biopsies.
Ultrasound evaluation of the breast was initially used to determine if a lesion was cystic or solid [12, 13]. With the criteria set forth by Stavros et al. [14], ultrasound has had a more important role in breast lesion characterization. These criteria have been incorporated into the ultrasound BI-RADS lexicon [15] and can be used to distinguish between benign and malignant breast lesions. For thousands of years physicians have used palpation for diagnosis of breast cancer [16]. Ultrasound elastography has the potential to quantify the stiffness of a lesion, which was previously judged only subjectively by physical exam [17–19]. Krouskop et al. [20] determined that in vivo there is significant elastographic contrast between cancerous and noncancerous breast lesions. This suggests that elastography should be an excellent technique for characterizing breast lesions as benign or malignant.
21.2.2 Strain
Three methods of interpreting SE images have been proposed, evaluating the size change between the B-mode image and the elastogram, the relative stiffness based on a color scale, and the ratio of the lesion stiffness to fat, the strain ratio.
21.2.2.1 Length Comparison
Using a real-time dual strain elastography system, Hall et al. [21] demonstrated that there was potential to use this technique to characterize breast lesions as benign or malignant. It was noted on SE elastography that benign lesions measure smaller in size than the corresponding B-mode image, while malignant lesions measured larger (Fig. 21.6). They proposed utilizing the ratio of the lesion size on elastography to the B-mode size (EI/B-mode ratio) as a diagnostic criteria for benign or malignant. They used an EI/B-mode ratio of >1.2 for a lesion to be malignant. With these criteria they found a sensitivity of 100 % and a specificity of 75.4 %. Barr [22] in a single-center unblinded trial of 123 biopsy-proven cases using an EI/B-mode ratio of <1.0 as benign and equal to or >1.0 as malignant had a sensitivity of 100 % and a specificity of 95 % in distinguishing benign from malignant breast lesions. A large multicenter, unblinded trial evaluating 635 biopsy-proven cases using Barr’s criteria had a sensitivity of 99 % and a specificity of 87 % [23].
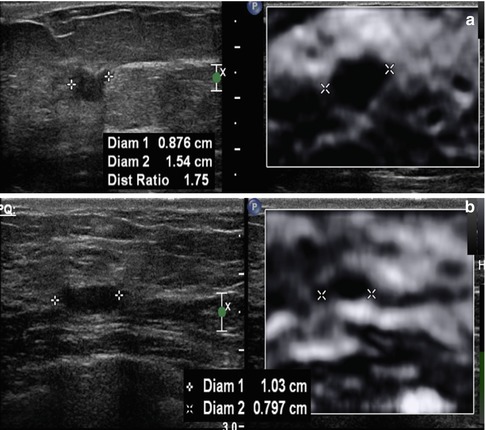
Fig. 21.6
On SE, a unique characteristic occurs in breast lesions. Malignant lesion are larger on the elastogram than on the corresponding B-mode image, while benign lesions are smaller. The EI/B-mode ratio can be used to characterize breast lesions as benign or malignant with high sensitivity and specificity. An example of an invasive ductal cancer in a 69-year-old woman is presented in (a). The lesion measures 0.9 mm on the B-mode image and 15.4 mm on the elastogram, a EI/B-mode ratio of 1.7. A biopsy-proven benign fibroadenoma (b) had a B-mode length of 1.03 mm and an elastogram length of 0.797 mm giving an EI/B-mode ratio of 0.8
Either the lesion length ratio or a lesion area ratio can be used. The lesion is measured in the same position on both the elastogram and B-mode image. The use of a copy, shadow, or mirror function in the measurement technique is helpful. As cases of ductal carcinoma in situ (DCIS) and lobular cancer are often poorly visualized on B-mode imaging, this technique should not be used unless they are defined masses that can be measured with true distinguishable borders. Difficulty can occur when measuring the lesion size on the elastogram when a fibroadenoma or fibrocystic lesion is present in dense breast tissue. The strain properties of the fibrocystic change or fibroadenoma are similar to the background dense breast tissue. Therefore, one may visualize the combination of the lesion and normal dense breast tissue as one lesion, creating a false positive [2–4]. This problem can be avoided by comparing the stiffness of the lesion to surrounding tissue; if it is similar to fibroglandular tissue, it is most likely benign. Using the color scale or lesion-to-fat ratio methods may help eliminate this problem. In the multicenter trial [23] this accounted for a large number of the false positives decreasing the specificity. Strain images obtained using the ARFI technique can be interpreted using this technique.
Shadowing which can be seen with some cancers on B-mode is not seen on the accompanying elastogram. Therefore, the inferior border of the cancer can often be identified on the elastogram [2–4]. As long as there is some B-mode signal identified in the shadowing, the algorithm will be able to determine the strain in those pixels. However, if the shadowing is extreme and no returning signal is identified, there is no correlation identified and the pixels will be coded as white [2–4].
Another confounding factor is the presence of two lesions adjacent to each other. These may appear as one lesion on the B-mode image. Close inspection of the elastogram can distinguish the two lesions [2–4]. In these cases care must be taken in performing measurements.
In addition to using the interpretation method previously discussed to determine if a lesion is more likely benign or malignant, asking if the lesion is soft or stiff or visible on SE is clinically helpful in some situations. It is sometimes difficult to determine if a lobular hypoechoic lesion is a fat lobule on conventional ultrasound. If the lesion is a fat lobule, it will appear very soft on the elastogram and similar to the other fat in the image (Fig. 21.2a). Lesions can be isoechoic to background tissue on B-mode imaging and not recognized as a lesion. These lesions may have different strain properties to the background and can be clearly visualized on SE. This is very common with complicated cysts (Fig. 21.7). Evaluation of the EI pattern can also define where to best biopsy a lesion (Fig. 21.8) selecting the hardest location to target the biopsy. The SE pattern can help characterize a complex lesion (Fig. 21.9).
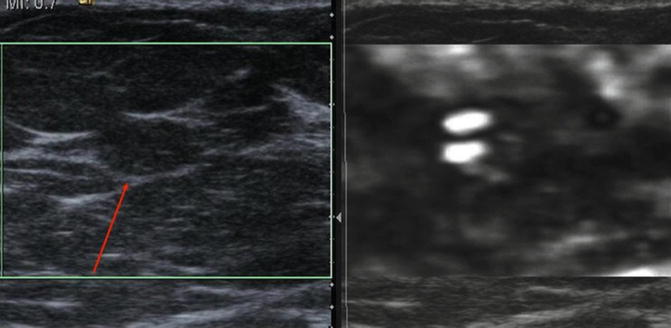
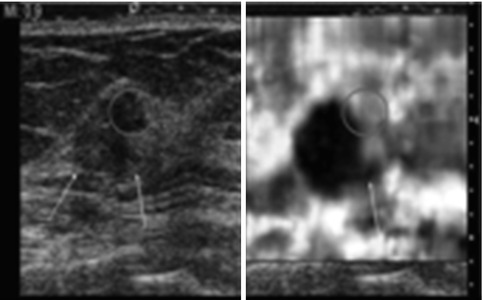
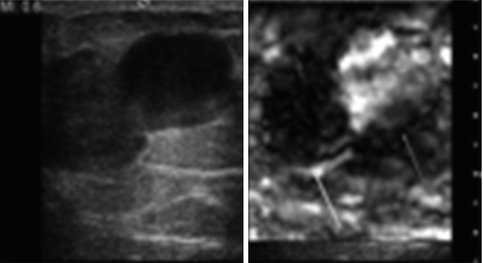
Fig. 21.7
Ultrasound images from a 39-year-old female with a palpable mass and a negative ultrasound examination and mammogram at a different institution. An elastogram taking at the site of the palpable abnormality confirms the presence of an isoechoic complicated cyst (red arrow). The lesion has the bull’s-eye appearance identified in simple and complicated cysts on certain vendor equipment
Fig. 21.8
Close evaluation of the elasticity pattern of a lesion can be helpful in characterization and biopsy planning. In this example of an invasive ductal cancer which has a EI/B-mode ratio of >.1 an area (red circle) is “soft” on SE. On pathology from surgical resection, the soft area was a benign fibroadenoma which is not distinguishable from the IDC (yellow arrow) diagnosed in a 53-year-old woman on the B-mode image. A spicule (green arrow) of tumor is better seen on SE
Fig. 21.9
Selected image from an 85-year-old woman presenting with a bloody nipple discharge. On the B-mode image there is a large complex lesion. On SE a hard component (yellow arrow) and a soft component (red arrow) are identified. On pathology the solid component was a papillary lesion and the soft area was old blood
21.2.2.2 5-point Color Scale
A 5-point color scale has been proposed to classify lesions using SE (Fig. 21.10) [24, 25]. This scale combines the ratio changes and degree of stiffness of the lesion. When a lesion is hard and has the same size on elastography as in the B-mode image, the lesion is given a score of 4. If the lesion is hard and larger on elastography, the lesion is classified as 5. It is recommended that lesions that are hard and equal in size to B-mode or larger on the elastogram than B-mode are biopsied. If the lesion is soft, it is classified as a score of 1. If the lesion has a mixed hard and soft pattern, it is classified as a 2. If the lesion is hard but smaller on elastogram, it is given a score of 3. Scores of 1–3 are classified as benign. This technique has been shown to have moderate to substantial interobserver agreement and substantial to perfect intra-observer agreement [26]. There was no significant difference in inter- and intra-observer agreements according to lesion size.
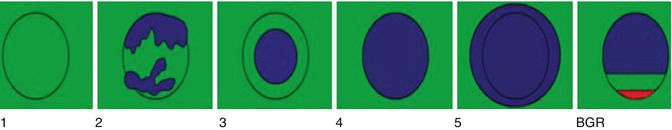
Fig. 21.10
Pictorial display of the Ueno scale for classification of breast lesions when using a color map where red is soft and blue is hard. For adequate color mapping images should be obtained containing fat, fibroglandular tissue, pectoralis muscle, and the lesion. In grade 1 the lesion is all soft. In grade 2 the lesion has mixed soft and hard components. The lesion is hard and smaller on ES in grade 3, equal in size on SE in grade 4, and larger on SE in grade 5
Using the color scale breast SE has been shown to objectively evaluate tumor or tissue stiffness in addition to morphology and vascularity [24]. Itoh found a sensitivity of 86.5 % and a specificity of 89.8 % using this technique with a cutoff point between 3 and 4. This technique has been shown to correlate well with the ultrasound BI-RADS score [27–29]. SE has also been shown to visualize non-mass lesions or peritumoral ductal lesions [24]. Multiple studies have found similar results [30–34]. This technique has also been used in the evaluation of suspicious microcalcifications on mammography with 97 % sensitivity and 62 % specificity in the differentiation of benign and malignant microcalcifications [30]. Several articles suggest SE may be most helpful in BI-RADS 3 and BI-RADS 4 lesions by upgrading or downgrading them [27, 28, 32].
21.2.2.3 Strain Ratio
In an attempt to semiquantify the measurements, the ratio of lesion stiffness to fat has been suggested. Initial studies [35, 36] have found this technique valuable in determining if a lesion was benign or malignant (Fig. 21.11). This ratio is based on the knowledge that the properties of fat are fairly constant, whereas the properties of other surrounding tissues and lesions are variable. Lesions with densities similar to fat therefore have smaller ratios. Care must be taken with these measurements as pre-compression can significantly change the strain value of fat [5]. As pre-compression is applied, the stiffness of all tissues increased. However, the stiffness of fat changes more than that of normal breast tissue and lesions. Therefore, with pre-compression the strain ratio of lesion to fat will decrease. Care must also be taken that the FOV for the fat measurement contains only fat. The measurements should be taken at the same depth in the image as the degree of tissue compression varies with depth.
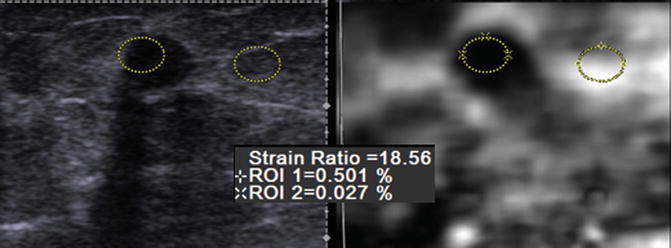
Fig. 21.11
Selected elastogram from a 59-year-old woman with a biopsy-proven invasive ductal cancer. An oval FOV is placed in the lesion and adjacent fat (yellow ovals). The strain ratio is calculated by determining the ratio of the strain from the lesion compared to that of fat. In this case the strain ratio is 18.6; that is, the lesion is 18.6 times stiffer than fat. This is highly suggestive of a malignant lesion. The EI/B-mode ratio in this case was 1.2 also suggestive of a malignancy
Thomas et al. [35] compared B-mode BI-RADS, the 5-point color scale, and the lesion-to-fat ratio in 227 breast lesions. Based on the ROC curve, they selected a cutoff of 2.455 to distinguish benign from malignant lesions. The mean ratio for malignant lesions was 5.1 ± 4.2 while for benign 1.6 ± 1.0 (p < 0.001). They found a sensitivity and specificity of 96 and 56 % for B-mode imaging, 81 and 89 % for the 5-point color scale, and 90 and 89 % for the lesion-to-fat ratio, respectively.
Zhi et al. [37] in a similar study compared the strain ratio and the 5-point color scale in 559 breast lesions. They found the strain ratio of benign lesions was 1.83 ± 1.22, while malignant lesions were 8.38 ± 7.65. These were significantly different (p < 0.00001). Based on their ROC curves, they selected a cutoff point of 3.05. The area under the curve for the 5-point color system was 0.885, while that of the strain ratio was 0.944 (p < 0.05). In a different study of 408 lesions [38], a lesion-to-fat strain ratio with a cutoff of 4.8 found a sensitivity of 76.6 % and a specificity of 76.8 %.
21.2.2.4 Artifacts
There are several artifacts that can be encountered with SE. Some occur when technique is suboptimal, while some contain diagnostic information. A characteristic elastogram, the bull’s-eye artifact, is seen with benign simple and complicated cysts with some systems. This artifact is characterized by a white central signal within a black outer signal and a bright spot posterior to the lesion [39]. This artifact is caused because the fluid is moving and there is de-correlation between images. This artifact has been described in detail [39] (Fig. 21.12). This artifact has a high predictive value for the lesion being a benign simple or complicated cyst. If there is a solid component in the cyst, it will appear as a solid lesion within the pattern (Fig. 21.13). Although limited cases have been reported, this artifact is not seen in mucinous or colloid cancers [39]. This artifact can be used to decrease the number of biopsies performed [39]. In one series 10 % of complicated cysts that appeared solid on B-mode are complicated cysts that can be identified with this technique [39]. If core biopsies are performed, notifying the pathologist that the lesion is a complicated cyst as opposed to a solid mass will lead to better pathology/imaging correlation. If the pathologist is told the lesion is solid, the report may not document that a cyst wall is present and suggest the suspected solid lesion is not in the specimen leading to an indeterminate report. This useful artifact is seen with Siemens (Mountain View, CA) and Philips (Bothell, WA) equipment and may not be seen in other manufacturers’ equipment.
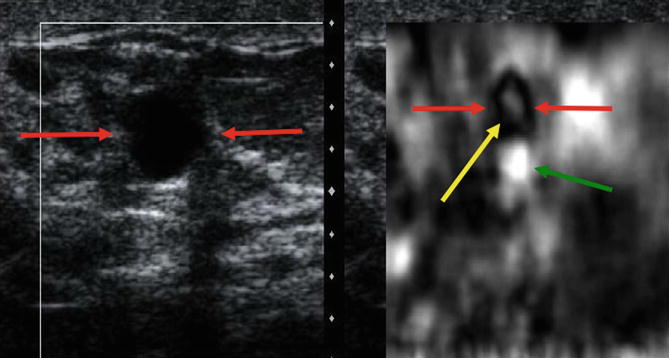
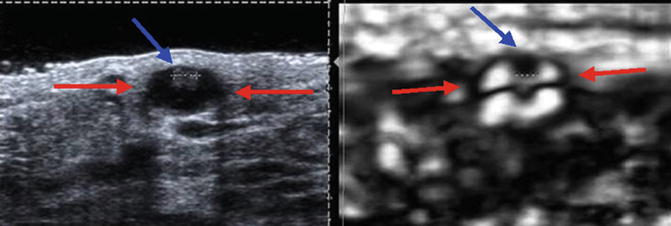
Fig. 21.12
Elastogram of a simple cyst in a 39-year-old woman who presents with a palpable mass. The image on the left in the dual-screen display is the B-mode image, whereas the image on the right is the elastogram. The elastogram shows the characteristic bull’s-eye artifact identified in benign simple and complex cysts in selected vendor SE. The artifact is characterized by three components, a black area (red arrow) with a central bright spot (yellow arrow) and posterior bright spot (green arrow)
Fig. 21.13
If a solid component is present within a cystic lesion (red arrow), the solid component can be identified as a hard area (blue arrow) within the bull’s-eye artifact. This elastogram is from a patient with a 2 mm benign papilloma with a cystic area (Courtesy of Carmel Smith, Brisbane, Australia)
The Hitachi system has a different artifact that occurs in cysts (Fig. 21.14). There is a 3-color layered pattern of blue, green, and red identified in cystic lesions [24]. A detailed study evaluating the sensitivity and specificity of this artifact has not been performed.
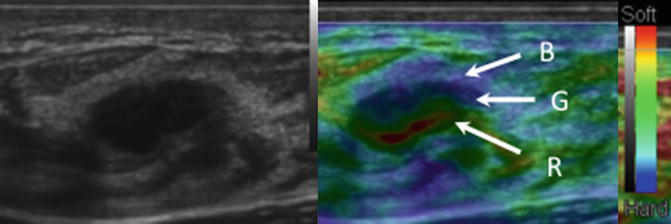
Fig. 21.14
A 3-layered artifact is identified with cysts on some vendor equipment. When using a color map where red is soft and blue is hard, the artifact has a BGR pattern characterized by a blue layer, green layer, and red layer as depicted in this image
A white ring or group of waves around a lesion on the elastogram indicates the lesion is moving in and out of the imaging plane while obtaining the elastogram [2–4]. This is called the sliding artifact. This artifact suggests the lesion is freely moveable within the adjacent tissues and is most likely benign. This has been proposed as a method to determine if there is an invasive component to a intraductal malignancy [40].
21.2.3 Shear Wave Elastography
With SWE a quantitative measure of the lesion stiffness can be obtained either in a small fixed ROI (single measurement) or pixel by pixel in an FOV using a color map. The results are color coded usually with red as hard and blue as soft. No studies with the use of 3D SWE have been published. It is unknown if the volumetric data using the 3D technique will provide additional information or allow for breast screening. The principles of scanning technique using SE also pertain to SWE. Pre-compression can change results and the same technique previously discussed above should be used to acquire images using SWE.
21.2.3.1 Quantitative Measurements
Based on a recent large multicenter study, a cutoff value of 80 kPa was determined to distinguish benign from malignant lesions [41]. Examples of a benign and malignant lesion are presented in Fig. 21.15. Tissue measurements in an ROI can be displayed in velocities (m/s) or in pressure/elasticity (kPa). The measurement of stiffness should be obtained from the area of highest stiffness within the lesion or the surrounding tissue. In this large multicenter trial, they demonstrated that when added to BI-RADS classification in B-mode imaging, SWE increases diagnostic accuracy [41]. They found that the evaluation of SWE signal homogeneity and lesion-to-fat ratios were the best differentiators of benign and malignant. The addition of SWE increased the characterization of lesion over BI-RADS alone, with a sensitivity and specificity of 93.1 and 59.4 % in BI-RADS and 92.1 and 76.4 % with the addition of SWE. The authors comment that the major value of the addition of SWE is in BI-RADS 3 and 4a lesions where the SWE results are used to upgrade or downgrade the lesion.
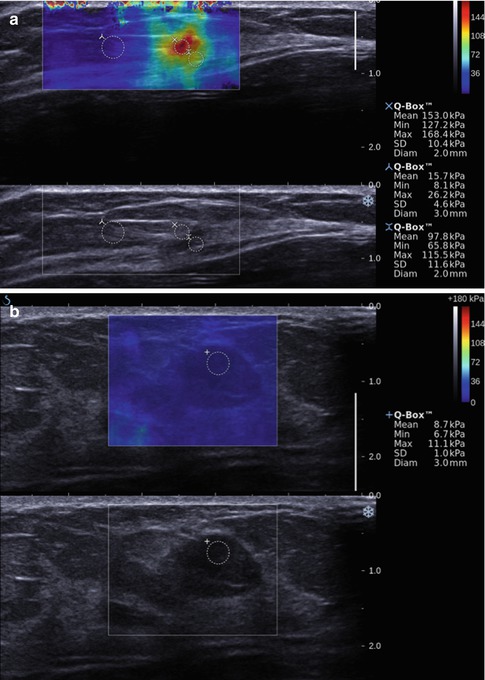
Fig. 21.15
Shear wave image (a) of an invasive ductal cancer in a 59-year-old woman demonstrating the elevated shear wave speed in the malignancy. The lesion has a maximum kPa value of 168. The normal background breast tissue has a maximum kPa value of 26. In a benign area of fibrocystic change (b) in a 45-year-old woman the maximum kPa value is 11. Different cutoff values between benign and malignant have been proposed ranging from 60 to 80 kPa
Chang et al. [42] in a study of 158 consecutive patients found the mean elasticity values were significantly higher in malignant masses (153 kPa ± 58) than benign masses (46 kPa ± 43) (p < 0.0001). They determined an optimal cutoff value of 80 kPa which resulted in a sensitivity and specificity of 88.8 and 84.9 %. The area under the ROC curve was 0.898 for conventional US, 0.932 for SWE, and 0.982 for the combined data. In a study of 48 breast lesions, Athanasiou et al. [43] found similar results with similar stiffness values for benign lesions (45 ± 41 kPa) and malignant lesions (147 kPa ± 40)(p < 0.001). There results suggest the addition of SWE to conventional ultrasound could be used to decrease the number of biopsies performed in benign lesions. In a small series Evans et al. [44] found the sensitivity and specificity for SWE (97 and 83 %) to be better than B-mode alone (87–78 %). In their series they used a cutoff value of 50 kPa. They also confirmed that the technique is highly reproducible.
When using Virtual Touch QuantificationTM (VTq) (Siemens Ultrasound, Mountain View, CA), where a single measurement is obtained from a small ROI, it is not possible to determine where the area of highest stiffness is located on the B-mode image. Multiple measurements within the lesion and surrounding tissue need to be obtained to acquire optimal measurements. The measurement within the tumor often results in “x.xx” signifying that an adequate shear wave for evaluation was not obtained [2–4]. Bai et al. [45] reported that if a lesion is solid and x.xx is obtained, the lesion is most likely a malignancy. With this assumption they obtained a sensitivity and specificity of 63.4 and 100 %.
Shear waves will not propagate through simple cysts and they too will not be color coded. The shear wave is detected by ultrasonic echo signal. Therefore, when areas in the B-mode image show extremely low signal, it indicates the echo signal is too low for successful detection. These areas are not color coded. This will occur with marked shadowing such as seen with ribs, tumors with significant shadowing, and areas with macrocalcification [2–4].
21.2.3.2 Quality Factor
In very hard lesions such as invasive cancers, the shear wave may not propagate in an orderly fashion. No results are therefore obtained and the area with no results is not color coded (Fig. 21.16). In these areas interpretation is not possible. However, in general the desmoplastic reaction of the tumor will be hard surrounding the tumor and appear as hard (red) halo surrounding the lesion. Even if the entire mass is not coded as hard, heterogeneity of the SWE is part of the criteria for a suspicious lesion. Care must be taken with pre-compression as this can also create the same appearance in a benign lesion [5].
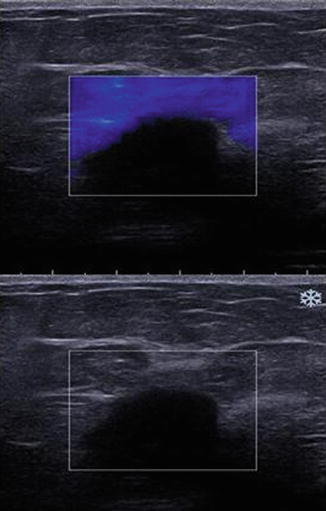
Fig. 21.16
In some cases the push pulse may not generate shear waves. This may be secondary to lesion depth, lesion with simple fluid or very hard lesion. Simple cysts with minimal debris do not support shear wave generation. In this image from a deep invasive ductal cancer, shear waves are not generated and the lesion is not color coded on the elastogram
In a large number of malignant lesions, the area identified on B-mode as the hypoechoic mass often does not code on SWE because a shear wave is not identified or may code with a low Vs. Bai found that 63 % of breast malignancies have this finding [45]. Preliminary work in the evaluation of this phenomenon suggests that shear waves may not propagate as expected in some malignant lesions [2–4] (Fig. 21.17). Evaluation of the shear waves in these malignant lesions demonstrates significant noise that may be incorrectly interpreted as a low shear wave speed by the algorithm. The addition of a quality measure that evaluates the shear waves generated and determines if they are adequate for an accurate Vs (or kPa) measurement will help in eliminating possible false-negative cases (Barr RG 2012, personal communication) (Fig. 21.18).
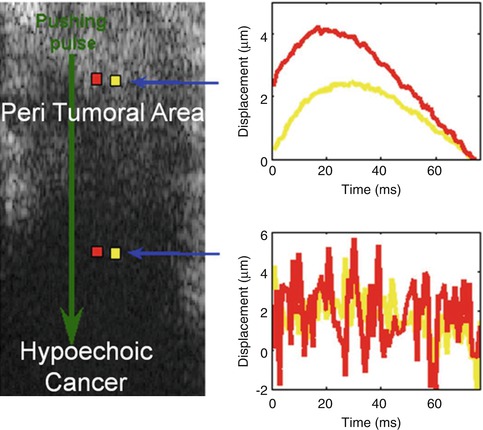
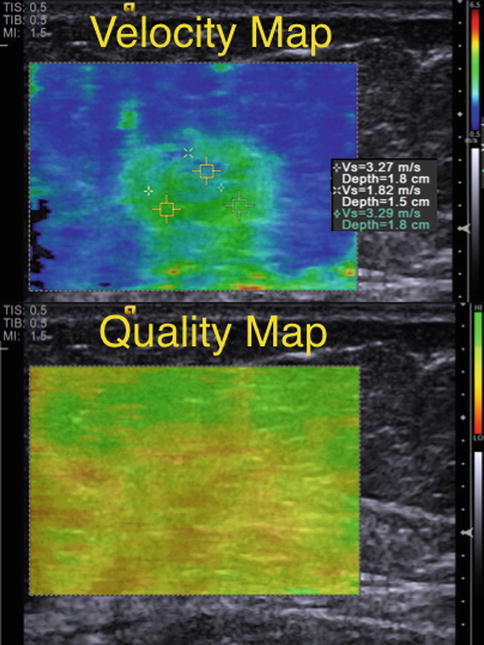
Fig. 21.17
Results from a 57-year-old woman with a palpable mass in her right breast. Mammographic and sonographic workup confirms a BI-RADS 4B lesion. The lesion is a biopsy-proven poorly differentiated invasive ductal cancer. The cancer is the hypoechoic mass in the deeper portion of the image. Two waveforms were obtained using the acoustic radiation force impulse technique. The one taken deeper is from the hypoechoic invasive ductal cancer. The more superficial one is taken in the peritumoral area. The waveform obtained from the cancer is all noise and not interpretable. The waveform in the adjacent peritumoral tissue has more noise than in the fat signals in Fig. 21.2, but the waveform is still able to be interpreted and provide a shear wave speed
Fig. 21.18
Shear wave elastogram from an invasive ductal cancer. A Velocity Map color codes the shear wave velocity on a pixel-by-pixel base. The Quality Map color codes the quality of the shear wave from that pixel. When the shear waves are not interpretable secondary to weak signal or a large amount of noise, the map codes that area as red or yellow. In this case the mass has a maximum shear wave speed of 3.2 m/s suggestive of a benign lesion. However, the Quality Map demonstrates that the shear waves are not appropriate for interpretation and the data should not be used in characterizing the mass
21.2.4 Summary
Elasticity imaging of the breast can be performed utilizing several techniques. These techniques all have a high sensitivity and specificity for characterizing breast lesions as benign or malignant. Although the techniques are easy to perform, attention to details are required to obtain optimal images for interpretation. Each of the techniques has advantages and disadvantages. Further comparative studies are needed to determine which technique or combination of techniques is most appropriate for various clinical problems. The bull’s-eye artifact seen with SE has been shown to be extremely helpful in characterization of cystic lesions [39]. These techniques are now maturing but continued work on standardizing elastography techniques is required.
21.3 Liver
21.3.1 Focal Liver Lesions
Related posts:
 New Therapies and Functional-Molecular Imaging
 Overview of Functional MR, CT, and US Imaging Techniques in Clinical Use
 MRI Hypoxia Measurements
 Spectroscopy of Cancer
 Current Clinical Imaging of Hypoxia with PET and Future Perspectives
 Medical Image Computing for Oncology: Review and Clinical Examples
Stay updated, free articles. Join our Telegram channel

Full access? Get Clinical Tree


