White Matter Diseases and Inherited Metabolic Disorders
Maria A. Rocca
Annette O. Nusbaum
Martina Absinta
Otto Rapalino
Kar-Ming Fung
Massimo Filippi
Despite more than three decades of evolution and maturation in neurologic magnetic resonance imaging (MRI), cerebral white matter (WM) disease still reigns as the most striking example of the indispensable nature of MRI in neurologic diagnosis. This can be traced to the widely recognized sensitivity of the technique for defining pathologic changes of the WM (Fig. 6.1) and demonstrating the extent of abnormality within intracerebral and extracerebral (i.e., optic nerves, spinal cord) WM.
With its high sensitivity, MRI is only rarely specific for a given etiology of WM abnormalities. Even after decades of high-quality MRI and extensive clinical research studies, neuroradiologists still grapple with limitations similar to those of neurologists and rheumatologists in distinguishing among a long list of entities, such as multiple sclerosis (MS), vasculitis, systemic lupus erythematosis, and other rheumatologic disorders. It cannot be overemphasized to referring clinicians and clinical radiologists that the causes of WM abnormalities on MRI are highly diverse, pathologic examination may be required to sort out MR-documented pathology, and, most important, clinical information is virtually always essential to correct interpretation and to the ultimate diagnosis. In this way, MRI is most often a tool to help formulate the specific diagnosis in disease states with WM abnormalities, rather than being the singularly sufficient examination that can in and of itself provide the diagnosis (a common scenario in other cerebral entities like neoplasms or infection). Moreover, although many advanced MR techniques, including magnetization transfer (MT), MR spectroscopy, and diffusion tensor imaging (DTI), have been finding their way into the research literature for many years, clinical MRI of individual patients still relies almost solely on conventional MRI techniques. While advanced techniques show great promise for improving the understanding of WM diseases, one must question why these methods have such little role in patient care after decades of research. One major explanation lies in the difference between group-based data in research studies and single-patient studies. Until single-subject differences between a given patient harboring diseased WM and a normal subject are defined, novel imaging techniques will have little impact on day-to-day diagnostic workup.
Even with the above caveats and limitations, it should be noted that MR technology is still on its inexorable progression toward the Holy Grail of in vivo histopathology. Regardless of the many complex and innovative pulse sequence developments capitalizing on subtle biophysical contrast mechanisms, ironically it appears that an unforeseen but now seemingly fundamental advance, ultrahigh-field imaging at 7 Tesla (T) and beyond, will permanently change the way we think of WM diseases, particularly but not exclusively MS. Numerous investigators have already noted that higher-field imaging, with its accompanying higher signal-to-noise ratio compared to standard 1.5 T, shows lesions within what would have formerly been declared “normal-appearing WM” (Figs. 6.2 and 6.3). There is no doubt that higher-field MRI promises to increase sensitivity and will ultimately require a reassessment of the notion of “MR-invisible disease burden” in a wide variety of pathologic conditions.
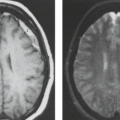
 FIGURE 6.1 Fluid-attenuated inversion recovery (FLAIR) to distinguish deep white and gray matter lesions from normal perivascular spaces. T2-weighted image (A) shows innumerable focal hyperintensities in deep gray and white matter, but FLAIR (B) allows distinction between parenchymal abnormalities. |
This chapter focuses on the normal MRI appearance of WM during development; disorders that primarily affect the WM,
including demyelinating diseases (primary and secondary), toxic effects on the WM, and other miscellaneous diseases. Dysmyelinating diseases that are primary disorders of myelin formation and maintenance are discussed along with other inherited metabolic disorders, some of which primarily affect gray and WM or strictly gray matter (GM). The pertinent clinical findings, MRI findings, and underlying pathophysiologic processes are discussed.
including demyelinating diseases (primary and secondary), toxic effects on the WM, and other miscellaneous diseases. Dysmyelinating diseases that are primary disorders of myelin formation and maintenance are discussed along with other inherited metabolic disorders, some of which primarily affect gray and WM or strictly gray matter (GM). The pertinent clinical findings, MRI findings, and underlying pathophysiologic processes are discussed.
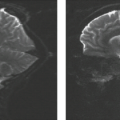
 FIGURE 6.2 Improved sensitivity of 3 T versus 1.5 T in supratentorial multiple sclerosis (MS). The 1.5-T T2 at two different levels (A,C) shows a few lesions, but 3 T at the same levels (B,D) clearly demonstrates multiple focal white matter lesions in this patient with MS. |
Classification of White Matter Diseases
“White matter disease” is a loosely defined term that includes practically any disease process that has pathologic changes limited to or predominantly within the WM. From the pathologic point of view, WM diseases can be classified into three major groups: primary demyelination, secondary demyelination, and dysmyelination.
 FIGURE 6.3 Improved sensitivity of 3 T versus 1.5 T for brainstem multiple sclerosis. Brainstem demyelinative lesions (white arrows) on both T2 (top) and fluid-attenuated inversion recovery (bottom) are only seen on 3-T images. (Courtesy of R. Mendonca.) |
Primary demyelinating diseases (Table 6.1) are characterized by loss of normally formed myelin with relative preservation of axons. Secondary demyelination (i.e., demyelination associated with a known etiology or a systemic disorder) and/or preferential destruction of WM (i.e., destruction of both axons and myelin) (Table 6.2) comprise a group of entities with very diverse etiologies, pathogenesis, clinical presentations, and distribution of lesions. In some cases, the separation between secondary demyelination and destruction of myelin and axons is not clear-cut, and the brain may be so extensively involved that the term leukoencephalopathy is justified. Leukomyelopathy refers to preferential spinal cord involvement. There is also evidence of axonal destruction in primary demyelinating processes, possibly responsible for the irreversible clinical deficits in many patients, making the distinction
between primary and secondary demyelination more difficult and arbitrary.
between primary and secondary demyelination more difficult and arbitrary.
TABLE 6.1 Primary Demyelinating Diseases | ||
|---|---|---|
|
Dysmyelination is a pathologic process of the WM characterized by defective formation and/or maintenance of myelin. Although many of these dysmyelinating disorders (also called leukodystrophies) have known genetic defects regarding abnormal metabolism of myelin, others are poorly understood (Table 6.3). MRI still cannot distinguish among lesions of myelin (i.e., dysmyelination from demyelination) or either of these from axonal disorders in which there is secondary breakdown of myelin. The diagnosis of leukodystrophies and other inherited metabolic disorders requires close correlation among MRI, clinical, and laboratory findings. From the diagnostic point of view, it is most appropriate to discuss leukodystrophies with other inherited metabolic diseases. WM abnormalities may also be the primary MRI finding in many disease processes considered elsewhere in this text.
TABLE 6.2 Disorders with Secondary Demyelination and Destruction of White Matter | |||||
|---|---|---|---|---|---|
|
TABLE 6.3 Leukodystrophies | ||||
|---|---|---|---|---|
|
 FIGURE 6.4 Schematic diagram depicting oligodendrocyte ensheathing adjacent axons. Two processes have been unfolded to demonstrate the vast surface area they occupy. (Adapted from Raine CS. Morphology of myelin and myelination. In: Morell P, ed. Myelin. 2nd ed. New York: Plenum Press, 1984:1–50, with permission.) |
Myelin and White Matter
The GM and WM of the central nervous system (CNS) differ not only in gross morphology but also in water content and macromolecular components, notably membrane lipids. Although the GM primarily contains neurons and their processes, the WM is composed predominantly of myelinated bundles of axons. Because myelination of the CNS is essentially a postnatal process, the neonatal brain contains considerably more water (89% for GM and 82% for WM) than the mature adult brain (82% for GM and 72% for WM). The oligodendroglial cell membrane is the source of the myelin sheath, which is a tightly wrapped, multilayered membrane composed of a repeating structure characterized by lipid-cytoplasm–lipid-water and which ensheathes axons (Fig. 6.4). Cholesterol, galactocerebroside, sphingomyelin, and phospholipids are the lipids found in fully formed WM and account for the stability and strength of the myelin membrane (1). Proteins are also embedded within the myelin, including proteolipid protein,
myelin basic protein (MBP), 20,30-cyclic-nucleotide 30-phosphodiesterase, myelin-associated glycoprotein, and myelin/oligodendrocyte glycoprotein, which may play a role in the pathogenesis of dysmyelinating and demyelinating disorders (1,2). Any process, including metabolic injury or ischemia, that changes the chemical composition of myelin will result in a less stable structure that is more susceptible to injury (3). Neuroglial cells, namely oligodendrocytes, astrocytes, and microglia, are primarily responsible for the maintenance or “well-being” of the WM by providing structural and nutritional support of neurons, regulating the extracellular environment, and acting as scavenger cells. Neuroglial cells are also important for guiding migrating neurons during development and are involved in repair of the nervous system.
myelin basic protein (MBP), 20,30-cyclic-nucleotide 30-phosphodiesterase, myelin-associated glycoprotein, and myelin/oligodendrocyte glycoprotein, which may play a role in the pathogenesis of dysmyelinating and demyelinating disorders (1,2). Any process, including metabolic injury or ischemia, that changes the chemical composition of myelin will result in a less stable structure that is more susceptible to injury (3). Neuroglial cells, namely oligodendrocytes, astrocytes, and microglia, are primarily responsible for the maintenance or “well-being” of the WM by providing structural and nutritional support of neurons, regulating the extracellular environment, and acting as scavenger cells. Neuroglial cells are also important for guiding migrating neurons during development and are involved in repair of the nervous system.
Although the exact mechanisms are not fully understood, it is known that the signal changes on T1-weighted MRI parallel increases in certain lipids that occur during the formation of myelin from oligodendrocytes (4,5). The signal changes on T2-weighted MRI have been presumed to be correlated with the period of maturation of the myelin sheath seen histologically as thickening and tightening of the spiral of myelin around the axon (3). MRI studies investigating the determinants of WM relaxation times have shown that this is an extremely complex process affected by many different factors, including structural and chemical changes in the axon, axonal ensheathment by myelin, and structural and chemical changes in the developing myelin (2,3,4,5,6). The temporal changes of the MRI signal are believed to be the end result of the combined effects of the interaction of extracellular water with hydrophilic lipids (galactocerebrosides, cholesterol) on the outer myelin layer (6), progressive dehydration of maturing WM, and the packing of long-chain fatty acids in the bilaminar membrane (2,7).
Myelination and MRI Findings
The most commonly used marker for evaluating normal brain maturation on conventional MRI is the progression of myelination (8,9). Myelination starts in the second trimester of gestation and continues into adulthood, beginning with the peripheral nervous system and then the spinal cord, the brainstem, and, finally, the supratentorial brain. Myelination of the brain evolves in a predictable sequential fashion over the first 2 postnatal years (5,8,9,10). Studies have suggested that the sequence of myelination has functional significance and is correlated with psychomotor development (11). The normal progression of myelination generally proceeds from caudal to rostral, posterior to anterior, and central to peripheral regions (5,10) (Table 6.4).
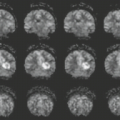
As WM becomes myelinated, it appears hyperintense on T1-weighted and hypointense on T2-weighted images relative to GM (1). Table 6.5 lists the specific anatomic landmarks of normal myelination seen on MRI at 1.5 T at birth. As illustrated in Tables 6.6 and 6.7, different rates of myelination are implied by T1- and T2-weighted images of the brain, which remain the standard sequences for evaluating myelination (12). During the first 6 months of life, T1-weighted images are most useful for evaluating the progression of myelination (Fig. 6.5). Inversion recovery images also provide improved T1-weighted contrast differences between tissues. In the first year of life, inversion recovery images using an inversion time of 700 to 800 ms with a repetition time (TR) of 2000 to 2500 ms and an echo time (TE) of 15 ms can be substituted for the T1-weighted images. Myelinated regions will appear hyperintense to GM on these inversion recovery images. After 6 months of age, most cerebral WM appears high in signal intensity on the T1-weighted images, and beyond this time the T2-weighted images are generally relied on to further evaluate myelin progression (Fig. 6.6). By 24 months of age, the process of myelination is essentially complete except for the terminal zones of myelination found in the occipital–parietal periventricular WM (Fig. 6.7). These regions appear as subtle, ill-defined areas of hyperintensity on the T2-weighted images and should not be confused with periventricular leukomalacia (Figs. 6.8 and 6.9); they may persist at least into the fourth decade.
TABLE 6.4 Progression of Myelination | ||||
|---|---|---|---|---|
|
TABLE 6.5 Myelinated Regions at Birth (or Shortly After Birth) | ||||||||
|---|---|---|---|---|---|---|---|---|
|
Diffusion Tensor MRI
The increase in diffusion anisotropy (i.e., the increase in the directional restriction of water proton movement due to structural barriers that limit free diffusion) that occurs between infancy and adulthood is thought to be related to the development of myelination. Anisotropy increases earlier in compact WM pathways, as in the corticospinal tract, and it continues to increase during adolescence in the subcortical and frontal WM (1,13).
TABLE 6.6 Myelination Milestones After Birth (Months) | ||||||||||
|---|---|---|---|---|---|---|---|---|---|---|
| ||||||||||
Proton (1H) MR Spectroscopy
The distribution of metabolites differs between children and adults, and metabolite levels are different in GM and WM (14). The N-acetylaspartate (NAA) peak is a marker of normal neuronal adult tissue, and the increase in NAA early in development reflects the normal neuronal maturation (Fig. 6.10). The choline peak provides an indirect method for observing changes in lipid metabolism and membrane formation. It is prominent early in brain development most likely due to the high levels of substrate needed for the formation of cell membranes and myelin (15). 1H MR spectroscopy may be useful for documentation of normal fetal brain maturation, with progressive reduction of myo-inositol and choline levels simultaneous with a progressive increase of NAA and creatine content with progressing fetal development (1,16,17). 1H MR spectroscopy can
detect NAA as early as 22 weeks of gestational age (16). From 22 to 30 weeks, the predominant metabolites in the MR spectrum are choline and myo-inositol (a glial cell marker) (14,16). Brain 1H MR spectroscopy of preterm and term newborns has also shown a progressive increase of NAA parallel to gestational age (18).
detect NAA as early as 22 weeks of gestational age (16). From 22 to 30 weeks, the predominant metabolites in the MR spectrum are choline and myo-inositol (a glial cell marker) (14,16). Brain 1H MR spectroscopy of preterm and term newborns has also shown a progressive increase of NAA parallel to gestational age (18).
TABLE 6.7 Chronology of Other Specific White Matter Intensity Changes | ||||||||||||||||||||||||||||||||||||||||||
|---|---|---|---|---|---|---|---|---|---|---|---|---|---|---|---|---|---|---|---|---|---|---|---|---|---|---|---|---|---|---|---|---|---|---|---|---|---|---|---|---|---|---|
| ||||||||||||||||||||||||||||||||||||||||||
Demyelinating Diseases
Demyelinating diseases have traditionally been classified based on clinical and pathologic features. The pathologic hallmark of demyelinating disease is the destruction of normally formed myelin with relative preservation of axons. However, postmortem data in patients with MS, considered the archetype of demyelinating disorders, are challenging this long-established premise. Studies by Trapp et al. (19) suggest that even early in the course of the disease, axonal destruction and degeneration of axons accompany demyelination. Although the cause of demyelination in most demyelinating disorders is unknown (primary demyelinating disorders), the known pathogenic agents include direct viral infection, postinfectious or postvaccination immune responses, toxic/chemical agents, and nutritional and vitamin deficiencies (Tables 6.1 and 6.2). Focal lesions are usually disseminated throughout the CNS and, not uncommonly, demyelination can present as a masslike lesion suggestive of neoplasia. The clinical presentation and age at onset are highly variable, and the strategic locations of the lesions dictate the corresponding neurologic deficits. Numerous studies in the literature have documented that the extent or severity of disease on imaging is not necessarily correlated with clinical disability.
 FIGURE 6.5 Magnetic resonance imaging of a 2-day-old infant brain. A: T1-weighted images (spin echo, 600/20) demonstrate regions of high signal intensity corresponding to known myelination present around birth: dorsal brainstem, the optic apparatus, the posterior limbs of the internal capsules, the ventral lateral nucleus of the thalamus, the central corona radiata, and the perirolandic region. B: T2-weighted images (fast spin echo, 3,600/84 Ef) reveal low signal intensity in these same regions. Also, note the signal intensity of the remainder of the white matter on the T1- and T2-weighted images due to the normal higher water content of the infant brain. The cortex should demonstrate low signal intensity on the T2-weighted images and stands out at this age relative to the normal high signal intensity of the white matter. |
 FIGURE 6.6 MRI of a 6-month-old infant brain. A: T1-weighted images (spin echo, 600/20) shows that most of the white matter is high in signal intensity, except for the subcortical U fibers. These findings reflect further progression of myelination. B: T2-weighted images (fast spin echo, 3,600/84 Ef) reveal low signal intensity within the splenium of the corpus callosum and more of the centrum semiovale. Note the discrepancy in signal intensity between the T1- and T2-weighted images in some but not all regions that are myelinated. The T2-weighted images become the preferred sequence with which to further follow the normal progression of myelination beyond this age. |
 FIGURE 6.7 Magnetic resonance imaging of the brain of a 24-month-old. (A) T1-weighted images (spin echo, 600/20) and (B) T2-weighted images (fast spin echo, 3,600/84 Ef) show that essentially all the white matter (including the subcortical U fibers) appears myelinated. Ill-defined areas of high signal intensity demonstrated on the T2-weighted images dorsal and superior to the trigones of the lateral ventricles are normally seen. |
 FIGURE 6.8 Axial (A) and coronal (B) T2-weighted images show persistent increased intensity superior and posterior to the trigones of the lateral ventricles (arrows). These areas are believed to represent regions of slow myelination within the brain. The layer of myelinated white matter (open arrows) between the ventricular wall and the patchy area of high signal intensity and the normal distance between the border of the ventricle and the cortical gyri are important in differentiating this normal finding from periventricular leukomalacia. |
 FIGURE 6.9 Periventricular leukomalacia (PVL) in a 3-year-old with developmental delay. Irregular scalloping of the posterior margins of the lateral ventricles with adjacent cavitated white matter lesions is typical of PVL. |
 FIGURE 6.10 Typical proton magnetic resonance spectra from the periventricular parietal region in subjects of different ages: 4 days (40.5 weeks gestational age), 5 months, 4 years, and adult (31-year-old woman). Ch, choline; Cr, creatine; Glx, glutamine and glutamate; NA at 2 ppm, N-acetylaspartate; mI, myo-inositol. The relative amplitudes of the peaks vary greatly with age. The Ch and mI peaks are dominant in the newborn. At approximately 5 months of age the NA peak becomes dominant and is the dominant peak in adulthood. Stimulated echo acquisition mode (STEAM) spectra were obtained: 30 ms echo time, 1.5 s repetition time; 144–256 averages; voxel sizes 8–10 cm3 for children, 12–16 cm3 for adults. (From Kreis R, Ernst T, Ross BD. Development of the human brain: in vivo quantification of metabolite and water content with proton magnetic resonance spectroscopy. Magn Reson Med 1993;30:424–437, with permission.) |
Primary Demyelinating Disorders
Multiple Sclerosis
Clinical Features
MS is the most common and most extensively studied of demyelinating diseases, yet its etiology remains unknown. It is likely that exogenous factors, acting on a substrate of an inherited susceptibility, are responsible. Hypotheses concerning the identity of the agents responsible for the disease cover a wide spectrum of possibilities and include those based on infection, autoimmune mechanisms directed against myelin proteins, a combination of infection and autoimmune reaction, and toxic-metabolic causes. A significant body of information suggests a viral etiology in genetically susceptible individuals (20,21,22). However, there has been no confirmed isolation of a conclusive and unequivocal infective agent at autopsy or biopsy of MS plaques. Although straightforward Mendelian inheritance has been excluded, a complex genetic component is suggested by familial clustering and increased risk in twins, and environmental factors are suggested by the increased prevalence of MS in certain geographic locations and ethnic populations (particularly in northern Europe) (23,24,25). There is also evidence of linkage of MS to the region of the major histocompatibility complex on chromosome 6p21 (24,26). It is also worth noting that theories implicating insufficiencies of head and neck veins impeding cerebral venous drainage as the cause of MS have been demonstrated as false by well-constructed scientific studies (27).
MS is characterized by a variety of clinical courses and disease patterns (28,29). Most MS cases are categorized into the classic form or Charcot type (Table 6.1, and see later discussion under Variants). The clinical onset is generally between the second and fourth decades, in 5% of patients before age 18 years (pediatric MS) and 10% after age 50 years. The incidence of MS is two to three times higher in females than in males. According to the most recent classification (30), two major phenotypes can describe the clinical course of MS patients: a relapsing–remitting (RR) disease and a progressive one. The RR disease includes patients at their first clinical event (clinically isolated syndrome or CIS) that is often monosymptomatic (optic neuritis, transverse myelitis, or brainstem syndrome) as well as patients who experience exacerbations (attacks) and remissions of neurologic deficits separated by stable periods. Based on clinical (relapses) or MRI activity (new T2 or gadolinium-enhancing lesion), both CIS and patients experiencing relapses can be active or not in a specific time frame. The progressive disease include patients characterized by the progressive accumulation of disability since their clinical onset (previously called primary progressive [PP]) or after an initial RR course of disease (previously termed secondary progressive [SP]). Additional clinical subtypes can be recognized in this group according to the presence of clinical or MRI activity and yearly clinical progression. Late in the disease, severe neurologic disabilities include paralysis, loss of sphincter control, blindness, and cognitive impairment/dementia.
Diagnosis
MRI has fundamentally changed the clinical evaluation of patients with MS (Fig. 6.11). The sensitivity of MRI to MS lesions far exceeds that of the clinical examination and any other imaging modality (e.g., computed tomography [CT]) (31,32). This is supported by pathology studies showing evidence of MS lesions unexpectedly discovered in postmortem brains and spinal cords. It is well known that MRI is not specific for the diagnosis of MS because WM lesions that mimic those of MS may be detected in both normal volunteers and patients harboring other pathologic conditions (33). For these reasons, imaging cannot be the sole criterion for the diagnosis of MS but must be included with clinical and laboratory findings. MRI has been formally included in the diagnostic algorithm of MS in 2001, by an International Panel of Experts (34). The original criteria have been revised several times in the course of the past decade in an attempt to simplify them and to implement their use in the clinical setting. The most recent revision of these criteria (2010 revision) (35) simplified the criteria for spatial and temporal dissemination of the lesions (Tables 6.8 and 6.9), addressed the question of the differential diagnosis with neuromyelitis optica (NMO) and extended the MRI criteria to the pediatric MS population (35).
The overall conversion of patients with CIS is variable, depending on the presence of clinically silent WM lesions, and ranges from 10% (without coexistent silent lesions) to 45% (with asymptomatic lesions). The general accuracy of MRI for prediction of this clinical conversion is about 68% (36). Asymptomatic individuals with incidental MRI detection of lesions highly suggestive of MS have been defined as having “radiologically isolated syndromes” and, to date, only limited data exist on the natural history or evolution of such individuals (37,38).
Visual-, auditory-, and somatosensory-evoked responses may be used to help establish the multifocality of disease (39). The greatest limitation of evoked responses is the narrow scope of the studies, which measure only a fraction of the potentially affected pathways. Spinal fluid analysis, with attention to oligoclonal bands and immunoglobulin G (IgG), is also an important contributor in establishing the diagnosis of MS (40).
 FIGURE 6.11 Typical magnetic resonance findings in multiple sclerosis. A: Multiple hyperintense lesions are seen in the centrum semiovale and subcortical white matter on the axial fluid-attenuated inversion recovery image (10,000/120 Ef/inversion time = 2,200). B: Axial T1-weighted image demonstrates nonenhancing and ring-enhancing lesions. |
Pathologic Findings
Even if MS is generally considered a WM disease, demyelination affects extensively the WM and GM, including deep GM nuclei (41). The characteristic pattern of lesion distribution is widely recognized; however, considerable variation is noted from patient to patient (42). For unknown reasons, there is a propensity for involvement of certain regions of WM, most notably the periventricular WM (Fig. 6.12), optic nerves, brainstem, and spinal cord (Figs. 6.13 and 6.14).
TABLE 6.8 2010 Revised Magnetic Resonance Imaging Criteria for the Diagnosis of Multiple Sclerosis | ||||||||
|---|---|---|---|---|---|---|---|---|
| ||||||||
TABLE 6.9 2010 Revised McDonald Criteria for the Diagnosis of Multiple Sclerosis | ||||||||||||||
|---|---|---|---|---|---|---|---|---|---|---|---|---|---|---|
| ||||||||||||||
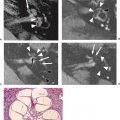
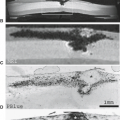
 FIGURE 6.12 Chronic multiple sclerosis. A: In this severely affected brain there is extensive demyelination in the white matter. The classic periventricular involvement is well demonstrated in this case. B: Demyelinating plaques can occur anywhere in the central nervous system. In some strategic locations, such as the medullary pyramid (arrowhead), a small demyelinating plaque can cause catastrophic clinical consequences. Luxol fast blue–cresyl violet preparation. (Courtesy of Dr. Lucy B. Rorke, Philadelphia, PA.) |
 FIGURE 6.13 Chronic multiple sclerosis. A: Multiple sclerosis plaque in the corticospinal tract (arrows) in medulla oblongata. Note a small plaque in the contralateral tract. Luxol fast blue–hematoxylin and eosin, ×40. B: Plaque of demyelination in the hemispheric white matter of the frontal lobe in a patient with the classic (Charcot) type of multiple sclerosis. C: Multiple sclerosis plaque in the angle of the lateral ventricle, just above the body of the caudate nucleus. Note also the severe demyelination of the dorsal portion of the optic chiasm and optic tracts. D: Upper pons with periventricular, tegmental, and base multiple sclerosis plaques. Myelin stain, ×45. |
 FIGURE 6.14 Classic focal white matter lesions in definite multiple sclerosis; magnetic resonance imaging and pathology. T1 (A1,A2) and T2 (B1,B2) images show classic and extensive focal lesions in the white matter and with a predilection for the periventricular regions. Many lesions are markedly hypointense on T1, indicating more tissue destruction, and therefore would be categorized as “black holes,” whereas others are nearly isointense to normal brain on T1. Note the corresponding destruction of periventricular white matter on the gross specimen (C). |
Macroscopically, MS lesions or plaques have a typical ovoid/ellipsoidal shape with a sharp border. They can sometimes be irregular in morphology and often become confluent. Most of them range from a few millimeters to a few centimeters in greatest dimension. Although active MS lesions appear pink and wet, they become more opaque and chalky in the subacute stage and, finally, gray translucent lesions are seen in the “burnt-out” gliotic stage. Cortical plaques are difficult to see on gross examination unless they extend into the subcortical WM. In the spinal cord, the plaques are often oval in shape and are oriented lengthwise. Other common macroscopic changes include volume loss and atrophy of the optic nerve and optic chiasm, cerebral WM, brainstem, and spinal cord (Fig. 6.15).
 FIGURE 6.15 Spinal cord multiple sclerosis. A: Spinal cord in a patient with chronic multiple sclerosis (right) and in a normal age-matched control patient (left). B: Marked shrinkage of the cord in its anteroposterior diameter and almost complete loss of myelin sheaths. Note the preservation of the myelin sheaths in the dorsal roots (stained dark blue). Luxol fast blue–hematoxylin and eosin, ×20. C: Partial preservation of axons in lateral and anterior columns. Silver impregnation for nerve fibers, ×20. (D) Marked fibrillary gliosis. Holzer’s stain for glial fibrils, ×20. |
MS lesions are characteristically perivenous, with the vein centrally traversing the long axis of the plaque (Fig. 6.16). The staging classification is largely based on the evidence of ongoing processes of demyelination and cellular composition (43). Early lesions, or “active” plaques, are characterized by opening of the blood–brain barrier (edema), oligodendrocytes death, fragmentation of myelin, but relative preservation of axons
(often swollen) (Figs. 6.17 and 6.18). Early lesions are typically hypercellular containing perivascular clusters of lymphocytes (predominantly T cells) macrophages, distributed throughout the lesion, and activated microglia (24) (Fig. 6.19). In the chronic stage, the lesion is transformed into a gliotic or “inactive” plaque, with demyelination stopping abruptly at the margin. Lymphocytes and macrophages are not seen. Although axons are usually well preserved, there is a variable reduction in axons, and they are more loosely packed than the adjacent normal areas. In a variable percentage of chronic lesions, macrophages/microglia with early myelin degradation product may persist at the margin of the lesion. These lesions have been classified as “chronic active” (43).
(often swollen) (Figs. 6.17 and 6.18). Early lesions are typically hypercellular containing perivascular clusters of lymphocytes (predominantly T cells) macrophages, distributed throughout the lesion, and activated microglia (24) (Fig. 6.19). In the chronic stage, the lesion is transformed into a gliotic or “inactive” plaque, with demyelination stopping abruptly at the margin. Lymphocytes and macrophages are not seen. Although axons are usually well preserved, there is a variable reduction in axons, and they are more loosely packed than the adjacent normal areas. In a variable percentage of chronic lesions, macrophages/microglia with early myelin degradation product may persist at the margin of the lesion. These lesions have been classified as “chronic active” (43).
 FIGURE 6.16 Chronic multiple sclerosis. A: Histologically, chronic plaques (arrow) often appear as well-demarcated oval areas with blood vessels at the center. Luxol fast blue–hematoxylin-eosin stain. B: In the same area on an adjacent section, no significant loss of axons is seen (arrow). Higher magnification (inset) shows well-preserved axons in the demyelinated areas. Bodian stain. |
Cortical lesions are quite common in MS. Contrary to past concepts about MS, pathology studies have confirmed that cortical demyelination is already present at the early stages of the disease (44). These lesions have been classified according to the demyelination cortical layers’ involvement (45) (Fig. 6.20). Leukocortical lesions (type I), involving both GM and WM, and small intracortical lesions (type II) are usually centered on a central vein similarly to WM lesions. Subpial cortical demyelination (types III and IV) is characteristic of MS and, likely related to meningeal inflammation (diffusible cytokines, immunoglobulins, toxic metabolites) (Fig. 6.20). Recently, ectopic B-cell follicle-like structures have been detected in the infoldings of the cerebral sulci and associated to focal cortical demyelination (46,47,48,49,50). Scattered inflammatory cells (lymphocytes and monocytes) can be also seen in the meninges protecting the brain surface.
 FIGURE 6.17 Subacute multiple sclerosis. Partial preservation of axons in an old plaque of demyelination. Silver impregnation for nerve fibers, ×100. |
Remyelination has been clearly documented to occur, although often incompletely, in MS lesions, including cortical lesions (51). In chronic shadow plaques, remyelination occurs throughout the entire lesion. Several factors have been pointed out for remyelination failure in MS such as impaired oligodendrocytes precursors differentiation/maturation, inapt
axonal–glial interaction, energy failure, and hostile environment (52). Aside from these focal histologic findings, it is also known that diffuse abnormalities can be found in the brain and spinal cord, including diffuse axonal loss, diffuse astrogliosis, microglia activation, perivascular inflammation, lipofuscin deposition, collagenized veins, and small foci of demyelination (53,54). Finally, neurodegeneration (neuronal and axonal injury/loss) is also a prominent feature in MS and more strictly linked to clinical progression (42). However, the relationship among inflammation, demyelination, and neurodegeneration is still controversial (primary vs. secondary process) (42).
axonal–glial interaction, energy failure, and hostile environment (52). Aside from these focal histologic findings, it is also known that diffuse abnormalities can be found in the brain and spinal cord, including diffuse axonal loss, diffuse astrogliosis, microglia activation, perivascular inflammation, lipofuscin deposition, collagenized veins, and small foci of demyelination (53,54). Finally, neurodegeneration (neuronal and axonal injury/loss) is also a prominent feature in MS and more strictly linked to clinical progression (42). However, the relationship among inflammation, demyelination, and neurodegeneration is still controversial (primary vs. secondary process) (42).
 FIGURE 6.18 Myelin staining. Demyelinating lesions with atypical features may prompt a biopsy to rule out a neoplastic lesion. A: Hematoxylin–eosin stain discloses clusters of chronic inflammatory cells admixed with macrophages in the white matter (arrow). B: Demyelination in these same areas can only be visualized with special stain for myelin (arrow). Luxol fast blue–cresyl violet stain. The demyelinated areas are infiltrated by macrophages and lymphocytes (inset). C: Although axons are relatively well preserved, as illustrated here with a Bodian stain, swollen axons are common (arrow). |
 FIGURE 6.19 Acute multiple sclerosis. A: Focus of demyelination with marked expansion of perivascular spaces by foamy macrophages, lymphocytes, and plasma cells. Hematoxylin and eosin, ×100. B: Multiple sclerosis plaque in subcortical white matter with intense infiltration with microglial cells and sparing of neurons. Luxol fast blue–hematoxylin-eosin, ×100. |
 FIGURE 6.20 Graphical representation of the four types of the MS cortical lesion as recognized in pathology. The close association with a central vein is shown for lesion Types I and II. Types III and IV are often involving one or multiple gyri and they have been related to meningeal inflammation. In Type IV, the demyelinating process may also extend into the white matter (not shown). Even if Type III is the most frequent discerned on pathological assessment, the in vivo MRI detection is almost limited to Types I and IV, also at higher magnetic field (7-T MRI). |
MRI Findings
MS lesions appear similar to many other WM diseases on MRI, typically presenting as scattered foci of varying size demonstrating high signal intensity on T2-weighted images, on proton density–weighted (long TR/short TE) images, and on fluid-attenuated inversion recovery (FLAIR) images, as well as variable degree of low signal intensity on T1-weighted images (Fig. 6.14). Except for cortical lesions, conventional MR is extremely sensitive in detecting MS lesions, but is nonspecific in determining the age of lesions (43) and distinguishing the underlying histopathologic substrates (55).
 FIGURE 6.21 Pontine lesion in a patient with right paresthesias and multiple sclerosis. A: T2-weighted magnetic resonance (MR) image. B: T1-weighted MR image after gadolinium. Focal lesion in right pons (A) enhances (B) and is situated in the pathway of fibers of cranial nerve V in a patient with V1 distribution sensory disturbance. |
MS lesions are frequently situated in the periventricular WM, internal capsule, corpus callosum, pons, and brachium pontis (56) (Fig. 6.21), but may be found throughout the myelinated WM as well as within GM. MS plaques have a propensity to occur in the periventricular region and commonly appear as linear or ovoid lesions oriented perpendicular
to the lateral ventricle (Dawson fingers). The corpus callosum is a region that is especially vulnerable to demyelination in MS, possibly due to its intimate neuroanatomic relationship to the lateral ventricular roofs and to small penetrating vessels. This pattern overlaps greatly with a variety of other demyelinating diseases; so it is of limited value in clinical MRI interpretation.
to the lateral ventricle (Dawson fingers). The corpus callosum is a region that is especially vulnerable to demyelination in MS, possibly due to its intimate neuroanatomic relationship to the lateral ventricular roofs and to small penetrating vessels. This pattern overlaps greatly with a variety of other demyelinating diseases; so it is of limited value in clinical MRI interpretation.
As described in early neuropathology (41), WM and GM MS lesions, excluding subpial demyelination, typically arise from a central vein. Taking advantage of the local susceptibility effect of the deoxyhemoglobin, optimized T2*-weighted and phase imaging at higher magnetic field (3 and 7 T), recently, improved the central vein detection within the demyelinated MS lesions (57,58,59,60,61,62,63). This has raised the question whether this imaging finding could be implemented to clinically differentiate MS vs. non-MS lesions and, therefore, to improve the specificity of the current dissemination in space MRI diagnostic criteria.
At their onset, MS lesions enhance after the administration of intravenous contrast (64), reflecting transient abnormality of the central vein’s blood–brain barrier (outward contrast leakage or centrifugal pattern on dynamic contrast enhancement [DCE] (65 images). In a subset of older lesions, the lesion expansion is associated to the secondary opening of the blood–brain barrier in capillaries at the lesion margin and a centripetal pattern of contrast enhancement is seen on DCE (inward contrast leakage from a peripheral enhancing ring). Thus, the enhancement patterns are extremely variable and may appear nodular or ringlike, depending on the timing of MRI acquisition (65,66,67). Treatment with steroids is associated with a marked reduction in lesion enhancement (Fig. 6.22).
It should also be noted that recent research (68) in a mouse model of MS shows very early enhancement, that is, in a preclinical stage days before any overt blood–brain barrier defect by enhancement by conventional gadolinium agents, of lesions with inflammatory monocytes and neutrophils, cells that secrete myeloperoxidase (MPO). MPO expression is associated with early-onset MS in patients. This study shows promise in providing a sensitive and early probe for MS that could help greatly in developing new therapies.
Masslike lesions (tumefactive MS) that may mimic a tumor on imaging can be sometimes seen (Fig. 6.23). As the enhancement resolves, MS lesions typically decrease in size over time and leave a smaller residual plaque. Increasing hypointensity of MS plaques on T1-weighted images has been correlated with increased demyelination and axonal loss on pathology (69). These lesions may approach the signal intensity of cerebrospinal fluid (CSF), referred to as “black holes,” and have been shown to be correlated more closely with clinical disability and outcome (70).
Though cortical lesions have been recognized to be extremely relevant on clinical disability and prognosis, they were overlooked for a long time in radiology because they were difficult to visualize in vivo (71). Different MRI techniques including double inversion recovery (DIR) (Fig. 6.24) (72), phase-sensitive inversion recovery (PSIR) (73), and T2*-weighting, particularly at 7 T (74,75), have facilitated their in vivo detection, though subpial lesions (the most frequent subtype of cortical demyelination) still remain elusive in vivo. Beside the cortex, lesions have also been observed frequently in the deep GM nuclei and in the hippocampi (76). Cortical lesions have been demonstrated in a relatively high percentage (36%) of patients with CIS suggestive of MS (77) and their inclusion in the diagnostic workup of these patients has led to the proposal of a modified model for DIS, with a high specificity and sensitivity, which includes the presence of at least one cortical lesion, in addition to the presence of at least one infratentorial and one spinal cord or Gd-enhancing lesion (78). For instance, cortical lesions have not been identified in migraine patients with multiple brain WM hyperintensities (79) and NMO (80).
 FIGURE 6.22 Change in multiple sclerosis lesion appearance after steroid therapy. A: T2-weighted magnetic resonance image. B: T1-weighted magnetic resonance image after gadolinium. C: T1-weighted magnetic resonance image after steroid treatment. D: Biopsy specimen, stained for lymphocytes. Note the large lesion in the left centrum semiovale during acute presentation (A), which enhances markedly (B). After steroids (C), dramatic reduction in enhancement is seen. Biopsy before steroids showed classic perivascular lymphocytes (D). |
 FIGURE 6.23 Tumefactive multiple sclerosis. A: T2 fluid-attenuated inversion recovery shows a masslike lesion in the left parietal white matter extending into the corpus callosum and thalamus with mild compression of the atrium of the lateral ventricle. B: A small region of patchy enhancement is seen. |
 FIGURE 6.24 Cospicuous hyperintense cortical lesions (orange circles) on double inversion recovery (DIR) in a secondary progressive MS patient. Some of these lesions are visible also on conventional MRI sequences, including proton density (PD)-weighted, T2-weighted, and T1-weighted 3D MP-RAGE images. |
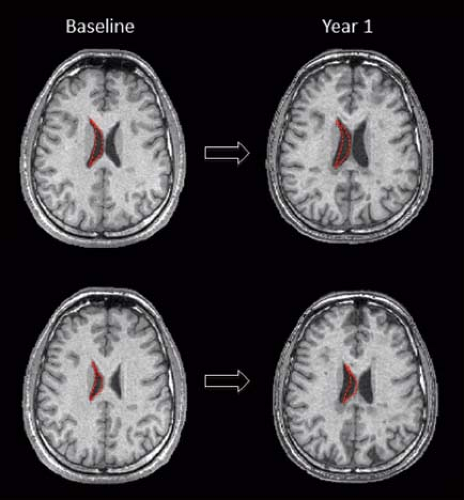 FIGURE 6.25 One-year evaluation of brain atrophy on T1-weighted scans in a relapsing–remitting MS patient. Enlargement of the ventricles and cortical spaces as well as accrual of focal hypointense lesions are visible. To facilitate the visualization of the ventricle enlargement, red dotted-line masks were drawn on the right lateral ventricle in the baseline scan and then copied on the 1-year follow-up scan. |
Atrophy is common with progression of disease (estimated rate of tissue loss 0.5% per year [81]), usually manifested by ventricular enlargement, thinning of the corpus callosum and prominence of cerebral sulci on conventional images (Fig. 6.25). Cross-sectional and longitudinal measures of regional and global atrophies have been implemented in the last 20 years to better understand the correlation between neurodegeneration and clinical disability (both motor and cognitive impairment) (82). Recent studies pointed out that thalamic damage/atrophy is an early phenomenon in MS and correlated to long-term disability (83). Hypointensity on T2-weighted and, more recently, on susceptibility-weighted MRI is concomitantly found in the dentate nucleus, in the deep GM nuclei including the thalamus, and in the cortex suggestive of iron deposition and linked as well to clinical progression (84,85) (Fig. 6.26).
 FIGURE 6.26 Patient with longstanding multiple sclerosis has extensive white matter disease, involving infratentorial and periventricular white matter on T2-weighted images. Red arrows indicate the concomitant abnormal hypointensity throughout deep gray matter nuclei and dentate nuclei. |
Quantitative Techniques in Imaging Multiple Sclerosis
Numerous studies have shown that quantitative analysis of relaxation times, MT ratios, diffusion measurements, and 1H MR spectroscopy in “normal-appearing WM” in MS patients differs from those of normal volunteers (82). These findings may be a reflection of the subtle histologic changes reported by pathology studies (or microscopic disease) (53,54) and lend support to the concept that MS is actually a diffuse
process. These quantitative techniques may potentially provide insight into the microstructural differences in focal lesions, demonstrate microscopic disease or disease that is invisible by conventional MR techniques, and prove useful in documenting irreversible disease. At this point, however, there is still no clinical role for these techniques in individual patients suspected of harboring MS or already diagnosed with MS.
process. These quantitative techniques may potentially provide insight into the microstructural differences in focal lesions, demonstrate microscopic disease or disease that is invisible by conventional MR techniques, and prove useful in documenting irreversible disease. At this point, however, there is still no clinical role for these techniques in individual patients suspected of harboring MS or already diagnosed with MS.
 FIGURE 6.27 The spectrum from a right frontal white matter demyelinating lesion in a patient with multiple sclerosis using a multivoxel (chemical shift imaging) two-dimensional magnetic resonance spectroscopic sequence demonstrates the expected findings of a decrease in N-acetylaspartate and an increase in choline. |
Among these techniques, 1H MR spectroscopy studies have reported decreased levels of NAA in active and chronic plaques, as well as in normal-appearing WM (86,87,88) (Fig. 6.27). Serial MR spectroscopic studies have shown that the NAA level can be partially restored, and the described reduced level in MS plaques does not imply irreversible damage (89). Instead, its recovery might be related to resolution of edema or recovery from sublethal neuroaxonal injury. There is also evidence of increased choline and lactate in the acute phase, likely related to active myelin breakdown/turnover (90) (Fig. 6.27). 1H MR spectroscopy is also useful for demonstrating abnormalities in deep GM structures in patients with MS, typically showing decreased NAA and increased myo-inositol levels in the thalamus and hippocampus (91). A different approach for measuring the total axonal and neuronal dysfunction in MS patients is the use of whole-brain NAA (WBNAA) (92), showing controversial correlations with clinical disability scores (93,94,95,96).
MT techniques have been applied to characterize MS lesions by MRI and to discern otherwise occult disease in normal-appearing brain tissues. The hypothesis underlying these investigations is that demyelination results in more free water (i.e., a reduction in the “bound” fraction of water) compared with myelinated WM or intact but edematous tissue (i.e., as an indirect measure of macromolecular content and the integrity of cellular structure). Pronounced reductions in MT ratios have been described in demyelinating lesions in experimental models (proportional to the degree of demyelination) and in patients with MS (97,98,99). Longitudinal evaluations showed partial to complete recovery of MT ratio values in newly forming lesions as the contrast enhancement resolved, suggesting either edema reabsorption or, more interesting, lesion repair (100,101). Some studies have also suggested that regions of normal-appearing WM with progressive MT ratio decrease will develop new lesions detectable on conventional imaging (102,103,104,105). There is also evidence of decreased MT ratios in normal-appearing WM, “dirty” WM, as well as GM in patients with MS (82) in comparison with matched controls (82), possibly related to low-grade demyelination, perivascular infiltration, or axonal/neuronal loss.
Diffusion-weighted MRI can provide qualitative and quantitative information regarding tissue structure based on the molecular motion of water (106). The unique organizational structure of mature (myelinated) WM has been postulated to cause anisotropy of diffusion (i.e., a directional restriction of water diffusion) compared with GM. DT imaging is a derivative imaging modality that allows the construction of a tensor (107) and incorporates directionality into the imaging experiment. Although it is not clear whether the myelin itself is the source of the anisotropy, abnormal diffusion characteristics (typically reduced anisotropy and increased mean diffusivity) have been reported for focal demyelinated lesions as well as for the normal-appearing WM and correlated with measures of clinical disability (82).
Fiber tractography allows the reconstruction and the investigation of specific WM tracts with the ultimate aim to improve system-specific clinical correlations (i.e., motor, visual, cognitive pathways) (108,109). Fewer fibers in corticospinal tracts were shown in patients with higher lesion loads and correlated with motor disability. Distal fiber loss and abnormal diffusion parameters were also noticed in patients with upstream lesions compatible with axonal transection and secondary Wallerian degeneration (110) (Fig. 6.28).
 FIGURE 6.28 Fractional anisotropy map (coronal view) and overlapping diffusion tensor tractography in a patient with relapsing–remitting multiple sclerosis. The number of fibers (orange) is significantly decreased caudal to a demyelinating lesion (purple, left centrum semiovale) in comparison with the controlateral normal white matter tract (cyan). |
 FIGURE 6.29 Extensive cervical spinal cord lesions in two patients with multiple sclerosis. A: Sagittal T2-weighted image (2,000/80) in the first patient shows extensive irregular high signal within the cord substance. B: Axial T2-weighted image in the first patient shows the typical peripheral location of the multiple sclerosis plaque. C: A second patient with multiple sclerosis shows an ill-defined lesion on T2-weighted image extending from the dorsal medulla to C2. D: Postcontrast T1-weighted image demonstrates minimal peripheral enhancement. |
Spinal Cord Imaging in MS
Multifocal spinal cord lesions have been detected in approximately 75% of MS patients irrespective of spinal cord symptoms (111,112,113,114). If a patient is shown to have an intramedullary lesion that is suspected to represent MS, a brain MR should always be performed to screen for asymptomatic multifocal disease (115), with the caveat that a normal brain MR in no way excludes MS as the diagnosis.
 FIGURE 6.30 Multiple sclerosis in the cervical spinal cord with enhancement. A,B: Sagittal T2-weighted magnetic resonance (MR) image. C,D: Sagittal T1-weighted MR image after gadolinium. Focal intramedullary lesions (A) show partial enhancement (B) in this multiple sclerosis patient with new symptoms. |
Most lesions are found in the cervical region (Fig. 6.29). Axial images demonstrate the typical peripheral location of MS lesions (commonly the dorsolateral aspect of the cord), where pial veins are adjacent to WM; however, involvement of both GM and WM by MS plaques can be seen. Gadolinium contrast administration frequently demonstrates enhancement of active spinal cord lesions (Fig. 6.30), depending on the nature
of the blood–cord barrier at the time of the scan. Enhancing MS plaques can be virtually indistinguishable from neoplastic lesions and other inflammatory lesions of the spinal cord (see Chapters 21 and 24), particularly when the spinal cord is enlarged due to edema. Therefore, clinical correlation and often serial follow-up scanning are necessary to formulate a specific diagnosis, especially in those cases in which MR of the brain is normal. Generalized (cervical > thoracic) spinal cord atrophy may also be seen and associated with a progressive clinical course and greater disability (116,117).
of the blood–cord barrier at the time of the scan. Enhancing MS plaques can be virtually indistinguishable from neoplastic lesions and other inflammatory lesions of the spinal cord (see Chapters 21 and 24), particularly when the spinal cord is enlarged due to edema. Therefore, clinical correlation and often serial follow-up scanning are necessary to formulate a specific diagnosis, especially in those cases in which MR of the brain is normal. Generalized (cervical > thoracic) spinal cord atrophy may also be seen and associated with a progressive clinical course and greater disability (116,117).
 FIGURE 6.31 Sagittal views of the cervical spinal cord in two patients with relapsing–remitting multiple sclerosis (A,B and C,D). Cord lesions (red arrows) are seen as hypointensities on 3D T1-weighted (A, C) and hyperintensities on STIR (B,D) sequences at 3-T MRI. Typically, multiple sclerosis spinal lesions extend less than three longitudinal segments and involve only partially the cross-sectional cord area (preferentially the posterior cord columns). |
T2-weighted spin-echo or fast spin-echo (FSE) and fast short-TI inversion recovery (STIR) sequences have been accepted as a clinical standard in the search for spinal cord MS lesions (Fig. 6.31). Despite the high sensitivity for detecting lesions in the brain, fast FLAIR images have been shown to be unreliable in the detection of MS lesions in the spinal cord (118), particularly in chronic lesions that may have relaxation values similar to those of the adjacent cord parenchyma and lose conspicuity within the cord. DTI studies have shown significantly increased mean diffusivity and decreased fractional anisotropy (FA), more prominent in the lateral and posterior regions of the cord (119,120,121). 1H MR spectroscopy of normal-appearing cervical cord in MS patients also shows evidence of decreased NAA when compared with healthy controls (122,123).
Optic Nerve Imaging in MS
Optic neuritis is the initial manifestation of MS in about 25% of cases and occurs during the course of the disease in 70% of cases (124). It is also estimated that 35% to 75% of patients with isolated optic neuritis go on to develop MS at some point during the next 15 years. The clinical conversion to MS is highly dependent on the co-presence of brain/spinal cord lesions suggestive of MS. In patients with clinically diagnosed optic neuritis, the roles of MR are the differential diagnosis, the detection of other brain and spinal cord lesions, and the related stratification of the risk of conversion to MS.
MRI of the optic nerve is challenging. Optic nerve involvement in MS is quite common clinically and at autopsy (56), but routine spin-echo sequences often fail to detect optic nerve involvement in clinically affected individuals. Other pulse sequences, including STIR and fat-suppressed fast spin echo, high-resolution T2-weighted fast spin-echo MR with fat suppression, and high-resolution postcontrast enhanced T1-weighted images, have been proposed to this attempt. With these techniques, optic neuritis appears as abnormal high signal intensity within the affected nerves (Fig. 6.32). DTI techniques showed increased mean diffusivity and decreased anisotropy values in the affected optic nerves (125). Optical coherence tomography (OCT) is a promising technique for evaluation and monitoring the retinal nerve fiber layer thinning in eyes affected and not affected by optic neuritis (126).
Variants
Less common variants of MS are occasionally seen and differ from classic MS in their clinical presentation, course, and histopathologic findings (127) (Table 6.1).
 FIGURE 6.32 Multiple sclerosis with optic neuritis. A: Coronal T2-weighted image (with fat suppression) through the optic nerves shows mild enlargement and high signal intensity within the left optic nerve (arrow). Postcontrast T1-weighted images (with fat suppression) demonstrate abnormal enhancement of the left optic nerve in the (B) coronal plane (arrow) and in the (C) axial plane. |
Acute MS (Marburg type) occurs as an infrequent variety of MS, most commonly in younger patients. It is often preceded by fever and typically has inexorable rapid progression to death within months. This fulminant form of MS has also been seen as a terminal event in classic MS. Pathologic findings of extensive myelin destruction, severe axonal loss, and early edema are seen. The typical MRI features of this variant include multiple, large, and often confluent lesions, which can involve the brainstem. Lesions can enhance and show perilesional edema. It is not rare to detect simultaneously a mixture of acute, subacute, and chronic lesions. Treatment is directed at reducing the inflammation. Although acute fulminant MS is associated with high morbidity and mortality, it may respond to aggressive immunosuppressive therapy (128).
Schilder type, or myelinoclastic diffuse sclerosis (Fig. 6.33), refers to an entity consisting of extensive, confluent, asymmetric demyelination of both cerebral hemispheres with involvement of the brainstem and cerebellum. It is usually seen in children presenting with seizures, signs of pyramidal tract involvement, ataxia, and psychiatric symptomatology. Adult cases have also been described (129). Typically, there is a rapid progression of disease over the course of 1 to 2 years, but the demyelinating process may be fulminant. Late in the disease, Wallerian degeneration and cavitation can be seen. The following criteria (130) have been proposed for the diagnosis: (a) a subacute or chronic myelinoclastic disorder with one or two roughly symmetrical lesions at least 2 cm × 3 cm in two of three dimensions; (b) involvement of the centrum semiovale; (c) these being the only lesions based on clinical, paraclinical, or imaging findings; (d) adrenoleukodystrophy must be excluded. In some cases, small MS-like lesions have been described in addition to large areas of demyelination.
Concentric sclerosis (Balò type) is a rare type of demyelinating disease in which large regions with alternating zones of demyelinated and myelinated WM are found (131). The unique pattern of demyelination has been, recently, ascribed to a hypoxia-like type of tissue injury (132). The upregulation of stress proteins (preconditioning) is thought to be responsible for the sparing of the thin external ring of myelinated WM (132). When encountered, Balò concentric sclerosis has a pathognomonic appearance on both pathology and MRI (42). These lesions appear as concentric rings of hyperintensity alternating with isointense WM on T2-weighted sequences and alternating rings of varying degrees of hypointensity on T1-weighted images (Fig. 6.34). 1H MRS has shown metabolic abnormalities similar to those seen in very large MS lesions (increased cho/Cr, decreased NAA/Cr, and increased lactate) (133), which tend to normalize on follow-up scans. Restricted diffusion along the surfaces of some Balò concentric sclerosis lesions may occur. These findings may normalize or become regions with increased diffusivity (134).
Neuromyelitis Optica and NMO Spectrum Diseases
Clinical Features
NMO or Devic’s disease is a severe relapsing disease that has a peculiar predilection for the optic nerve and spinal cord (Fig. 6.35). This condition has a different pathogenesis from MS since tissue injury is antibody dependent (aquaporin-4 antibody, AQP4Ab) and complement mediated. Patients experience acute relapses with poor recovery, leading early to major disabilities (quadriplegia and bilateral blindness) and death. Relapses are treated with IV steroids, while long-term treatments include anti-CD20 monoclonal antibody (rituximab) and other immunosuppressants (135).
The current NMO diagnostic criteria (136) require one attack of optic neuritis and transverse myelitis plus two of the three supporting criteria: a spinal cord lesion on MRI involving three or more cord segments, a brain MRI not meeting MS
diagnostic criteria or AQP4Ab seropositive status. Recently, the seropositivity for anti-myelin oligodendrocyte glycoprotein (MOG) antibodies has been detected in a small percentage of patients with clinical NMO and AQP4Ab seronegative, supporting the notion that NMO is a spectrum of diseases (137).
diagnostic criteria or AQP4Ab seropositive status. Recently, the seropositivity for anti-myelin oligodendrocyte glycoprotein (MOG) antibodies has been detected in a small percentage of patients with clinical NMO and AQP4Ab seronegative, supporting the notion that NMO is a spectrum of diseases (137).
 FIGURE 6.33 Schilder disease. A 13-year-old girl with a 10-day history of fever and worsening hemiparesis. A1,A2: Axial fluid-attenuated inversion recovery image demonstrates heterogeneous signal abnormality primarily within the right parietal lobe extending into and across the posterior corpus callosum. B1,B2: Note the peripheral low signal intensity that enhances on postcontrast T1-weighted images. This pattern of ill-defined peripheral enhancement (at the edge of a lesion) is frequently found in demyelination. C: Coronal postcontrast T1-weighted image demonstrates peripheral ill-defined enhancement in the same region. A follow-up magnetic resonance image (not shown) demonstrates dramatic regression of findings after the administration of steroids. (Courtesy of Dr. Gary L. Hedlund, Salt Lake City, UT.) |
 FIGURE 6.34 Balò concentric sclerosis in a 40-year-old woman. These 3-T images using T1 (A) and fluid-attenuated inversion recovery (B) clearly demonstrate spiral morphology of the right frontal lesion, the hallmark of Balò concentric sclerosis. (Courtesy of R. Mendonca, Sao Paulo.) |
 FIGURE 6.35 Devic disease; symptoms of transverse myelitis with optic neuritis. Coronal T2 (A) shows right optic nerve hyperintensity with enhancement (B) in a patient with optic neuritis. Cervical and thoracic spinal cord lesions (C) show patchy enhancement (D). |
Pathologic Features
AQP4 is a water channel mainly expressed by astrocytes and ependymal cells. In the spinal cord and optic nerves, early pathological changes are related to complement deposition and extensive granulocyte infiltration. Lesions are then characterized by pronounced loss of AQP4 positive astrocytes, demyelination, and severe axonal loss (138).
Imaging Findings
Brain and spinal cord MRI are always required to diagnose NMO. Differently from spinal cord MS lesions, the longitudinally extensive transverse myelitis involves usually three or more contiguous cord segments, both WM and GM are typically affected, and there is no predilection for the cervical cord. The acute myelitis is usually characterized by an inhomogeneous enhancement. Extensive optic nerve lesions may involve also the chiasm. While small T2 WM lesions are the most common brain MRI finding in NMO, they are not specific. However, other brain abnormalities have been identified that are highly characteristic for NMO. These include lesions around the third and fourth ventricles in the hypothalamus and area postrema and surrounding the aqueduct of Sylvius; these areas are rich in AQP4. Lesions in the area postrema at the floor of the fourth ventricle are thought to be responsible for the characteristic prodrome of vomiting and hiccups that occurs in around 10% of NMO patients at first presentation. However, such lesions in AQP4-rich regions only occur in between 5 and 10% of patients. Other brain abnormalities seen in NMO include brainstem lesions, particularly of the centrodorsal medulla and the pons, and large, even tumefactive, hemispheric lesions. At 7 T, NMO brain lesions are not perivenular on T2*-weighted scans and cortical lesions are absent. Using DTI, initial evidences suggest that the normal-appearing WM is spared from a diffuse pathological process (139). Cervical cord damage, quantified using MT MRI, is similar in NMO and MS patients (140), whereas a DT MRI study disclosed more severe cervical cord damage in NMO than in MS patients (141).
Inflammatory Demyelinating Pseudotumor
Clinical Features
Demyelinating diseases occasionally present as solitary, focal, or ill-defined space-occupying lesions in the brain that closely mimic a neoplasm both clinically and radiologically (142,143) (Fig. 6.36). These lesions have been called inflammatory pseudotumors, focal tumor–like demyelinating lesions, or inflammatory myelinoclastic diffuse sclerosis, terminology that is more pathologic jargon than actual entities with distinct pathologic features (144). These lesions
can be found in all age groups, but over half of them are seen in the third to fifth decades. Clinical manifestations are varied but strongly influenced by the anatomic location of the lesions, and respond to IV steroid administration. In a study by Kepes (144), most patients did not have any additional lesions during their follow-up period, but 1/10 of patients developed additional lesions consistent with the diagnosis of MS. In addition, none of these patients had a recent infection. A brain biopsy may be performed to establish the diagnosis because these lesions appear similar to neoplasms on imaging. If the diagnosis of demyelination is considered, biopsy can perhaps be delayed and patients can be imaged after treatment with steroids to look for regression of MR findings.
can be found in all age groups, but over half of them are seen in the third to fifth decades. Clinical manifestations are varied but strongly influenced by the anatomic location of the lesions, and respond to IV steroid administration. In a study by Kepes (144), most patients did not have any additional lesions during their follow-up period, but 1/10 of patients developed additional lesions consistent with the diagnosis of MS. In addition, none of these patients had a recent infection. A brain biopsy may be performed to establish the diagnosis because these lesions appear similar to neoplasms on imaging. If the diagnosis of demyelination is considered, biopsy can perhaps be delayed and patients can be imaged after treatment with steroids to look for regression of MR findings.
 FIGURE 6.36 Inflammatory demyelinating pseudotumor. Axial fluid-attenuated inversion recovery images demonstrate ill-defined high signal intensity within the right frontoparietal white matter (A) and effacement of adjacent gyri and extension along the length of the corticospinal tract, (B) the posterior limb of the internal capsule, and (C) the cerebral peduncle. Postcontrast axial T1-weighted image (D) shows ill-defined minimal enhancement. These findings mimic the appearance of a large infiltrative neoplasm. Biopsy confirmed the presence of demyelination. |
Pathologic Features
The biopsy material usually yields a histopathologic picture of acute demyelinating disease. Demonstration of demyelination and relative preservation of axons is mandatory before a diagnosis of demyelinating disease is made (Fig. 6.18). Typically, there is focal lymphocytic infiltration accompanied by macrophages. The ratio between lymphocytes and macrophages is very variable, depending on the timing of biopsy. There are also reactive astrocytes (145).
Imaging Findings
The imaging findings include large focal or ill-defined areas of hypodensity on CT, and MR shows these areas to be high in signal intensity on T2-weighted images. There may be a significant amount of swelling in the affected region of the brain, with mass effect on adjacent structures. The location of these lesions is typically in the hemispheric WM (Fig. 6.36) and occasionally in the cerebellar WM (144). In contrast to classic MS, there is no predilection for the periventricular WM, optic nerves, or brainstem. Follow-up imaging after steroids usually shows partial or complete resolution of these lesions.
Disorders with Secondary Demyelination and/or Destruction of White Matter
There is a spectrum of WM diseases having varying degrees of secondary demyelination or destruction of the WM and known etiologies. The pathologic changes are quite varied and may include pure demyelination, as in central pontine myelinolysis (CPM), or necrosis and demyelination, as in PML (see Table 6.2).
White Matter Diseases Associated with Viral Agents
Viral infections of the nervous system produce a spectrum of abnormalities based on the specific site affected (i.e., meninges, peripheral nervous system, or CNS) and the rate of progression of disease. These factors in turn determine the clinical presentation and the underlying pathologic changes. Demyelination may occur in association with viral agents by several potential mechanisms: (a) direct infection of oligodendrocytes (e.g., JC virus), (b) immune-mediated oligodendrocyte or myelin destruction by immune reactions against viral antigens, (c) secondary damage from immune complex formation, and (d) antimyelin autoimmune reactions. The glial and neuronal cells may be directly infected or destroyed, as seen in acute infective encephalitis and encephalomyelitis (see Chapters 14 and 24), or there may be an immune-mediated demyelination (acute disseminated encephalomyelitis [ADEM]) in which a virus is not isolated from the brain.
Acute Disseminated Encephalomyelitis (Perivenous Encephalomyelitis, Postinfectious Encephalomyelitis, Postvaccinal Encephalomyelitis, Acute Perivascular Myelinoclasis)
Clinical Features
ADEM is an inflammatory/demyelinating condition that is frequently seen in children, but individuals of all ages can be affected (146,147). It usually presents as a monophasic self-limited illness within weeks after a nonspecific respiratory infection, a specific viral illness (measles, rubella, mumps, chickenpox, Epstein–Barr virus, pertussis influenza, mycoplasma, Coxsackie B), or vaccination (rabies, diphtheria, smallpox, tetanus, or typhoid), or it can be seen spontaneously (146). Clinical manifestations commonly present days to several weeks after the inciting event with fever, headaches, meningeal signs that may progress to seizures, and focal neurologic deficits, including ataxia, cranial nerve palsies, choreoathetosis, stupor, and coma. There is usually a favorable response to intravenous glucocorticoids; however, in more severe cases glucocorticoids combined with plasmapheresis or intravenously administered immunoglobulin have been effective (148). The neurologic deficits usually resolve spontaneously within 1 month. Permanent neurologic sequelae occur in 10% to 20% of cases (149,150), and the residual complications are most commonly related to frequent seizures. Occasionally, there is a progressive downhill course, with severe paresis, neurologic dysfunction, and death.
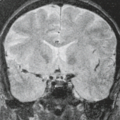
 FIGURE 6.37 Acute disseminated encephalomyelitis as multiple masses (biopsy proven). A–C: T2-weighted MR image. D–F: T1-weighted MR image after gadolinium. A child after viral illness presented with ataxia. Focal lesions with some mass effect (A–C) involve both gray (B) and white matter (A, C). Significant irregular enhancement (D–F) is also seen. |
Pathologic Findings
The CSF may be normal or show a pleocytosis of 1,000 or more cells/mm3, predominately neutrophils or mononuclear cells, a slight elevation of protein, and occasional oligoclonal IgG bands. The histologic appearance of ADEM is similar to that of experimental allergic encephalomyelitis (particularly the chronic form), supporting the hypothesis that ADEM results from an autoimmune response to a CNS antigen triggered by viral infections. The prominent histopathologic features of ADEM are lymphocytic infiltration of the meninges and perivascular spaces; perivascular infiltrates consisting of lymphocytes, reactive microglia, and foamy macrophages; numerous demyelinating foci scattered throughout the brain and spinal cord; vasculitis; and perivascular necrosis. Demyelination is largely limited to areas with inflammatory cell infiltration (147). Macroscopically, the brain is edematous, and herniation may be present.
MRI Findings
ADEM diagnosis is challenging. Some features make the MR appearance of ADEM partially distinguishable from that of MS, even if some patients initially diagnosed as ADEM go on to develop exacerbations of their neurologic symptoms and are reclassified as MS. Typically, lesions appear at the same time and concomitantly with clinical presentation. The brain involvement is bilateral (rarely unilateral) with asymmetric or symmetric multifocal lesions. The WM is more frequently involved than GM (deep GM nuclei and cortex), but usually both are affected. Within the WM, deep and juxtacortical WM is more involved than the periventricular one and the corpus callosum is rarely affected. Lesions occur usually both supratentorially and infratentorially (less commonly either/or) (147,151) (Figs. 6.37–6.39). Lesions may be large and masslike but characteristically show only mild
mass effect (Fig. 6.38). The contrast enhancement is variable, between 33% and 100%, thus the absence of enhancement does not lessen the likelihood of the diagnosis (151). Similar to MS, optic neuritis is common, and involvement of the spinal cord may be seen (Fig. 6.39). Follow-up MR commonly demonstrates marked decrease in the size and number of the lesions, and complete resolution of disease may be seen in response to steroids in conjunction with clinical improvement (Fig. 6.38). A large effort has been devoted to define those MRI parameters capable to differentiate MS from ADEM in pediatric populations. A recent investigation has shown that the presence of either at least one T1-hypointense lesion or one or more periventricular lesions is associated with an increased likelihood of MS (152). Using MT MRI and DT MRI, no abnormalities of the normal-appearing brain tissue and spinal cord have been detected in ADEM patients after the acute phase of the disease (153), whereas mild DT MRI abnormalities of the basal ganglia have been described (154). 1H MR spectroscopy studies provided conflicting results in ADEM: some authors found no metabolic abnormalities in the acute stage of the disease, and others described a transient decrease of NAA in regions corresponding to T2 lesions on the 1H MR spectroscopy obtained during the acute phase which normalized after clinical recovery (155,156).
mass effect (Fig. 6.38). The contrast enhancement is variable, between 33% and 100%, thus the absence of enhancement does not lessen the likelihood of the diagnosis (151). Similar to MS, optic neuritis is common, and involvement of the spinal cord may be seen (Fig. 6.39). Follow-up MR commonly demonstrates marked decrease in the size and number of the lesions, and complete resolution of disease may be seen in response to steroids in conjunction with clinical improvement (Fig. 6.38). A large effort has been devoted to define those MRI parameters capable to differentiate MS from ADEM in pediatric populations. A recent investigation has shown that the presence of either at least one T1-hypointense lesion or one or more periventricular lesions is associated with an increased likelihood of MS (152). Using MT MRI and DT MRI, no abnormalities of the normal-appearing brain tissue and spinal cord have been detected in ADEM patients after the acute phase of the disease (153), whereas mild DT MRI abnormalities of the basal ganglia have been described (154). 1H MR spectroscopy studies provided conflicting results in ADEM: some authors found no metabolic abnormalities in the acute stage of the disease, and others described a transient decrease of NAA in regions corresponding to T2 lesions on the 1H MR spectroscopy obtained during the acute phase which normalized after clinical recovery (155,156).
Related posts:
Stay updated, free articles. Join our Telegram channel

Full access? Get Clinical Tree


