Device
High-end duplex sonography devices
Transducer
Phased-array probe
Probe emission frequency
1.8–3.5 MHz
Insonation depth
14–16 cm
Dynamic range
45–55 dB
Contour amplification
Medium to high
Time gain compensation
Adjusted as needed
Image brightness
Adjusted as needed
Postprocessing function
Moderate suppression of low echo signals
Until recently, a number of devices from different manufacturers have been used by various publishing workgroups evidencing that sufficient resolution quality may be obtained by different machines [9, 10]. Nevertheless, since image resolution may vary between different devices, consensus guidelines suggest for quantitative assessments the generation of norm values in each ultrasound laboratory by examining a representative population of healthy subjects (see below) [11, 12].
Based on these requirements, sonographic axial resolution of structures in the focus zone reach 0.7–1.0 mm and the lateral resolution is approximately 3 mm depending on the device [13]. Using modern equipment in contemporary high-end machines, resolution in the focus zone has been proven to be even higher (0.6 × 1.1 mm), thus even exceeding resolution of magnetic resonance imaging (MRI; 1.0 × 1.0 mm) in a comparative TCS/MRI phantom study [13]. In addition, TCS benefits from the dynamic procedure: movement artifacts may be compensated for by firm pressure of the probe against the temporal bone window and a continuous optimization of probe position.
Examination Procedure
In general, patients are examined in supine position in a darkened calm room. The probe is pressed firmly on the preauricular bone in the imagined orbitomeatal line (Fig. 5.1). To obtain the best possible image, the probe is slightly tilted upward and downward. Due to insufficient resolution in the near-field of the probe, structures at a depth of less than 2 cm cannot be adequately displayed. The focus zone of low-frequency transducers is between 5 and 7 cm distance from the probe [9]. Based on these circumstances, only near-midline structures are evaluated from the ipsilateral bone window whereas all other brain regions are assessed from the contralateral side to achieve optimized resolution.
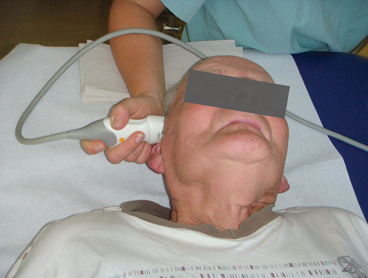
Fig. 5.1
Transcranial ultrasound examination through the preauricular temporal bone window
Pathological changes of the cerebral echomorphology are described as “hyperechogenicity” in case of: (1) abnormally large areas of (physiologically) increased echogenicity with planimetrically measured values out of the limits of a comparative norm collective (i.e., substantia nigra), or (2) in case of an irregular increase of echogenicity compared to the surrounding tissue where under normal conditions isoechogenicity is expected (i.e., basal ganglia). “Hypoechogenicity ” of a certain brain region is defined as a missing or abnormally small area of regularly increased echogenicity. Here, planimetrically measured values of hyperechogenic regions should fall below clearly defined normative collective percentiles.
Tissue harmonic imaging (THI) , meaning the use of harmonic ultrasound reflections, does enhance tissue contrast and resolution. However, use of THI limits sufficient resolution in deeper, frontal, and dorsal areas and produces more artifacts. Moreover, areas of hyperechogenicity seem to be disproportionately large, thus exaggerating some structures [14]. These limitations lead to the convention that all quantitative and semiquantitative assessments of brain structure be achieved exclusively using conventional B-mode.
Examination Planes
Mesencephalic plane—TCS examination starts in the mesencephalic plane (Fig. 5.2). Here the butterfly-shaped mesencephalic brainstem in the center of the image is easy to identify. It exhibits a rather low echogenicity and is surrounded by the hyperechogenic perimesencephalic cisterns. Both hypoechogenic crura cerebri are separated by a prominent hyperechogenic midline structure that divides the butterfly into halves or the two “wings”. This so-called “brainstem raphe” widens toward the dorsal proportion of the midbrain where the hyperechogenic signal corresponds to the aqueduct traversing the upper brainstem in a craniocaudal direction. Within the hypoechogenic crus cerebri, a slim line or small patchy oval spot of increased echogenicity is regularly found at the anatomical site of the SN . The adjacent red nucleus (RN) can be identified at the mediorostral end of the SN signal and also exhibits high echogenicity. It is important to selectively look for the RN in order to avoid misinterpretation of the signal of the RN as signal of the SN and to assess both structures separately from each other (inner structures of the midbrain in Fig. 5.3a, b.
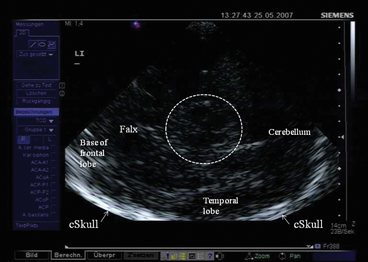
Fig. 5.2
Mesencephalic examination plane. Encircled: mesencephalic brainstem. cSkull contralateral skull (arrows), LI insonation from the left side
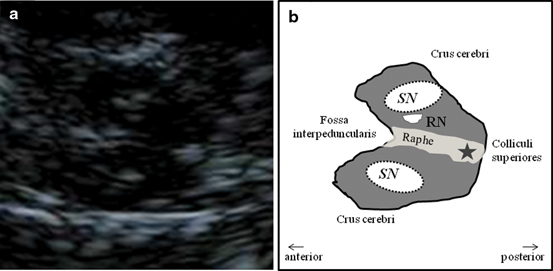
Fig. 5.3
Inner structure of the mesencephalic brainstem (a) and corresponding schematic drawing (b). SN substantia nigra, RN red nucleus, Star aqueduct
Assessment of Inner Structures in the Mesencephalic Plane
Substantia Nigra
After having identified the regularly small SN signal within the midbrain butterfly, position of the probe is minimally varied in order to find the signal in its maximal extent (Fig. 5.4a). This image is frozen immediately and magnified two-fold to four-fold (Fig. 5.4b). It is recommended to freeze the image in order to avoid losing its configuration and extent while zooming it. The magnified SN signal is encircled with the cursor and planimetric measurement is completed automatically by the machine and given in “cm2” (Fig. 5.4c) [11, 12].
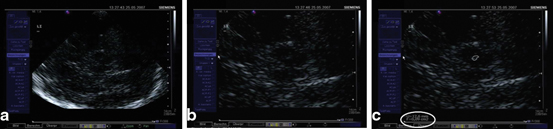
Fig. 5.4
Visualization (a), magnification (b), and planimetric measurement of the echogenic signal of the substantia nigra (0.09 cm²) (c)
Brainstem Raphe
The hyperechogenic brainstem raphe (see Fig. 5.3a, b) is evaluated with respect to its continuity. Under normal conditions, an undisrupted hyperechogenic line is depictable from the rostral to the dorsal extent of the midbrain. Raphe echogenicity is rated semiquantitatively into normal, interrupted, and not visible at all [11, 12, 15].
Assessment of Inner Structures in the Third Ventricle Plane
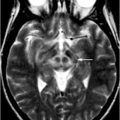
By tilting the probe slightly upward, the third ventricle plane is reached (Fig. 5.5a–c). In the center of the image, the third ventricle is easily visible. It appears as two horizontal parallel lines of clear hyperechogenicity where the ultrasound beam meets the borders of ependyma to the cerebrospinal fluid in an orthogonal manner. Both lines enfold an almost anechogenic zone corresponding to the cerebrospinal fluid. In the frontal parts of the image in the elongation of the third ventricle, another two hyperechogenic almost parallel lines are visible and correspond to the septum pellucidum and the lateral wall of the frontal horn of the contralateral lateral ventricle. The posterior horn of the lateral ventricle is visualized as a hyperechogenic area at its anatomical site due to the embedded choroid plexus which is frequently calcified exhibiting an increased echogenicity.
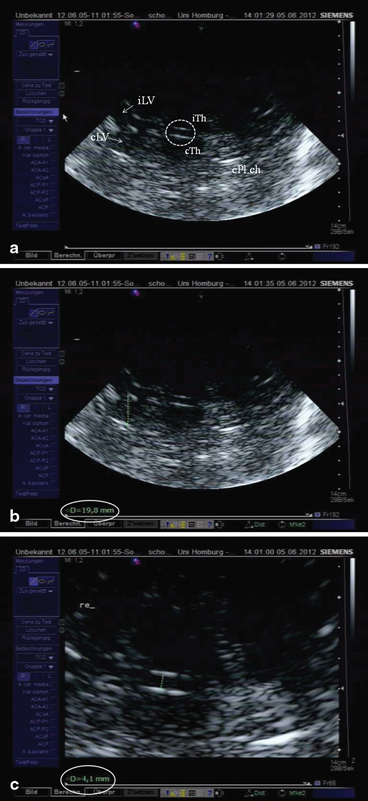
Fig. 5.5
a Ventricular or basal ganglia plane. Encircled third ventricle, iTh ipsilateral thalamus (arrow), cTH contralateral thalamus (arrow), iLV ipsilateral lateral ventricle, cLV contralateral lateral ventricle, cPL.ch. hyperechogenic contralateral Plexus choroideus within the posterior horn of the lateral ventricle. b Measurement of the diameter of the frontal horn of the contralateral lateral ventricle (19.8 mm). c Measurement of the diameter of the third ventricle (4.1 mm)
These ventricular structures embrace the basal ganglia area in which the different nuclei are normally isoechogenic to the surrounding parenchyma. Still the thalamus is regularly identifiable due to its location adjacent to the third ventricle and its normally, rather deeply, hypoechogenic echomorphology.
Assessment of the Ventricle Plane
Width of the Third Ventricle
To measure the width of the third ventricle, the two hyperechogenic lines reflecting the ependyma are displayed in their maximal distance from each other, the image is frozen and magnified, and the transverse diameter is measured from the ipsilateral to the contralateral inner layer of hyperechogenic ependyma (see Fig. 5.5b). Measurement is done at the narrowest point. Mean values for the third ventricle have been shown to be 4.8 ± 1.9 mm with an age-related increase. In subjects older than 60 years of age, mean values were 7.6 ± 2.1 mm [7]. Thus, normative values for individuals < 60 years are < 7 mm and > 60 years < 10 mm. Correlation to measurements using CT was high (r = 0.83) [7].
Width of the Frontal Horns of the Lateral Ventricles
The contralateral frontal horn is displayed and the image is frozen. Again, the transverse diameter is measured from the ipsilateral to the contralateral inner layer of hyperechogenic ependyma (see Fig. 5.5b) perpendicularly from the septum pellucidum to the tip of the frontal horn (Fig. 5.5c). Mean values for the anterior horn were 16.7 ± 2.3 mm for patients under the age of 60 years, and 19.0 ± 2.9 mm for elderly persons, respectively [7]. Correlation with CT scan measurements were slightly weaker than measurements of the third ventricle, but still sufficiently high (r = 0.73) [7].
Changes of Echomorphology of the Basal Ganglia
Since the basal ganglia (caudate and lenticular nucleus) and the thalamus in this plane usually exhibit isoechogenicity , they are not distinguishable from each other. In case of an abnormal increase of echogenicity, it is described according to the anatomic region. To further characterize abnormal findings, it may be manually encircled and planimetrically measured regarding the extent of hyperechogenic area.
Assessment of the Cella Media Plane
When the probe is tilted upward even further, the horizontal part of the lateral ventricle is visualized (Fig. 5.6). Its sonographic aspect is called “cella media.” In the cella media plane, measurement of the ventricular width is possible following the same procedure as in the third ventricular plane. This plane has no importance for the ultrasonographic assessment of patients with movement disorders and is thus not commonly used.
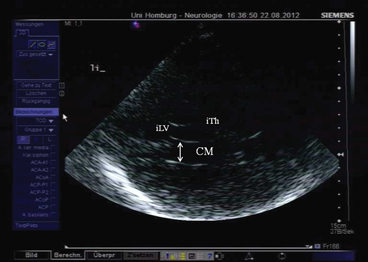
Fig. 5.6
Cella media plane. CM cella media, iTh ipsilateral thalamus, iLV ipsilateral lateral ventricle
Assessment of the Cerebellar Plane
This plane is more rarely used. Nevertheless, it shows interesting changes of echomorphology in a number of diseases affecting the cerebellum. The cerebellum in the posterior fossa is visualized by rotating the probe with its dorsal parts for about 45° downward and tilting it upward for another 10–15°. The resulting cerebral image displays characteristically both the midbrain and the thalamus bilaterally [9]. Dorsal to the brainstem, the hypoechogenic fourth ventricle and the adjacent dentate nucleus (DN) as well as further parts of the cerebellum can be identified. Echogenicity of the DN and the depictable parts of the cerebellar hemispheres have been shown to be increased in patients with spinocerebellar atrophy [16]. The width of the fourth ventricle which presents in the normal case as a comma-shaped hypoechogenic structure may enlarge considerably under pathological conditions. It can be measured using the perpendicular diameter or the planimetric area [9], normative values, however, are pending. Echogenicity of the DN and the depictable parts of the cerebellar hemispheres have been shown to be increased in some forms of spinocerebellar ataxia [16–18] and Friedreich’s ataxia [19].
Limitations
Using TCS in neuroimaging of the brain, one has to keep in mind that parts of the cerebrum are not visualizable by this technique. These are mainly the brain regions near the probe comprising the superficial two centimeters of the ipsilateral temporal lobe, the lower brain parts adjacent to the base of the skull, and the very apical frontoparietal area that is insonable through the preauricular transtemporal bone window. The quality of the temporal bone window itself limits the application of TCS in about 10–20 % of Caucasian subjects age-dependently and gender-dependently with a higher prevalence of bad transcranial insonation qualities in elderly females presumably due to osteoporosis [11, 20]. Besides, ethnicity influences the proportion of insufficient bone windows within a population considerably with up to 60 % of insonable cases in Asian subjects [21, 22].
Examiner experience may limit the quality of TCS assessment substantially since—as always with ultrasound methods—it takes a certain number of examinations until echogenicity and structures are correctly identified and evaluated.
Clinical Application of TCS in Movement Disorders
Parkinson Disease—Typical Findings
Georg Becker was the first to describe changes of the normal echomorphology of the SN in patients with iPD [8]. In his pilot study, he saw a characteristic increase of echogenicity at the anatomical site of the SN within the normally, rather homogenously, hypoechogenic midbrain that he called “SN hyperechogenicity” (SN+; see Fig. 5.7). During the last 15 years, numerous groups were able to reproduce this finding spreading the idea of SN+ as a biomarker of iPD, a thought that had already been formulated by Becker, all over the world [26–34].
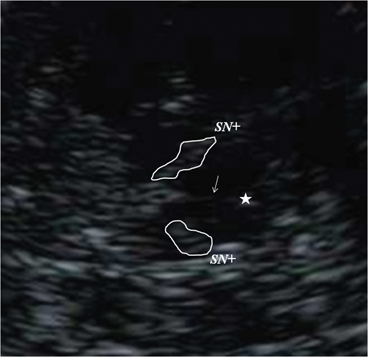
Fig. 5.7
Bilateral hyperechogenicity of the substantia nigra (SN+). Arrow brainstem raphe, Star aqueduct
Nearly universally, SN+ has been described in various collectives to occur in about 90 % of the examined patients leading to a sensitivity of the presumed iPD biomarker that reached in different studies 86–91 % whereas specificity was 82.4–96 % [30, 34–36]. TCS examination in patients with first motor abnormalities, insufficient for the clinical diagnosis of PD were found to have SN+ in the vast majority of cases cumulating in a high positive predictive value of 92.9 % for the diagnosis of iPD, which was clinically established within another year [36]. Similar positive predictive values from 83 to 100 % were also found by other groups [23, 34, 35, 37].
Important Characteristics of SN+ in iPD
SN+ has been shown to be more prominent contralateral to the clinically more affected body side [22, 26, 38]. Patients with a tremor predominance type were found to exhibit rather asymmetric SN+ whereas patients with akinetic-rigid or equivalent types were more symmetric in their area of SN+ [38]. Early-onset PD had larger SN+ than late-onset PD patients [38, 39]. The area of SN+ has been proven to be independent of age or gender [38]. It does not correlate with disease duration, nor with stage or severity of motor symptoms [38]. Moreover, the intraindividual signal stays stable throughout the course of the disease in follow-up examinations of iPD patients for up to 10 years in spite of disease progression and clinical deterioration [40, 41]. These findings underline that SN+ seems to be rather a trait marker of iPD than a progression marker and may not be used to estimate the extent of neurodegeneration. Comparative imaging studies using radiolabeled tracers have substantiated this view: the area of SN+ did not correlate with [18Fluoro] Dopa positron emission tomography (PET) [42], nor with β-CIT single photon emission computed tomography (SPECT) in most studies [35, 43, 44] or with 123I-MIBG scintigraphy [22, 45]. In contrast to SN+, both [18Fluoro] Dopa PET and β-CIT SPECT findings have been shown to be related to the extent of nigrostriatal impairment and to clinical severity. Also, MIBG scintigraphy that mirrors sympathetic denervation of the heart in PD correlates with disease severity in later stages [46], which is different from the trait marker SN+.
Consensus criteria have defined a “marked” SN+ as an abnormally large area of increased echogenicity that reaches planimetrically measured values above the 90th percentile of a representative norm collective examined in the same ultrasound laboratory. Values above the 75th percentile represent “moderate” SN+ [11, 12].
Causes of Substantia Nigra Hyperechogenicity
The exact pathophysiological changes underlying SN+ are not fully understood. Animal and postmortem studies emphasize the role of increased iron content and microglial activation: SN echogenicity in rats increased dose-dependently after unilateral injection of iron into the SN compared to the noninjected side [47]. Postmortem examinations in non-Parkinsonian brain tissue samples showed a positive correlation between hyperechogenic SN areas and increasing iron levels and H-ferritin and L-ferritin levels whereas an inverse correlation was found between SN echogenicity and neuromelanin content [48–51]. In a subsequent postmortem study, SN echogenicity correlated with activated microglia [52]. Both phenomena—microglial activation and increased iron content—characterize nigral iPD pathology and are therefore likely to actually play a key role in the formation of SN+. Though there are still open questions, e.g., the understanding of the stability of the echomarker during the course of the disease in spite of ongoing neurodegeneration and the occurrence of SN+ in healthy controls (see the following section).
Monogenetic Parkinsonian Syndromes (gPS)
There is increasing knowledge on mutations in numerous genes leading to hereditary forms of gPS. Although the number of individuals with monogenetic PD assessed by TCS is still limited, it is well established by different groups that both autosomal dominant as well as autosomal recessive forms of PD are associated with SN+. Examples are studies in PINK 1-associated PD [53], DJ-1 associated PD [54], alpha-synuclein associated PD [54, 55], and LRRK2-associated PD. Interestingly, in some forms of monogenetic PD, SN+ has been described as rather moderate [54, 56]. Still, it was present, similar to mutations in the glucocerebrosidase gene or GBA-associated PD [57], which is the most common genetic risk factor known so far.
Importantly, TCS studies in autosomal dominant as well as in recessive forms of gPS have shown echo changes with SN+ in clinically asymptomatic mutation carriers. For example, in asymptomatic Parkin mutation carriers SN+ could be detected even in those subjects with normal [18Fluoro] Dopa PET suggesting that SN+ may indicate preclinical parkinsonism in individuals with a genetically determined risk for PD even before visible effects on the nigrostriatal system [58, 59]. These findings further underline the concept of SN+ as a nigrostriatal vulnerability marker or risk marker for the future development of a Parkinsonian syndrome [60].
Premotor Diagnosis of Idiopathic Parkinson Disease
In the pilot study of Becker et al., two healthy control subjects were found to exhibit SN+ [8]. One of them developed a clinically manifest iPD within a couple of years leading to the question of whether SN+ in iPD may precede motor symptoms (unpublished data) as could be shown in Parkin-related monogenetic PD years later [58].
Based on these speculations, large collectives of healthy subjects were examined to define the prevalence of SN+ within the normal population. In a first study including more than 300 asymptomatic control subjects of all age groups from 20 to 80 years, SN+ prevalence turned out to be nearly 9 % [48, 50, 51]. Although these individuals had no abnormalities in the neurological and neuropsychological tests, 60 % of an SN+ subgroup examined by [18Fluoro] Dopa PET showed reduced striatal tracer uptake compared to controls without the echofeature (SN−) [48, 50, 51]. Obviously, the echostatus SN+ seems to be associated with a subclinical alteration of the nigrostriatal system. Further evidence for a functional relevance of SN+ in non-Parkinsonian subjects arose from the finding that psychiatric patients who developed neuroleptic-induced parkinsonism had larger echogenic SN areas than those patients treated without extrapyramidal side effects [61]. Moreover, in healthy elderly subjects, SN+ was significantly associated with clinical signs of motor slowing or tremor [24, 62]. In demanding motor tasks such as tap-dancing, subtle motor deficits were visible in SN+ dancers [63]. In conclusion, these findings indicated SN+ as a possible risk marker for the development of Parkinsonian symptoms, which may become clinically evident under challenging conditions.
Also, the finding that SN+ is more frequently found in healthy first-degree relatives of iPD patients compared to individuals without a close family relation to an iPD patient [64] strengthens the hypothesis that the echomarker SN+ represents a risk factor for iPD, since a positive family history doubles the risk for iPD. Based on these findings, the PRIPS multicenter study (Prospective Validation of Risk Factors for the Development of Parkinsonian Syndromes) was initiated to prospectively follow a large cohort of > 1800 healthy individuals aged > 50 years with the aim of correlating future iPD conversion to baseline SN echostatus and other iPD risk and premotor markers. Baseline assessment revealed an association of SN+ with the known iPD risk factors such as male gender and positive family history [65] and with putative iPD premotor symptoms such as hyposmia, cognitive decline, and subtle signs of motor slowing [12, 66–68]. These findings are in line with other cross-sectional studies describing the association of SN+ with a number of premotor markers including olfactory deficits [69, 70], motor slowing [24], depression [71], and REM sleep behavior disorder [72].
Follow-up of the PRIPS cohort after 3 years revealed that 8 of the 11 iPD converters exhibited the echomarker SN+ at baseline (one patient had an insufficient transtemporal bone window) resulting in a 17-fold increased relative risk to develop iPD within a 3-year period in individuals aged 50 years or above with SN+ [73]. This is an extremely high-risk factor, promising for the inclusion of TCS in future assessment batteries for the early (possibly even premotor) diagnosis of PD.
Atypical Parkinsonian Syndromes (aPS)
Differentiation of a diagnosis of iPD from aPS such as multisystem atrophy (MSA) and progressive supranuclear palsy (PSP) is challenging, especially in early disease stages when symptoms overlap and clinical presentation is oligosymptomatic. Nevertheless, an early correct diagnosis is essential for both physicians and patients since therapeutic options and prognosis differ considerably in iPD and aPS.
MRI or SPECT using radiolabeled tracers have been suggested to be of use in the diagnostics of aPS. Still they bear the drawback of limited availability, radiation exposure for the patient, and high cost. Moreover, structural changes on MRI, indicative for aPS, occur rather late in the disease course, as they are signs of neurodegeneration/atrophy.
A number of studies using TCS could prove its utility in differentiating aPS from iPD in clinically suggestive cases [21, 34, 37]. Walter et al. examined 25 patients with aPS with TCS and compared the findings with 25 age-matched iPD patients [34]. He could show that aPS patients rarely exhibit SN+ (only 9 % of aPS patients) which was found in 24 of the 25 iPD patients, as expected. SN+ in the two aPS patients was moderate only but interestingly a hyperechogenicity of the lenticular nucleus (LN+) could be found in more than three quarters of aPS patients in contrast to only one-fifth of iPD patients [34]. These results were substantiated in a large sample of aPS and iPD patients (34 MSA, 21 PSP, 102 iPD) [37]. The combination of a normal or at maximum moderately hyperechogenic SN echomorphology with LN+ predicted MSA or PSP with a positive predictive value of 0.96 whereas SN+ in case of a regularly hypoechogenic presentation of basal ganglia in the ventricular plane indicated iPD with a positive predictive value of 0.91 [37]. In a subsequent study, Walter et al. stressed further that third-ventricle dilatation of more than 10 mm in combination with LN+ indicated PSP [74, 75].
In contrast, patients with corticobasal degeneration (CBD) showed marked SN+ [74] as well as patients with dementia with Lewy bodies (DLB) who were found to exhibit symmetric bilateral marked SN+ [76]. These findings are most important since they revealed that the echomarker SN+ is not an exclusive feature of iPD. Also, some cases of SCA or Huntington’s disease may display SN+. Therefore, TCS results should always be placed into the context of clinical and anamnestic data.
< div class='tao-gold-member'>
Only gold members can continue reading. Log In or Register to continue
Related posts:

Stay updated, free articles. Join our Telegram channel

Full access? Get Clinical Tree


